
記住我


The current study uses primarily data from the treatment arm of an RCT (ClinicalTrials.gov: NCT03238872, registration date: 03/08/2017) comparing PMHC to TAU [30]. The RCT was conducted within routine care in two Norwegian municipalities; Kristiansand and Sandnes, from 2015 to 2017. Details about the trial design are provided in the primary evaluation of the RCT [32].
ParticipantsEligibility for the PMHC service is based on a defined set of inclusion and exclusion criteria, which were also applied in the trial [30]. The main inclusion criteria were anxiety and/or mild to moderate depression (defined as Generalized Anxiety Disorder scale (GAD-7) and/or Patient Health Questionnaire (PHQ-9) scores above cut-off), ≥ 18 years of age, living in Kristiansand or Sandnes, and basic Norwegian language proficiency [30].
All clients contacting PMHC in Sandnes and Kristiansand got an appointment for individual assessment at the PMHC clinic. As described in our earlier work [30], the therapist examined the relevance and severity of the mental health problems, the available client resources, and motivation for treatment. Information about the study and the treatment methodology within PMHC was provided to the client. All information was then reviewed by the therapist upon which the decision on inclusion/exclusion was made, always in consultation with the client [30].
Clients who agreed to participate were asked to register to a secure online data portal specifically developed for the evaluation of PMHC by the Norwegian Centre for Research Data (NSD). When registered, the participants filled in the baseline questionnaire. Following completion, the participants were randomized to intervention and control based on a 70:30 ratio. In total, 774 clients participated in the trial and similar to previous studies only clients scoring above cut-off on symptoms of depression and/or anxiety were included [30]. For the present study, primarily data from participants who received PMHC were used (n = 459), while descriptive statistics from the control arm were only used for illustrative purposes (n = 215).
InterventionsDetails on the interventions are described previously [22, 30, 31], but a summary follows below.
Care in PMHC is based on cognitive behavioral therapy (CBT) [17, 22]. All therapists have received training in delivering CBT. Both low intensity care (i.e. guided self-help and psycho-educative courses) and high intensity care (individual face-to-face therapy) are offered, in stepped care variants [17, 22]. Client preferences and information from the initial assessment are used to determine care. In accordance with the official guidelines from the Norwegian Directorate of Health [17], most clients were initially offered a four-session psychoeducational course.
In the PMHC group, clients took part in a median of 5 (IQR = 4–9) treatment sessions [30]. Less than one percent received guided self-help as the primary care form. About one third had group-based psychoeducation as the primary care form, one in third had individuals CBT as the primary care form, and one in three received a combination of these care forms. Almost 80% completed treatment (defined as therapist reporting the treatment goal as fulfilled and/or having completed at least six sessions), and the median length of treatment was 9.4 weeks (IQR 4.9– 21.1) [22].
Care in the TAU potentially included all ordinary services available to the target population. Examples are follow-up by the GP, private psychologists and occupational health services. In the letter where TAU clients were informed about their allocation, they were also encouraged to contact their GP for further follow-up. References to publicly available self-help resources (internet, books) were also included.
A year after PMHC, about 1 in 4 of respondents in the PMHC group reported to have (since baseline) received additional care for their mental health problem from outside of PMHC [31]. For 12% of the participants, care had been provided by other specialist health services. In the TAU group, 50% of respondents had since baseline received care for their mental health problem, 42% from specialist services [31].
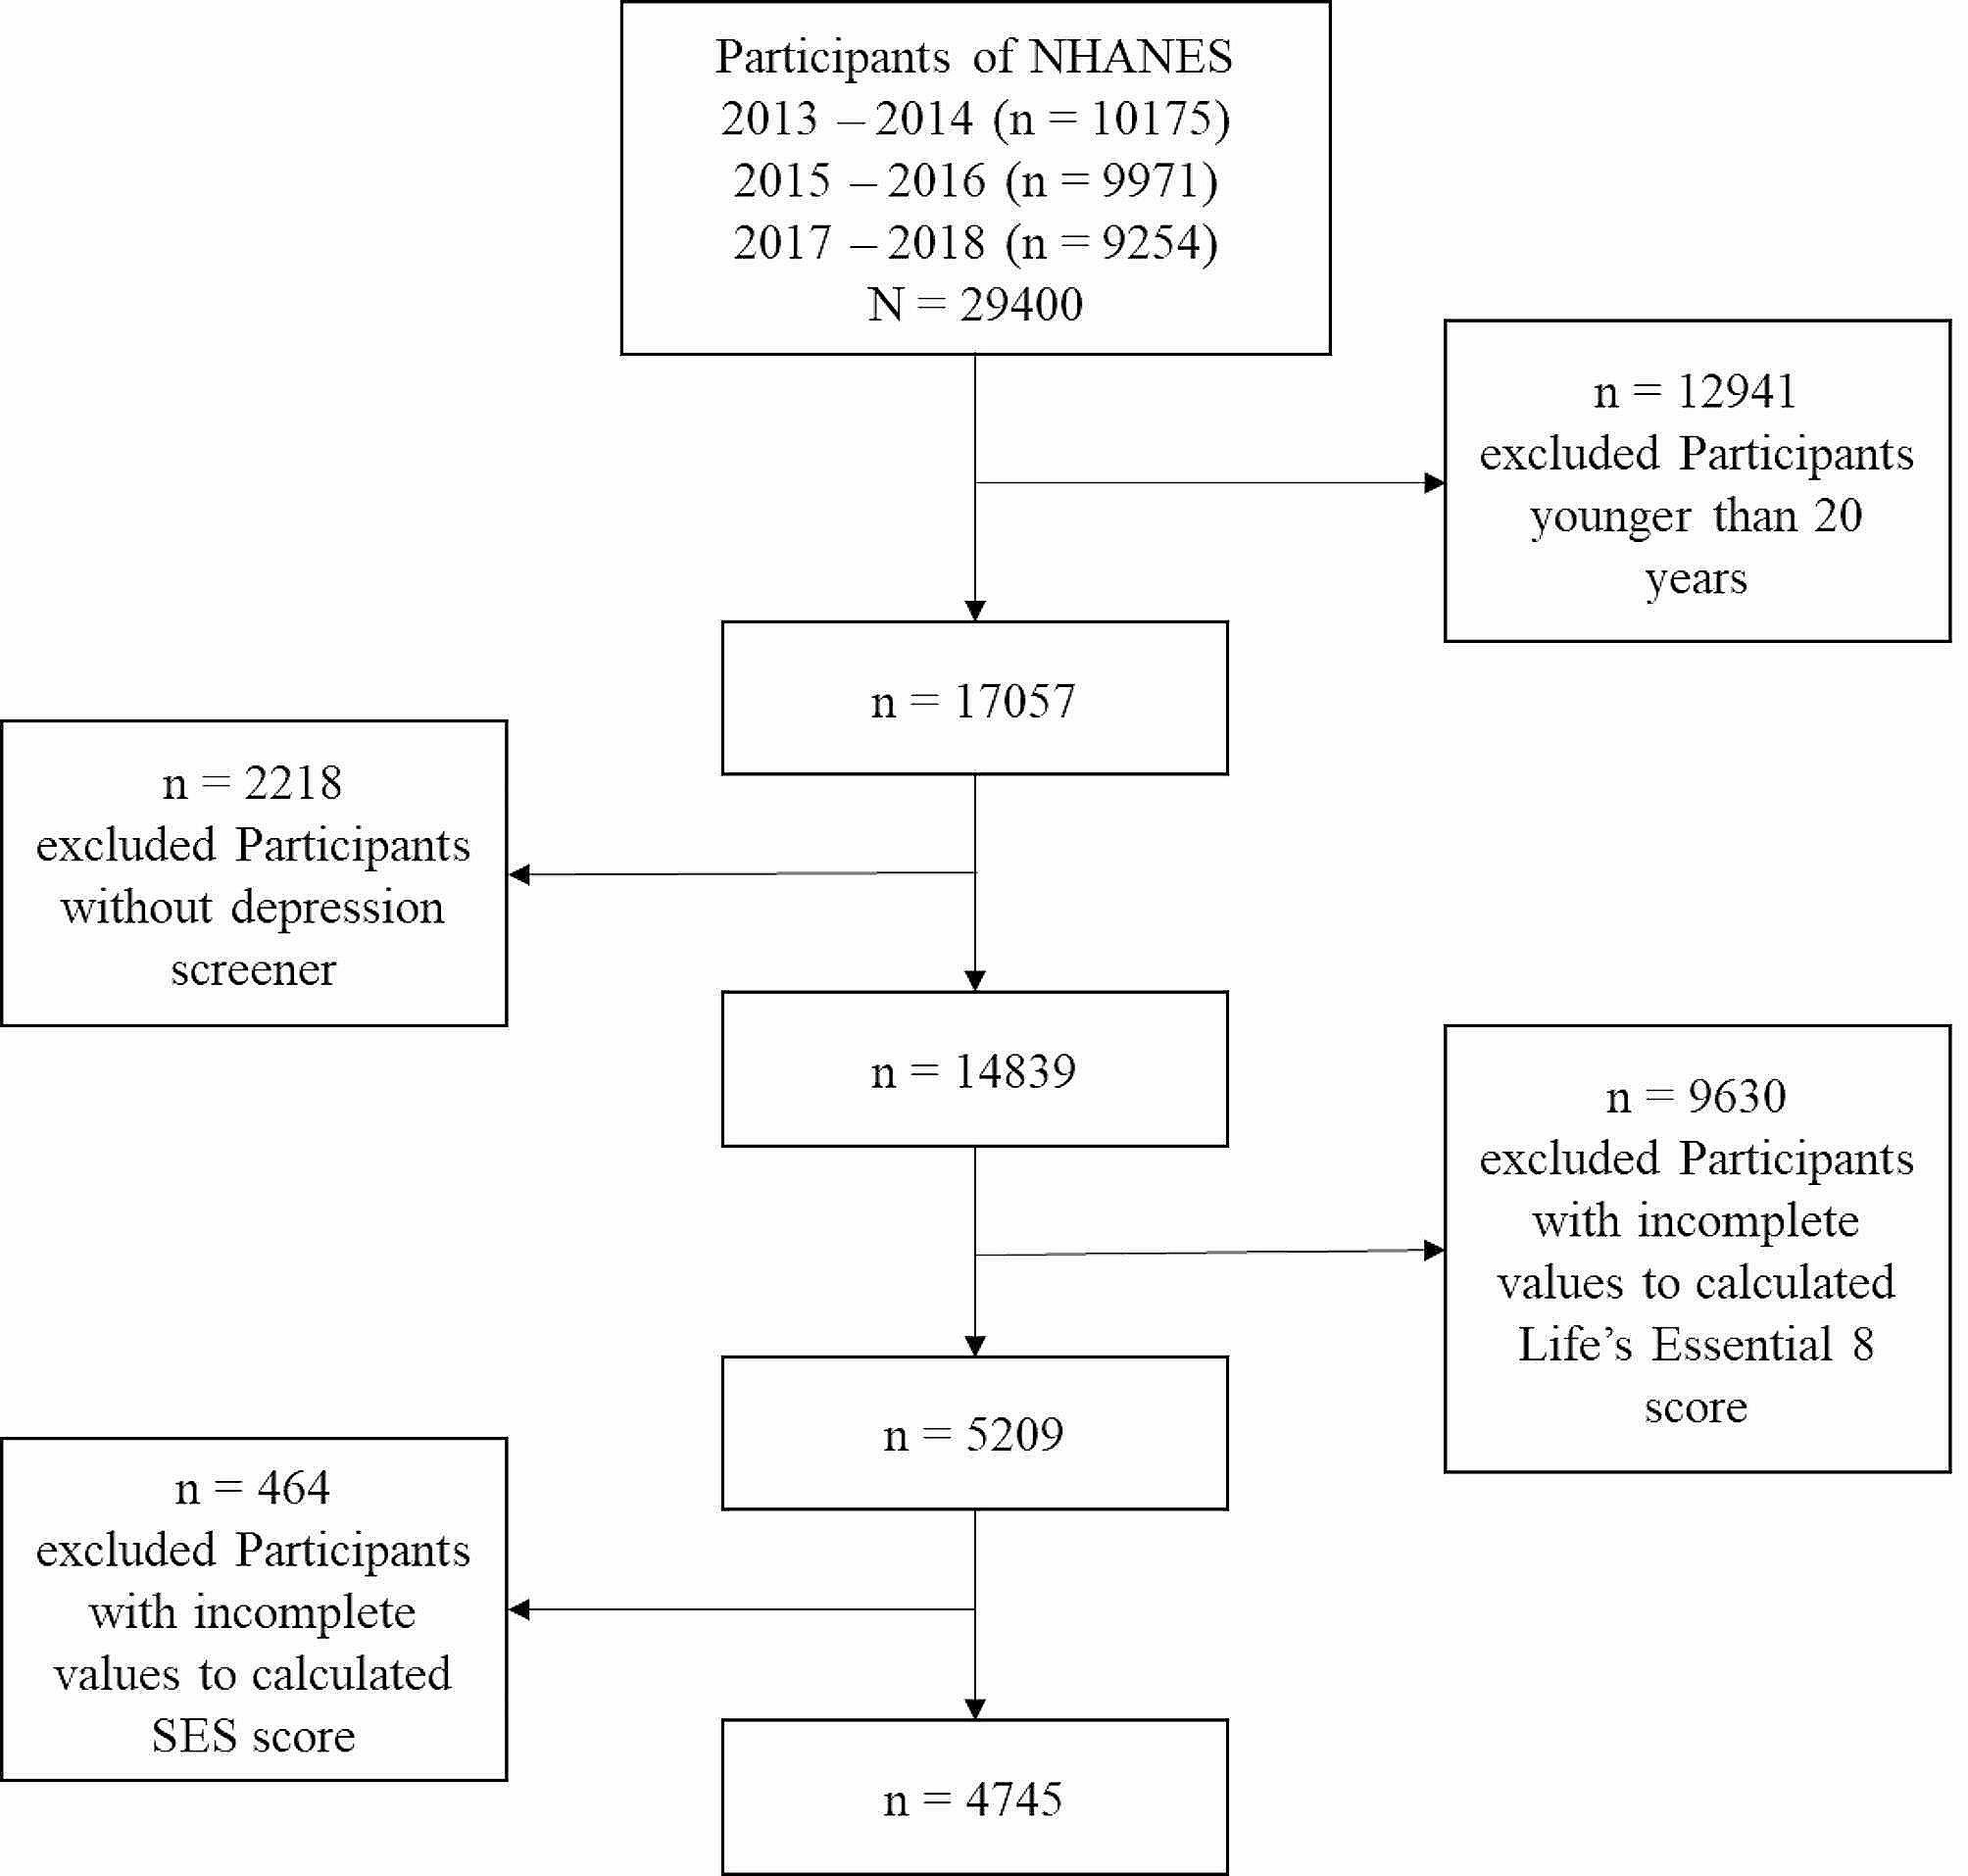
Data collection during follow-upClients assigned to the PMHC group were asked to complete questionnaires before each session during the treatment, after treatment, and at 6-, 12-, 24- and 36-month follow-up. To maximize use of available data, proxies for 1.5-month follow-up (n = 381) and 3-month follow-up (n = 223) were constructed for the PMHC group based on the questionnaires that were completed prior to each session. For the 1.5-month follow-up, the last observed measurement prior to 10 weeks after baseline was used and resulted in a variable with a median time since baseline value of 6.3 weeks. For the 3-month follow-up, the last observed measurement between 10 and 14 weeks after baseline was used. For clients who terminated treatment prior to 10 weeks, the posttreatment score was carried forward to 3-month follow-up under the assumption of short-term stability, similar to the procedure that was used in earlier work [30]. The median time since baseline was 11.7 weeks. As shown in Fig. 1, primary outcome data at 24- and 36-months follow-up were available for 47% and 39% of participants. At least one follow-up measurement was available for 91% of the participants (n = 416) implying that there were just 43 participants with baseline data only. Clients assigned to the TAU group were asked to complete questionnaires at 3-, 6- and 12-month follow-up only [33].
Fig. 1
Flow diagram for participants in the RCT of Prompt Mental Health Care
Primary outcomesSymptoms of depression were measured using the Patient Health Questionnaire (PHQ-9) [34, 35]. This measure includes nine items based on each of the DSM-IV criteria for depression. Participants indicate how often during the last two weeks they have experienced each symptom. Response options range from 0 (“not at all”) to 3 (“nearly every day”, giving a sum score ranging from 0 to 27. Caseness was defined as PHQ ≥ 10. The PHQ has been shown to have good psychometric properties [34]. In PMHC data, Cronbach’s alpha is 0.80.
Symptoms of anxiety were measured using the Generalized Anxiety Disorder Assessment (GAD-7) [35, 36]. GAD-7 measures frequency of seven common symptoms of anxiety. Response options range from 0 (“not at all”) to 3 (“nearly every day”), giving a sum score ranging from 0 to 21. Caseness was defined as GAD ≥ 8. In addition to measuring generalized anxiety disorder [36], GAD-7 also seems to have good sensitivity and specificity for panic, social anxiety, and post-traumatic stress disorder [37]. In PMHC data, Cronbach’s alpha is 0.83.
Recovery was defined as scoring above the caseness threshold on the PHQ-9 (≥ 10) and/or GAD-7 (≥ 8) measures at the start of treatment and below the caseness threshold on both these measures at follow-up. The reliable recovery rate was calculated to account for measurement error, aligning with the procedures employed for the IAPT evaluations [19]. Using the standard deviation (SD) of the sample and Cronbach’s alpha for PHQ-9 and GAD-7, a change score of ≥ 6 was derived for PHQ-9 and ≥ 5 for GAD-7. A client was defined as reliably recovered when scoring below threshold on both measures at follow-up and showing reliable improvement on either PHQ-9 or GAD-7.
Secondary outcomesFunctional status was measured using the Work and Social Adjustment Scale (WSAS) [38]. WSAS contains 5 items and assesses impairment due to mental health problems in five domains during the last month (0 = not impaired to 8 = severely impaired). The scale has been found to perform comparably to the PHQ-9 and GAD-7 [39]. WSAS was not measured under treatment.
Health-related quality of life (HRQL) was measured using the Norwegian version of the EQ-5D-5L [40, 41]. The paper version was used but it was largely completed electronically (we did not use a dedicated digital version of the EQ-5D-5L). In absence of a Norwegian value set, the English value set was used to calculate index scores [42]. Although the latter is suboptimal, it is in line with recommendations from the literature [43]. Index scores ranged from -0.285 (worst health state) to 1 (best health state). We also reported the index scores for item 5 on anxiety and depression as a separate outcome based on feedback from one of the reviewers. The scores on item 5 ranged from 0 (no anxiety/depression) to 0.289 (extreme anxiety/depression). Among primary care clients, HRCL as measured by the EQ-5D-5L has been found strongly associated with depression, and improves when depression is treated [44].
Positive mental wellbeing was measured using the Short Warwick Edinburgh Mental Well-Being Scale, sWEMWBS [45]. The sWEMWBS contains 7 items, all measured on a scale ranging from 1 (“none of the time”) to 5 (“all the time”). The higher scores indicate more positive mental well-being. The sWEMWBS psychometric properties are satisfactory) [46, 47], also in the PMHC setting in Norway [48].
Work participation was assessed by means of two questions, one multiresponse item about current work status and one multiresponse item about sources of income. Based on these two questions, it was determined whether participants were in full- or part-time regular work without receiving benefits or not (coded as a binary variable).
Other outcomesTo examine relapse rates at 24- and 36-months follow-up, we included clients that started treatment with case-level depression and/or anxiety symptoms who were reliably recovered at 6-month follow-up and completed PHQ-9 and GAD-7 at 24- and 36-month follow-up (n = 116/106), that is 6-month to 24-month, and 6-month to 36-month relapse rates. To be counted as a relapse event, symptom scores at 24- and 36-month follow-up for at least one of the outcome measures were (1) above level for caseness and were (2) ≥ 6 (PHQ-9) or ≥ 5 (GAD-7) points greater than the symptom scores at 6-months follow-up. A similar definition was used in previous study examining relapse rates in IAPT [25].
Statistical analysesBasic descriptive data at baseline was reported. For all models, site (Kristiansand municipality versus Sandnes municipality) was included as a fixed effect. Multiple imputation was used to estimate (reliable) recovery rates at follow-up. In the first step, 200 datasets containing fourteen variables (PHQ-9 at 7 time points, GAD-7 at 7 time points and site) were generated using Bayesian analysis (MCMC algorithm). In the second step, (reliable) recovery was conditioned on site using robust maximum likelihood, and model estimates were used to derive (reliable) recovery rates in the PMHC group at follow-up. Model constraints were used to determine whether (reliable) recovery rates were significantly different at 24- and 36-month follow-up compared to 6-month follow-up.
Latent growth models were used to model the course of outcome measures over time. Non-linearity was initially modelled by means of quadratic and cubic slopes. Piecewise models and other time transformations were also considered (exponential, log, hyperbolic) when model fit was poor. Model fit was assessed by using the Comparative Fit Index (CFI) and the Root Mean Square Error of Approximation (RMSEA). CFI ≥ 0.95, and RMSEA ≤ 0.06 were considered indicative of good model fit [49]. For continuous outcomes, within-group effect sizes (d) were calculated by dividing the estimated change from baseline to follow-up by the estimated standard deviation at baseline. Model constraints were adopted to determine whether symptom levels were different at 24- and 36-month follow-up compared to 6-month follow-up. Robust maximum likelihood was used as estimator, providing unbiased estimates under the assumption of data missing at random (MAR) [50].
Sensitivity analyses were performed for the continuous outcome measures of depression and anxiety to examine the impact of missing data at follow-up under various missing not at random (MNAR) conditions, employing both pattern mixture and selection models [50]. These models rely on fundamentally different assumptions, i.e., pattern mixture models (PMMs) assume that outcome scores are conditional on missingness, whereas selection models assume that missingness is conditional on the observed outcomes scores. That is, the pattern mixture model stratifies the sample by missing data pattern and estimates the model separately within each pattern, while the selection model implements a regression equation in which missingness is regressed on the observed scores. The overall confidence in the results presented in this study would increase if MNAR models based on different underlying assumptions produce similar results as the original MAR model. For the pattern mixture models, we created five groups by number of available data points (0: 1–2 datapoints, 21.8%; 1: 3–4 datapoints, 25.3%; 2: 5 datapoints, 13.5%; 3: 6 datapoints, 19.8%, 4: 7 datapoints, 19.6%). A multiple group model was used to estimate the latent growth model in each group, and these results were used to calculate a weighted estimate of the growth parameters. Neighbouring case missing variable restriction was used for identification purposes. For the selection models, a binary missing data indicator was created based on the following rules: value one is assigned to the time point after the last time point an individual is observed, value missing is assigned to all time points after the value of one, and value zero is assigned to all time points before the value of one. The binary missing data indicator variable at time ‘t’ was regressed on the observed outcome scores at times ‘t’ and ‘t-1’. The regression estimates for ‘t’ and ‘t-1’ were held equal across time for identification purposes. The main analyses were conducted using Mplus version 8.7.
留言 (0)