
記住我
Asthma is a chronic inflammatory airway disease characterized by respiratory symptoms due to airway obstruction that is often reversible.1 The current Global Initiative for Asthma (GINA) report suggests that positive bronchodilator reversibility (BDR) noted in the bronchodilator test (BDT) facilitates the diagnosis of asthma.2 The American Thoracic Society (ATS)/European Respiratory Society (ERS) guideline and GINA report defines a positive BDR as an increase in forced expiratory volume in 1 s (FEV1) for more than 12% and 200 mL from the baseline in response to a short-acting beta-2 agonist (SABA) in asthmatic adults.2,3 However, BDT is an effort-dependent spirometry test that requires the cooperation of patients with forced expiration, which cannot be performed adequately in certain populations, such as children, elderlies, and patients with respiratory muscle weakness. Hence, a potential alternative test to evaluate BDR is required.
Impulse oscillometry (IOS), a type of forced oscillation technique that enables lung mechanics measurement during quiet tidal breathing, is effort-independent.4–8 IOS provides several parameters, such as resistance, reactance, and area under reactance curve between 5 Hz and resonant frequency (Ax) that may detect airway obstruction, by applying different pressure/sound waves with various frequencies transmitted from the mouth to the lungs during tidal breathing.9,10 IOS has been used to estimate bronchodilator responses in asthmatic patients who were under drug treatments to evaluate the treatment control in these patients.11–18 However, whether IOS can be an alternative test to evaluate BDR in treatment-naïve adult patients with newly diagnosed asthma remains largely unclear.
This retrospective study aimed to investigate the potentiality of IOS to evaluate BDR in untreated adult patients with newly diagnosed asthma. First, the associations of IOS and other parameters with the positive BDR were evaluated by using multivariate logistic regression analysis. Second, the performance of IOS parameters in predicting the positive BDR was assessed by using receiver operating characteristic (ROC) curve analysis, and the cutoff values of IOS parameters that may discriminate the BDR outcome were determined.
2. METHODS 2.1. Ethics statementThis retrospective observational study was conducted at Taipei Veterans General Hospital, Taiwan, a tertiary medical center, and was approved by the Institutional Ethical Review Board of Taipei Veterans General Hospital (IRB-TPEVGH No.: 2020-06-021BC). The requirement for informed consent was waived by the IRB according to institutional guidelines for retrospective observational studies.
2.2. Study design and patientsAll untreated adult patients (aged 20–80 years) with newly diagnosed asthma who were never smokers and who underwent IOS and spirometry before and after SABA inhalation at their initial visit between March 22, 2017, and December 31, 2019, were identified. The medical records were reviewed by two independent pulmonologists with the assistance of a third specialist if any disagreement existed. All patients were diagnosed with asthma by the pulmonologists based on the suggestions of the GINA report2 and followed up in the outpatient clinic. Patients with the following criteria were excluded: those who failed to perform or achieve acceptable quality spirometry according to the ATS/ERS guideline,19 those who had an acute exacerbation of respiratory diseases, pneumonia requiring antibiotics or hospitalization in recent 4 weeks, chronic respiratory infection, and structural lung diseases, including active or old tuberculosis, bronchiectasis, interstitial lung diseases, restrictive lung diseases, arteriovenous malformation, as well as those who received the surgical intervention of pulmonary lesions or asymptomatic patients. The enrolled patients were divided into the positive and negative BDR groups according to the definition of the GINA report, which was an increase in FEV1 for more than 12% and 200 mL from the baseline after salbutamol (a SABA) inhalation.2
2.3. IOS and spirometry for BDR evaluationIOS was conducted using the Jaeger instrument (Jaeger MS-IOS Germany) following a standardized protocol based on the manufacturer’s instructions and recommendations from ERS.4,5 Nasal clips and manual compression of the cheeks were used to reduce the confounding factors of cheek vibration and escape of air via the nostrils. The tested subject breathed quietly through the mouthpiece for 30–45 s without glottis contraction or interposition of the tongue when the loudspeaker was activated. The loudspeaker emitted approximately 120–150 pulses with a frequency between 5 and 35 Hz during this test period and overlapped the normal breathing. Spirometry was performed immediately after the IOS examination under standardized protocols and interpreted in accordance with the recommendations from the ATS/ERS.3,19,20 Two flow-sensing spirometers each connected to a computer (Jaeger MS-IOS, Germany and Vmax 22 SensorMedics, Yorba Linda, CA, USA) were used for data analysis.
All patients were asked to avoid any inhaled bronchodilator 12 h before the assessment of BDR. Patients underwent IOS followed by spirometry before and 15 min after inhalation of salbutamol (400 μg; a SABA) from a metered-dose inhaler with a valve-bearing spacer device to assess BDR. IOS was conducted in the pulmonary function lab before the spirometry because the forced expiration might affect parameters measured by IOS.5 IOS and spirometry equipment were calibrated twice daily, and the quality of the tests was confirmed by two independent pulmonologists. Since a positive BDR noted in the BDT is an important criterion to diagnose asthma,2 a normal baseline lung function without fixed airflow obstruction, defined by FEV1/FVC ratio less than 70%, did not prevent patients from receiving salbutamol inhalation to complete BDT.
2.4. Data collectionBaseline demographic variables, including gender, age, body mass index, inhaled medication during follow-up, serum total immunoglobulin (IgE) level, blood eosinophil counts, and blood eosinophil percentage (%), were collected. IOS parameters, including the difference between resistance at 5 and 20 Hz (R5-R20), reactance at 5 Hz (X5), resonant frequency (Fres), and Ax, were recorded. Spirometric data, including forced vital capacity (FVC), FEV1, peak expiratory flow (PEF), and forced expiratory flow between 25% and 75% (FEF25%–75%) were measured from the forced expiratory flow-volume curve. Changes in spirometric parameters measured before and after salbutamol inhalation were also calculated to evaluate BDR.
2.5. Statistical analysisThe Kolmogorov–Smirnov test was used to check the distribution of the continuous variables. These variables were compared using the Student’s t-test and the Mann–Whitney U test in the cases of normal or non-normal data distribution and are presented as mean with 95% confidence interval (CI) or median with interquartile ranges (IQR), respectively. Categorical variables were compared using Pearson’s Chi-square test and are shown as number (%). Statistically significant variables in the univariate analysis were included in the multivariate analysis using logistic regression, and the odds ratios (ORs) or adjusted ORs (aORs) with 95% CIs were calculated. The Hosmer–Lemeshow test was also applied to exam goodness-of-fit for the logistic regression model. The predictive performance of IOS parameters for the BDR outcome was determined by ROC curve analysis, and their optimal cutoff value for discriminating the BDR outcome was obtained. Statistical significance was set at a 2-tailed p-value of less than 0.05. All analyses were performed using MedCalc Statistical Software version 20.009 (MedCalc Software bv, Ostend, Belgium).
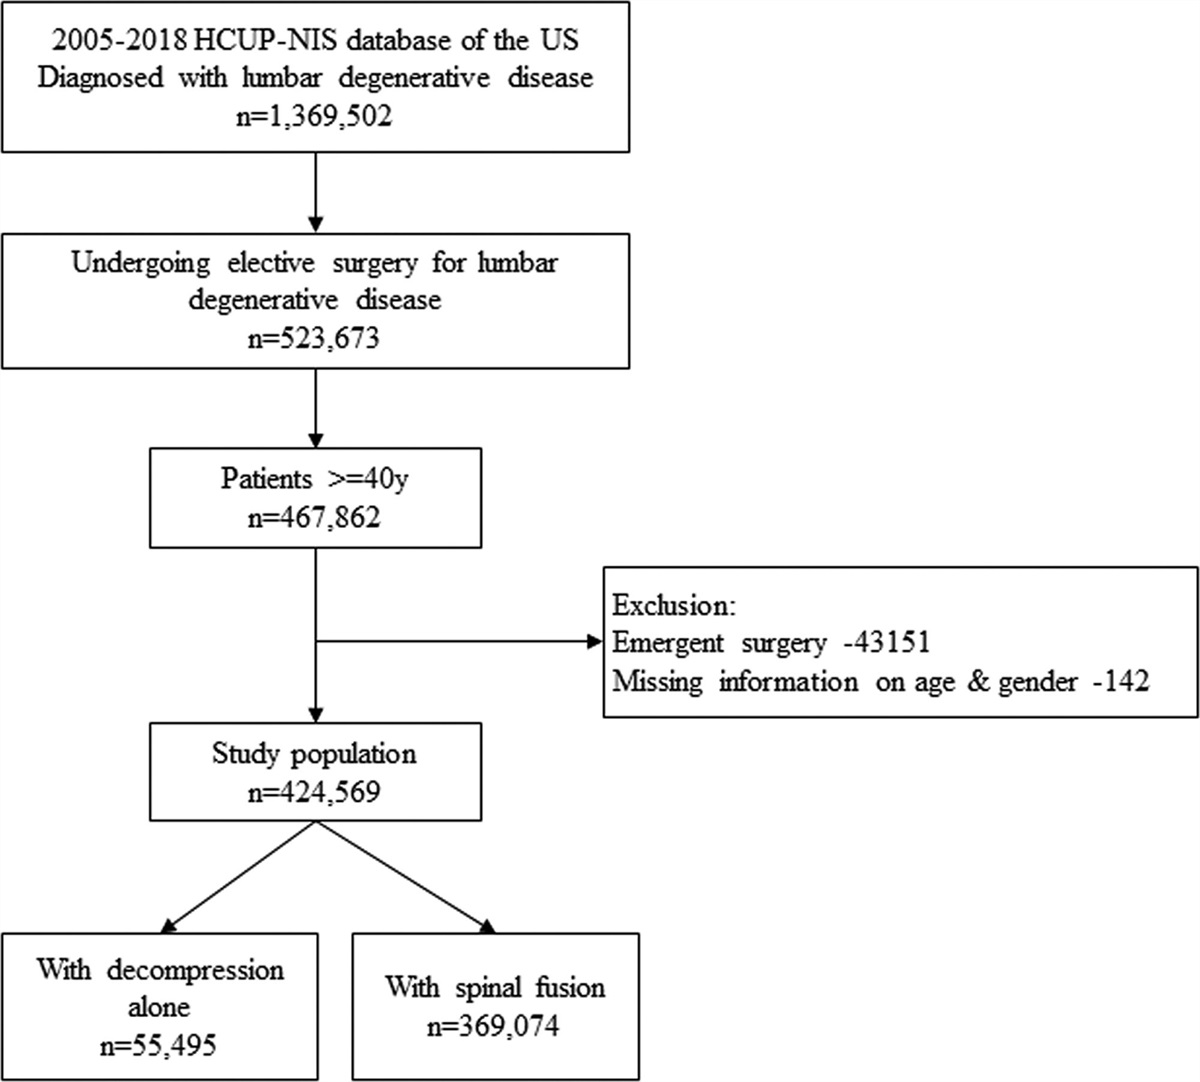
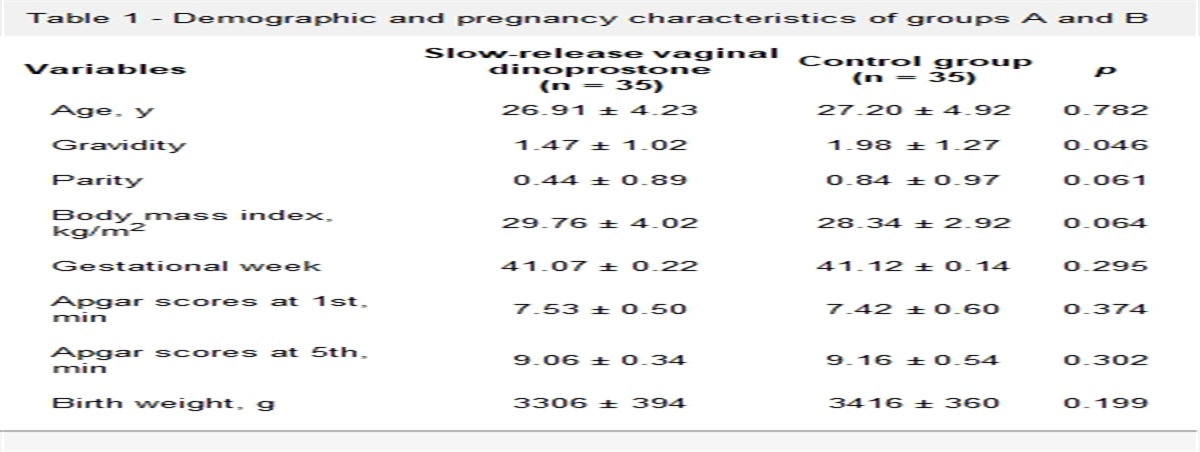
3. RESULTS 3.1. Characteristics of the study patientsA total of 323 treatment-naïve patients with newly diagnosed asthma who were never smokers and who completed spirometry and IOS before and after salbutamol inhalation at their initial visit were enrolled in the current study (Fig. 1). The asthma diagnosis was made according to typical respiratory symptoms followed by confirmation of variable expiratory airflow limitation, including 93 (28.8%) patients who had positive BDR, 135 (41.7%) patients who had excessive variation in FEV1 between visits, 38 (11.8%) patients who had positive bronchodilator responsiveness in FVC,3,21,22 12 (3.7%) patients who had positive airway hyperresponsiveness to methacholine, 11 (3.4%) patients who had peak expiratory flow variability, 21 (6.5%) patients who had documented reversibility after a cycle of maintenance anti-asthma treatment, and 13 (4.0%) patients who had established asthma diagnosis in the childhood without treatment in their adulthood. Table 1 shows the demographic and certain baseline clinical characteristics of these patients. The table reveals that patients were mostly female (67.5%) and had a median age of 64 years, a median body mass index of 24.2 kg/m2, a medium age of asthma onset of 53 years and 64.7% of them were late-onset asthma,2,23 53.9% patients with atopy,24 16.7% patients with gastroesophageal reflux disease, 37.8% patients with hypertension, 15.8% patients with coronary artery disease, 14.6% patients with diabetes mellitus, a median blood eosinophil count of 162.4 per μL, a median eosinophil percentage of 2.4%, and a median total IgE level of 87.2 IU/mL. These patients were divided into the positive BDR (n = 93) and negative BDR (n = 230) groups according to the definition of the GINA report.2
Table 1 - Baseline characteristics of the study patients TotalAtopy, defined as an increase in total IgE (>100 U/ml) or a positive Phadiatop test result (>0.35 PAU/L).
ICS use, medication prescribed after spirometry and impulse oscillometry and confirmed asthma diagnosis, including inhaled corticosteroid with or without long-acting beta-2 agonist; Late onset asthma, age of onset ≥40 years old; Data are shown as median (IQR). p values <0.05 were considered statistically significant.
BDR = bronchodilator reversibility; BMI = body mass index; IgE = immunoglobulin E; CAD = coronary artery disease; GERD = gastroesophageal reflux disease.
 Fig. 1:
 Flow chart of the study population. IOS, impulse oscillometry; SABA, short-acting beta-2 agonist, salbutamol; CT, computed tomography, BDR, bronchodilator reversibility, defined as forced expiratory volume in 1 s (FEV1) change more than 200 mL and >12% at 15 min after salbutamol.
Subgroup analysis revealed that values of the blood eosinophil count, eosinophil percentage, and total IgE level were significantly higher in patients with the positive BDR compared with patients with the negative BDR, whereas other characteristics had no between-group differences (Table 1). After the establishment of the asthma diagnosis, most (86.7%, n = 280) of these patients received inhaled corticosteroid-containing medication, while others received either inhaled short-acting bronchodilators, oral theophylline, or oral leukotriene-receptor antagonists.
3.2. Spirometric and IOS data of the study patientsTable 2 shows spirometric data before and after salbutamol inhalation of the study patients. The table indicates that the baseline FEV1/FVC ratio, FEV1 (% of predicted), and FEF25%–75% (% of predicted) of patients were 77.9%, 79.4%, and 53.3%, respectively. Patients with BDR had significantly lower FEV1/FVC, FEV1 (% of predicted), PEF (% of predicted), and FEF25%–75% (% of predicted) before salbutamol inhalation compared with patients with the negative BDR. Patients with the positive BDR still had significantly low FEV1/FVC and PEF (% of predicted) after salbutamol inhalation. Further analysis revealed that the changes in all spirometric parameters before and after salbutamol inhalation were significantly larger in patients with the positive BDR compared with those with the negative BDR.
Table 2 - Spirometric data of the study patients TotalData are shown as median (IQR) except FVC (% predicted) and FEV1 (% predicted), both of which are shown as mean (95% CI). p values <0.05 were considered statistically significant.
BDR = bronchodilator reversibility; Pre-BD = before salbutamol inhalation; Post-BD = after salbutamol inhalation; FEV1 = forced expiratory volume in one second; FVC = forced vital capacity; PEF = peak expiratory flow; FEF25–75% = forced expiratory flow at expiration of 25%–75% of forced vital capacity; change (Δ) = difference between pre-BD and post-BD in absolute volume (mL) or in percentage (% = [post-BD value minus pre-BD value] divided by pre-BD value times 100%).
Table 3 shows IOS data before and after salbutamol inhalation of the study patients. The table indicates that the baseline R5-R20, X5, Fres, and Ax of the patients were 0.13, 17.36, −0.15, and 0.95, respectively. These IOS parameters did not significantly differ between the positive and negative BDR groups either before or after salbutamol inhalation. However, the percentage changes in X5 and Ax before and after salbutamol inhalation were significantly larger in patients with the positive BDR compared with those with the negative BDR.
Table 3 - Impulse oscillometric data of the study patients TotalData are shown as median (interquartile range, IQR). p values <0.05 were considered statistically significant.
Ax = area of reactance; BDR = bronchodilator reversibility; change (Δ) = difference in percentage (% = [post-BD value minus pre-BD value) divided by pre-BD value times 100%]; Fres = resonant frequency; Post-BD = after salbutamol inhalation; Pre-BD = before salbutamol inhalation; R5 = resistance in 5 Hz; R20 = resistance in 20 Hz; X5 = reactance in 5 Hz.
Table 4 shows the variables associated with the positive BDR of the study patients. Spirometry parameters were excluded in this analysis to avoid the problem of multicollinearity because the positive BDR is defined by these parameters. Univariate analysis revealed that blood eosinophil counts (OR = 1.0016, p = 0.0025), eosinophil percentage (OR = 1.1364, p = 0.0012), and percentage change of Ax [ΔAx (%)] after SABA inhalation (OR = 0.9899, p = 0.0146) were potential factors associated with the positive BDR. Multivariate logistic regression revealed that only ΔAx (%) remained as an independent factor associated with the positive BDR (aOR = 0.9905, p = 0.0329). The correlations between ΔAx(%) and ΔFEV1 in mL and in % were shown in the supplementary material (Fig. S1). (Supplementary Fig. 1 https://links.lww.com/JCMA/A152)
Table 4 - Variables associated with the positive bronchodilator reversibility of the study patients Univariate Multivariate β OR 95% CI p β aOR 95% CI p Eosinophil (/μL) 0.0015729 1.0016 1.0006–1.0026 0.0025 0.00035369 1.0004 0.9978–1.0029 0.7416 Eosinophil (%) 0.12787 1.1364 1.0518–1.2278 0.0012 0.084894 1.0886 0.8934–1.3265 0.4675 Total IgE (IU/mL) 0.00039589 1.0004 0.9998–1.0010 0.1847 ΔX5 (%) −0.00067824 0.9993 0.9982–1.0004 0.2302 ΔAx (%) −0.010198 0.9899 0.9818–0.9980 0.0146 −0.0095249 0.9905 0.9819–0.9992 0.0329Ax = area under reactance curve between 5 Hz and resonant frequency; CI = confidence interval; IgE = immunoglobulin E; OR = odds ratio; aOR = odds ratio after adjustment for other cofactors; X5 = reactance in 5 Hz.
ΔAx (%) was found to be an independent factor; thus, its performance in predicting the positive BDR was assessed by ROC curve analysis, which yielded an area under the curve of 0.614 (p = 0.0013) (Fig. 2). The optimal cutoff value of ΔAx (%) was found −53.8% with a sensitivity of 39.78% and a specificity of 80.43%. The performance of different cutoff values of ΔAx (%) were shown in the supplementary material (Table S1). (Supplementary Table 1 https://links.lww.com/JCMA/A151)
 Fig. 2:
 Receiver operating characteristic curve analysis of ΔAx (%) as a predictor for the positive BDR in patients with newly diagnosed asthma. ΔAx (%), percentage change of the area under the reactance curve after salbutamol inhalation; AUC, area under the curve.
4. DISCUSSIONIdentifying BDR helps in the diagnosis of asthma2; however, not all patients can adequately perform the forced expiration during the spirometry test. This retrospective study reveals that untreated patients with newly diagnosed asthma who had a positive spirometry-assessed BDR exhibited several clinical features that were significantly distinct from those who had a negative BDR. Among these different features, ΔAx (%), an IOS parameter, is an independent factor for the positive BDR. Subsequent ROC curve analysis revealed that ΔAx (%) had a good prediction performance for identifying patients with the positive BDR. The optimal cutoff value of ΔAx (%) was −53.8%, suggesting that patients in this population with a decrease of AX of more than 53.8% after SABA inhalation are likely to have a positive BDR. Thus, ΔAx (%) may serve as an alternative indicator that can determine the positive BDR in this population.
The spirometric data measured in our untreated patients fully support the diagnosis of asthma. IOS may provide objective information that is beneficial to patients whose spirometry is either normal or could not be performed; thus, the comparisons of spirometric and IOS data in the same patients with several types of lung diseases have received growing interest.25–27 R5-R20, X5, Fres, and Ax in the patients were measured in the current study; these conventional IOS parameters have been suggested to detect airway obstruction.9,10 For example, R5-R20 is a measure of the peripheral airway resistance that is determined mainly by airway caliber. The reactance (X) can be viewed as the energy storage and dissipation of airways in response to different pressure with various frequencies transmitted from the mouth, which is composed of both capacitance (the elasticity) and inertance (the mass-inertive forces of the moving air column).8 The X5 represents the elasticity and inertia of the tissues of large and small airways at 5 Hz.8,28 The Fres is the frequency that the magnitudes of the capacitive and inertive pressure loss are the same, and tends to be elevated in both restrictive and obstructive states.8 Ax is the total reactance (X) at all frequencies between 5 Hz and Fres, which includes the total area dominated by the capacitance and reflects the elastic properties of the lung.29 Therefore, Ax in a way provides more comprehensive information compared with the other three parameters, which may explain ΔAx (%) to be the only parameter that is significantly associated with BDR. Our results are supported by a recent systemic review,30 which showed the percentage change among IOS parameters, including R5-R20, X5, Fres, and Ax, after bronchodilator administration in asthmatic patients was greatest in Ax. In recent work,31 we analyzed spirometric and IOS data in patients with respiratory symptoms and preserved pulmonary function. These patients were classified as the nonobstructive group (FEV1/FVC ≥ 0.7) and the obstructive group (FEV1/FVC<0.7). Notably, the asthmatic patients in this study demonstrated increases in baseline R5-R20, Fres, and Ax and a decrease in baseline X5 compared with the nonobstructive group; however, these patients had IOS parameters similar to those of the obstructive group in that study.31 Thus, the baseline IOS parameters of the asthmatic patients in this study indicate that they had small airway dysfunction, which can be identified using IOS in addition to spirometry.
Research on the use of IOS to identify the positive BDR in treatment-naïve adult patients with newly diagnosed asthma is scarce. By contrast, studies that compared the capability of IOS and spirometry to measure the bronchodilator responses to SABA in treated asthmatics are abundant.12,14,16–18 These studies focused on the feasibility of using IOS to provide measures that can reflect the treatment control. For example, Higaki et al.11 found that treated asthma patients with a long disease duration (≥10 years) showed significantly higher postbronchodilator R5-R20 than the treated asthma patients with a short disease duration (<10 years). Kuo et al.12 showed that IOS is more sensitive than spirometry in detecting bronchodilator response in poorly controlled asthma, especially in those patients with a preserved FEV1. Saadeh et al.15 reported that IOS showed improvements in airway function following the SABA challenge and after initiation of long-term inhaled corticosteroid treatment despite the absence of improvement in spirometry. Short et al.16 demonstrated that
留言 (0)