
記住我


The flow chart of the literature searches and selection process of studies is presented in Figure 1. According to the aforementioned key words, 1,277 studies were found. After removing duplicates and scanning based on title/abstract, 85 articles were selected for full-text evaluation. Of them, eight studies8, 20-26 consisting 4844 KTRs were eligible for quantitative analysis in the present meta-analysis.

Preferred Reporting Items for Systematic Reviews and Meta-analyses diagram indicating method for selection of papers included in the present study
3.2 Studies characteristics and quality assessmentThe characteristics of the included studies are summarized in Table 1. Six retrospective cohort studies were conducted in the United States,8, 20-24 one retrospective cohort study was conducted in the Netherlands26 and one randomized clinical trial was performed in Czech.24 All studies were performed to compare PPIs versus H2RAs after kidney transplantation. Data of 4844 KTRs (2101 in H2RAs group and 2,743 in PPIs group) were pooled. The mean age of the subjects was 51.53 ± 4.75 years with a range of 44.5–63 years old. As shown in Table 1, the most commonly used immunosuppression regimens included three-drug immunosuppression consisting of a calcineurin inhibitor (mainly tacrolimus), an antimetabolite (mainly mycophenolate) and a steroid. Most studies used the rabbit antithymocyte globulin (rATG) as induction immunosuppressive therapy. Follow-up durations were between 3 and 108 months (mean 23.57 ± 37.41 months). One study did not clarify the follow-up duration.24 Based on utilized scales, all of the studies were of high quality.
TABLE 1. Characteristics of included studies Author / Year Country/ Design Sample size Age (mean ± SD) Male/Female Maintenance immunosuppression regimens NOS score H2RAs PPIs H2RAs PPIs H2RA PPI H2RA PPI January et al 2020 USA/ retrospective cohort 705 582 54.5 ± 14.4 53.1 ± 13.3 443/262 351/231 MTP MTP 9 Rouse et al 2016 USA/ retrospective cohort 167 35 63 ± 14 55+10.70 124/43 25/10 MTP MTP 8 Knorr et al 2014 USA/ retrospective cohort 384 213 55 ± 13 55 ± 12 244/140 122/91 MTP MTP 9 Lyu et al 2020 USA/ retrospective cohort 296 1478 45.7 ± 14.8 51.7 ± 12/4 183/113 826/652 NR NR 7 Alhosaini et al 2015 USA/ retrospective cohort 40 43 49.7 ± 16.4 54 ± 15.1 24/16 25/18 MTP MTP 7 Ska´la et al 1997 Czech/ randomized controlled study 93 84 44.5 ± 12.75 46.2 ± 11.75 50/43 45/59 Cyclosporine, prednisone and azathioprine Cyclosporine, prednisone and azathioprine 3* Patel et al 2017 USA/ retrospective cohort 339 183 53 ± 4.25 54 ± 4.75 219/120 102/81 MTP MTP 9 Van boekel et al 2014 Netherlands/ retrospective cohort 77 125 46.7 ± 13.3 47.7 ± 12.8 51/26 77/48 MTP MTP 8 Abbreviations: H2RAs, H2-receptor antagonists; MTP, mycophenolate, tacrolimus and prednisolone; NOS, Newcastle-Ottawa Scale; NR, not reported; PPIs, proton-pump inhibitors. *: the Jadad score. 3.3 Meta-analysisPooled data for BPAR rate were available from six studies with 4585 KTRs (2616 with PPIs exposure and 1968 with H2RAs exposure). As shown in Figure 2 and Table 2, no significant association was found between post-transplant PPIs vs. H2RAs exposure and BPAR rate (pooled OR = 1.05, 95% CI 0.83–1.34, p = 0.67). In sub-group analysis of studies with follow-up duration of at least 1 year (Figure S1 and Table 2), the BPAR rate was also not significantly different between the two groups (pooled OR = 1.23, 95% CI 0.92–1.64, p = 0.165).

Forest plot of the BPAR rate in KTRs receiving PPIs vs. H2RAs
TABLE 2. Main results of pooled ORs in meta-analysis of PPIs vs H2RAs in KTRs Outcomes No. of studies No. of patients OR/ WMD (95% CI) p value P-heterogeneity/ I2 (%) BPAR Overall analysis 6 4585 1.05 (0.83, 1.34) 0.67 0.299 / 27.7 Sub-group analysis of studies with follow-up duration ≥1 year 4 2608 1.23 (0.92, 1.64) 0.165 0.370 / 4.6 AMR 6 2,608 1.87 (1.03, 3.04) 0.039 0.785 / 0.0 Mortality 4 1,498 1.31 (0.56, 3.07) 0.533 0.317 / 15 Graft loss 4 2,608 1.06 (0.59, 1.93) 0.842 0.796/ 0.0 12-month eGFR 4 2,489 −1.01 (−1.89, −0.12) 0.02 0.810/ 0.0 CDI 2 1,489 1.37 (0.49, 3.85) 0.545 0.613/ 0.0 Pneumonia 2 1,489 1.83 (0.95, 3.52) 0.072 0.909/ 0.0 Hypomagnesemia 2 1,370 2.16 (1.46, 3.20) ˂0.001 0.460/ 0.0 Osteoporosis or fracture 2 1,489 1.62 (0.95, 2.76) 0.075 0.718/ 0.0 Abbreviations: AMR, antibody-mediated rejection; BPAR, biopsy-proven acute rejection; CDI, Clostridioides difficile infection; CI, confidence interval; eGFR, estimated glomerular filtration rate; H2RAs, histamine-2 receptor antagonists; OR, odds ratio; PPIs, proton-pump inhibitors; WMD, weighted mean difference.The rate of AMR was reported in four studies with 2,608 KTRs (1013 in PPIs group and 1,595 in H2RAs group). The follow-up durations of all of these studies were at least 1 year. The pooled rate of AMR was significantly higher in PPIs group compared with the H2RAs group (pooled OR = 1.87, 95% CI 1.03–3.04, p = 0.039) (Figure 3, Table 2).

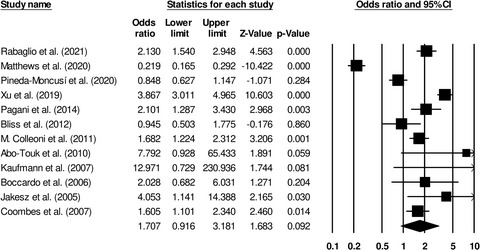
Forest plot of the AMR rate in KTRs receiving PPIs vs. H2RAs
Mortality was reported in four studies with 1,498 KTRs (605 taking PPIs and 893 taking H2RAs). The mortality rate did not significantly differ between PPIs and H2RAs groups (pooled OR = 1.31, 95% CI 0.56–3.07, p = 0.533) as shown in Figure 4 and Table 2.

Forest plot of the mortality rate in KTRs receiving PPIs vs. H2RAs
The graft loss rate was reported as an outcome in four studies with 2,608 KTRs (1,103 in PPIs group and 1,505 in H2RAs group). As shown in Figure 5 and Table 2, no significant difference in the graft loss rate was observed between the two groups (pooled OR = 1.06, 95% CI 0.59–1.93, p = 0.842).

Forest plot of the graft loss rate in KTRs receiving PPIs vs. H2RAs
As shown in Figure 6 and Table 2, the overall results of four studies with 2,489 KTRs (1,021 in PPIs group and 1,468 in H2RAs group) revealed a significantly lower mean eGFR at 12 months after transplantation in PPIs group compared with H2RAs group (WMD = −1.01, 95% CI −1.89 to −0.12 ml/min/1.73m2, p = 0.02).

Forest plot of the 1-year eGFR in KTRs receiving PPIs vs. H2RAs
The risk of Clostridioides difficile infection did not differ significantly between the two groups (pooled OR = 1.37, 95% CI 0.49–3.85, p = 0.545) based on two studies (1,489 KTRs; 617 in PPIs group and 872 in H2RAs group) (Figure S2 and Table 2). The rate of pneumonia was reported in two studies with 1,489 KTRs (617 in PPIs group and 872 in H2RAs group). The higher but not statistically significant rate of pneumonia was observed among patients who received PPIs (pooled OR = 1.83, 95% CI 0.95–3.52, p = 0.072) (Figure S3 and Table 2).
Moreover, the risk of hypomagnesemia or need for magnesium supplementation was significantly higher in the PPIs group in pooled data of two studies with 1,370 KTRs (625 in PPIs group and 745 in H2RAs group) (pooled OR = 2.16, 95% CI 1.46–3.20, p ˂ 0.001) (Figure S4 and Table 2). Combined results of two studies consisting of 1,489 KTRs (617 in PPIs group and 872 in H2RAs group) indicated the similar rates of osteoporosis or fracture between the two groups (pooled OR = 1.62, 95% CI 0.95–2.76, p = 0.075) (Figure S5 and Table 2).
3.4 Trial sequential analysisThe cumulative z-curve did not cross the conventional limit for significance in BPAR rate, mortality and graft loss. However, it crossed the conventional limit for AMR, which confirmed the findings of meta-analysis. Furthermore, the cumulative z-curve did not traverse the trial sequential monitoring limit for all arms indicating that the evidence was not strong enough and further studies are required. (Figure 7 and Figure S6–S8).

Trial sequence analysis of all of the included studies considering the BPAR rate in KTRs exposed to PPIs vs. H2RAs. Cumulative Z-curve (dashed blue lines), conventional boundary (green horizontal lines), trial sequential monitoring boundaries (inward sloping red lines) and required information sizes (red vertical lines)
3.5 Heterogeneity, publication bias and sensitivity analysisCollectively, no significant heterogeneity was observed across all analysis (Table 2). Egger's regression test revealed no significant publication bias (p > 0.05 for all outcomes). In confirmation of that, visual inspection of funnel plot illustrated no evidence of publication bias among outcomes (Figure S9–S13). In the sensitivity analysis of included studies, no individual study significantly affected the pooled effect size, showing the reliability of the results (Figure S13–S18).
留言 (0)