
記住我


As a common extrapulmonary tuberculosis, tuberculous meningitis (TBM) is a non-suppurative inflammatory reaction of meninges, choroid plexus and ependyma caused by mycobacterium tuberculosis infection.1, 2 TBM, known as the worst possible form of tuberculosis (TB), accounts for 1–2% of all tuberculosis cases in settings with low HIV prevalence.3, 4 In high TB burden countries, 44%–69% TBM patients died without prompt and effective treatment.5
Rifampicin is the mainstay of treatment for TBM, and 69%–100% rifampicin-resistant TBM is life-threatening.6-9 So far, there are no agents identified that can replace rifampicin in the treatment of TBM.10 However, the cerebrospinal fluid (CSF) permeability of rifampicin is poor.11, 12 Under the current treatment dose, the concentration of rifampicin in CSF hardly exceeds the minimum inhibitory concentration (MIC) of mycobacterium tuberculosis.13-15 The study of the pharmacodynamics of rifampin showed that the efficacy of rifampin is exposure or concentration-dependent, meaning that it is associated with exposure to the drug (area under the concentration-time curve, AUC0-24h) and/or its peak concentration (Cmax).16 Thus, high-dose rifampicin has been evaluated as a strategy to reduce TBM mortality.17 Alvarez-Uria et al have found that no safety issues were reported with 900 mg (20 mg/kg) of oral rifampicin in adults with TBM in India.18 In a series of open-label randomized phase II clinical trials in Indonesia, 2 weeks after a 33% increase in the intravenous dose of rifampicin (600 mg or 13 mg/kg IV), plasma and CSF exposure was three times higher than oral exposure of 450 mg at the first critical juncture of treatment. In the small study, the 6-month mortality rate dropped by more than 50%.13
Studies have reported that high-dose rifampicin has a more significant therapeutic effect on TBM compared with standard dose, such as reducing the incidence of complications, improving the survival rate of patients with TBM, and reducing the risk of death.6, 19, 20 Up to now, no researcher has reported a meta-analysis of high-dose rifampicin in the treatment of TBM. Thus, we performed a meta-analysis with a treatment group of high-dose rifampicin and a control of standard dose to quantitatively evaluate the efficacy and prognosis of high-dose rifampicin in the treatment of TBM.
2 METHODS 2.1 Search strategyA systematic literature search was performed using the following databases: PubMed, Web of Science, Embase, Scopus and the Cochrane library databases. All searches were from inception until the end of 31 May 2021. Search terms used included “rifampin,” “rifampicin,” “benemycin,” “rifadin,” “tuberculous meningitis,” “TB Meningitis,” “TBM,” and “High-dose.” References from related studies and review articles were searched.
2.2 Inclusion and exclusion criteriaStudies were included in this meta-analysis if they met predetermined criteria as follows: (a) the studies being randomized controlled trial (RCT) design, in which RCTs reporting on high-dose rifampicin in the treatment of TBM were included; (b) patients with TBM were randomly assigned to receive antituberculous therapies of high-dose rifampicin, standard anti-tubercular treatment or other doses of rifampicin; and (c) studies that provided mean and standard deviation of pharmacokinetic parameters which may be obtained by logarithmic transformation.
The exclusion criteria were as follows: (a) case reports, conference abstracts or review articles; (b) case-control, cross-sectional, retrospective or prospective cohort studies; (c) studies that provided no outcomes of interest.
2.3 Data extraction and quality assessmentThe quality of the included studies was assessed by two reviewers using the modified Jadad scale,21 the evaluation criteria of the modified Jadad scale included four items: randomization, randomization concealment, double blind, and withdrawals and dropouts. The first three items above scored 0–2, and the last item scored 0–1. A total score of 0–3 is considered a low-quality study and a score of 4–7 is a high-quality study. When inconsistency exists, a third reviewer will make the final decision after verification and discussion.
Screening of studies, selection, exclusion and data extraction was performed by two reviewers independently. Any disagreements were discussed and reached a consensus. We extracted the following information from each article: first author, publication year, study location, type of design, sample size for each study, number, age, number of male and HIV+in higher-dose group and standard-dose group, outcomes of interest (plasma pharmacokinetics, survival and adverse events (AEs)).
2.4 Statistical analysisStatistical analyses were performed with STATA version 12.0 (StataCorp). Data of dichotomous outcomes were pooled using the risk ratio (RR) and presented as the 95% confidence interval (CI). Continuous outcomes were pooled using the weighted mean difference (WMD) and 95%CI. Hazard ratio (HR) and their 95%CI were extracted from Kaplan-Meier curves using Engauge Digitizer version 10.8 (http://markummitchell.github.io/ engauge-digitizer/) and methodology by Tierney et al.22 Heterogeneity was assessed statistically by using the Cochran's Q test and the I2 statistic. When p > 0.05 or I2 ≤ 50%, the results of the associated studies were considered to have acceptable heterogeneity, and a fixed-effects model was utilized. When p ≤ 0.05 or I2 > 50%, it was considered that there was heterogeneity in the results of the included studies, and a random-effects model was selected.
3 RESULTS 3.1 Procedure of literature selectionThe initial search identified 1016 relevant studies. After 471 duplicate studies were excluded, 545 articles remained. Then, 528 articles were excluded after screening the titles and abstracts according to the eligibility criteria, eventually, 17 potential articles were remained for full-text review, among which 10 studies were excluded as the following reasons: 3 articles could not provide research data; 2 articles were not RCTs; 3 articles had given another intervention in addition to high-dose rifampicin; 2 articles were meeting abstracts, review articles or study protocols. Finally, 7 eligible studies were included in the present meta-analysis13, 19, 20, 22-25 (Figure 1).

Flow diagram of the process of selection of articles
3.2 Characteristics and quality assessment of the included studiesStudies were performed in Africa, South America and Southeast Asia, respectively. All 12 studies were RCTs. A total of 1596 samples were included in our present study, among which 790 were in the higher-dose group and 806 were in the standard-dose group. The extracted outcomes included Cmax, 6-month mortality, 9-month mortality, Grade I-II AE, Grade III-V AE, AUC0-24h, hepatotoxicity, hepatotoxicity Grade I-II and cardiologic events. High-dose rifampicin consisted of 11–35 mg/kg orally and 11–20 mg/kg intravenously. The standard dose of rifampicin was 10 mg/kg, oral (Table 1).
TABLE 1. Characteristics of studies included in the meta-analysis Study ID Study location Patients, n Study Higher-dose group Standard-dose group Antituberculosis treatment (mg/kg) Number Age, median (IQR or range) Male, n (%) HIV+, n (%) Rifampicin (mg/kg) Number Age, median (IQR or range) Male, n (%) HIV+, n (%) Cresswell 2021a23 Uganda 41 RCT phase II Rifampicin, 21–35 (8 weeks, oral) 20 32.5 (26.5–38.5) 12 (60) 18 (90) 10 (oral) 21 34 (27–36) 9 (42.9) 20 (95.2) Cresswell 2021b23 Uganda 40 RCT phase II Rifampicin, 16–20 (2 weeks, IV) 20 33.5 (25.5–38.5) 13 (65) 18 (90) 10 (oral) 21 34 (27–36) 9 (42.9) 20 (95.2) Dian 2018a24 Indonesia 40 RCT phase II Rifampicin, 21–35 (oral) 20 29 (21.3–38.3) 8 (40) 1 (5.0) 10 (oral) 20 28 (22.3–45.8) 12 (60) 1 (5.0) Dian 2018b24 Indonesia 40 RCT phase II Rifampicin, 21–35 (oral) 20 33 (24.3–37.3) 12 (60) 4 (20) 10 (oral) 20 28 (22.3–45.8) 12 (60) 1 (5.0) Ruslami 2013a13 Indonesia 60 RCT phase II Rifampicin, 11–15 (2 weeks, IV) 29 NR 15 (52) 3 (10) 10 (oral) 31 NR 18 (58) 4 (13) Ruslami 2013b13 Indonesia 21 RCT phase II Rifampicin, 11–15 (2 weeks, IV) + Moxifloxacin 20–40 (2 weeks, oral) 9 27 (18–60) 3 (33) 1 (11) 10 (oral) 12 34 (19–47) 8 (67) 2 (17) Velásquez 2018a25 Peru 120 RCT phase II Rifampicin, 11–20 (8 weeks, oral) 60 25 (20–35) 41 (68) 2 (3.3) 10 (oral) 60 24 (21–37) 39 (65) 2 (3.3) Velásquez 2018b25 Peru 120 RCT phase II Rifampicin, 11–20 (8 weeks, oral) 60 27 (22–37) 34 (57) 1 (1.7) 10 (oral) 60 24 (21–37) 39 (65) 2 (3.3) Wasserman 2021a26 South Africa 32 RCT phase II Rifampicin, 21–35 (4 weeks, oral) 15 41 (36–45) 10 (66.7) 15 (100) 10 (oral) 17 38 (34–47) 9 (53) 17 (100) Wasserman 2021b26 South Africa 31 RCT phase II Rifampicin, 16–20 (4 weeks, IV) 14 37 (30–43) 7 (50) 14 (100) 10 (oral) 17 38 (34–47) 9 (53) 17 (100) Ding 202019 Vietnam 233 RCT Rifampicin, 11–15 (8 weeks, oral) + Levofloxacin 20–40 (8 weeks, oral) 115 33 (18–70) 80(69.6) 50 (43.5) 10 (oral) 118 34.5 (18–86) 80 (67.8) 50 (42.4) Heemskerk 201620 Vietnam 817 RCT Rifampicin, 11–15 (8 weeks, oral) + Levofloxacin 20–40 (8 weeks, oral) 408 35 (29–45) 282 (69.1) 175 (42.9) 10 (oral) 409 35 (30–47) 278 (68.0) 174 (42.5)Six studies were considered as high quality because the study design had been described in detail, while the other one was assessed as low quality, which contributed to less rigorous compliance with standard RCT as they did not report the randomization concealment, blind method, or withdrawals and dropouts (Table 2).
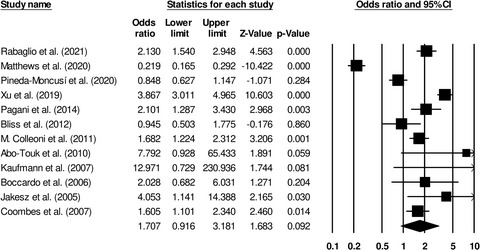
TABLE 2. Quality analysis of each study by modified Jadad scale Study Randomization Randomization concealment Double blind Withdrawals and dropouts Score Study quality Cresswell 202123 2 1 0 1 4 High Dian 201824 1 0 2 1 4 High Ruslami 201313 2 2 1 1 6 High Velásquez 201825 2 0 1 1 4 High Wasserman 202126 2 0 0 1 3 Low Ding 202019 2 2 2 1 7 High Heemskerk 201620 2 2 2 1 7 High 3.3 Meta-analysis about the effects of high-dose rifampicin on different outcomesThe results of the meta-analysis of 10 outcomes evaluated are shown in Table 3. Since Cmax and AUC0-24h were reported as geometric means and 95%CI in the original literature, the meta-analysis was performed after the logarithm of geometric means and the conversion of 95%CI to standard deviation. The results showed that high-dose rifampicin (11–20 mg/kg, IV or 11–35 mg/kg, oral) had no influence on 6-month mortality (RR 0.67, 95%CI 0.44–1.02, p 0.062), Grade I-II AE (RR 0.93, 95%CI 0.76–1.14, p 0.503), Grade III-V AE (RR 0.93, 95%CI 0.72–1.21, p 0.608) and hepatotoxicity Grade I-II (RR 1.01, 95%CI 0.62–1.65, p 0.971) for TBM patients compared with standard dose. Whereas, log(Cmax) (WMD 0.69, 95%CI 0.59–0.79, p 0.001) and log(AUC0-24h) (WMD 0.79, 95%CI 0.71–0.88, p 0.001) were higher than that of the standard-dose group. No differences in 9-month mortality (RR 1.04, 95%CI 0.85–1.28, p 0.680), hepatotoxicity (RR 1.05, 95%CI 0.32–3.44, p 0.941) and cardiologic adverse events (RR 1.72, 95%CI 0.42–7.09, p 0.450) between the group of high-dose rifampicin combined with moxifloxacin or levofloxacin and the control were observed (Figures 2 and 3).
TABLE 3. Meta-analysis in the achievement of the outcomes in the higher-dose group and the standard group Outcomes Number of study Number of patients Meta-analysis Heterogeneity WMD/RR/HR 95%CI P value I2,% P value High-dose rifampicin vs Standard-dose rifampicin Log(Cmax) 5 167 0.69 0.59–0.79 <0.001 97.1 <0.001 6-month mortality 3 120 0.67 0.44–1.02 0.062 48.8 0.142 Grade I-II AE 3 120 0.93 0.76–1.14 0.503 14.3 0.311 Grade III-V AE 6 301 0.93 0.72–1.21 0.608 55.3 0.048 Log(AUC0-24h) 4 107 0.79 0.71–0.88 <0.001 89.3 <0.001 Hepatotoxicity Grade I-II 3 120 1.01 0.62–1.65 0.971 0.0 0.561 High-dose rifampicin plus moxifloxacin or levofloxacin vs Standard-dose rifampicin 9-month mortality 2 1050 1.04 0.85–1.28 0.680 16.1 0.275 Hepatotoxicity 2 838 1.05 0.32–3.44 0.941 79.0 0.029 Cardiologic events 2 838 1.72 0.42–7.09 0.450 71.1 0.063 Abbreviations: AE, adverse event.
Forest plot of high-dose rifampicin vs standard-dose rifampicin. A-G represent Log(Cmax), 6-month mortality, Grade I-II AE, Grade III-V AE, Log(AUC0-24h), Hepatotoxicity Grade I-II, respectively

Forest plot of high-dose rifampicin plus moxifloxacin or levofloxacin vs Standard-dose rifampicin. A-C represent 9-month mortality, hepatotoxicity, cardiologic events, respectively
3.4 Subgroup analysisThe subgroup analysis was undertaken based on the dose and administration of rifampicin. For the outcome of log(Cmax), compared with the standard-dose group, the elevated level of log(Cmax) in oral high-dose rifampin group (WMD 0.69, 95%CI 0.66–0.73, p 0.001) was consistent with that in intravenous high-dose rifampicin group (WMD 0.69, 95%CI 0.53–0.85, p 0.001). In the 16–20 mg/kg (IV) or 21–35 mg/kg (oral) subgroup, the log(Cmax) in the high-dose rifampicin group was significantly higher than that in the standard-dose group (WMD 0.73, 95%CI 0.69–0.77, p 0.001). Since only one study was included in the 11–15 mg/kg (IV) or 11–20 mg/kg (oral) subgroup, the log(Cmax) between the two groups could not be compared. No significant difference was found in the subgroups of grade III-V AE outcome. While compared with the standard dose, the increased level of log(AUC0-24h) in oral 11–35 mg/kg rifampicin group (WMD 0.87, 95%CI 0.83–0.91, p 0.001) was higher than that in intravenous 11–20 mg/kg rifampicin group (WMD 0.73, 95%CI 0.65–0.81, p 0.001) (Table 4 and Figure 4).
TABLE 4. Subgroup analysis according to the dose and administration of rifampicin Outcomes Number of study Number of patients Meta-analysis Heterogeneity WMD/RR 95%CI P value I2,% P value Log(Cmax) 11–15(IV) or 11–20(oral) 1 60 0.54 0.52–0.57 <0.001 16–20(IV) or 21–35(oral) 4 107 0.73 0.69–0.77 <0.001 73.1 0.011 IV 3 132 0.69 0.53–0.85 <0.001 98.5 <0.001 Oral 2 73 0.69 0.66–0.73 <0.001 0.0 0.655 Grade III-V AE 11–15(IV) or 11–20(oral) 2 46 1.05 0.78–1.40 0.760 3.8 0.308 16–20(IV) or 21–35(oral) 4 121 0.90 0.62–1.29 0.555 60.1 0.057 IV 1 41 0.71
留言 (0)