
記住我


Anorexia nervosa (AN) is characterized by severe dietary restriction or maladaptive weight loss behavior, leading to a significantly low body weight (American Psychiatric Association, 2013). In contrast, food craving, intense desire for food and frequent binge-eating episodes followed by compensatory behavior, characterize bulimia nervosa (BN) (American Psychiatric Association, 2013). Despite extensive research efforts, more knowledge about key mechanisms that are involved in the maintenance of AN and BN is needed: which mechanisms enable individuals with AN to maintain their significantly low body weight and which mechanisms drive individuals with BN to binge episodes (Glashouwer et al., 2020; Jansen, 2016)?
Dual process models may help to elucidate these questions. They differentiate between controlled, symbolic or reflective, and automatic, associative or impulsive information processing (Strack & Deutsch, 2004) and suggest that behavior is the outcome of an interplay between the reflective and impulsive system. Recently, dual process models have been applied to eating behavior, and researchers argue that cognitive biases in the impulsive system such as approach-avoidance tendencies contribute to the maintenance of disordered eating (Loijen, Vrijsen, Egger, Becker, & Rinck, 2020; Paslakis, Scholz-Hehn, Sommer, & Kühn, 2020).
Approach-avoidance tendencies refer to action tendencies toward salient stimuli, such as food and body stimuli in EDs (Williamson, White, York-Crowe, & Stewart, 2004). In individuals with AN, an approach tendency toward food may be weakened or even absent, which contributes to severe restriction of food intake (Neimeijer, de Jong, & Roefs, 2015). In individuals with BN, strong approach biases toward food may undermine self-control and contribute to excessive food intake (Brockmeyer, Hahn, Reetz, Schmidt, & Friederich, 2015). Apart from food stimuli, body stimuli are key stimulus characteristics that may activate cognitive biases (Williamson et al., 2004). Woud, Anschutz, Van Strien, and Becker (2011) suggested that an approach bias toward a thin beauty ideal may contribute to dieting behavior. Thus, approach-avoidance biases toward food and body stimuli could be important mechanisms in the maintenance of disordered eating.
Cognitive behavioral therapy (CBT) for EDs focuses on explicit mechanisms such as strict dieting and other weight-control behaviors or overvaluation of weight and shape (Fairburn, Cooper, & Shafran, 2003), whereas implicit processes are neglected. In contrast, cognitive bias modification (CBM) targets implicit biases such as approach-avoidance tendencies, and computerized training interventions have successfully been implemented as an add-on to standard CBT in the treatment of several mental disorders (Loijen et al., 2020). Therefore, the identification of automatic approach-avoidance tendencies in individuals with EDs is necessary for elucidating key maintenance factors and developing treatments that target these factors. Examining approach-avoidance tendencies across and between diagnostic categories can refine models that aim to explain the maintenance of disordered eating behavior in individuals with AN and BN and may inform the development of transdiagnostic or specific interventions such as approach-avoidance trainings.
Research in student samples indicates that approach-avoidance trainings can change food-related approach-avoidance biases (Kakoschke, Kemps, & Tiggemann, 2017). In clinical samples, evidence is very sparse. Brockmeyer et al. (2019) examined the effects of an active approach bias modification (ABM) training compared to sham ABM in a BN and binge-eating disorder sample. The results were mixed: they found that participants in both conditions experienced significant reductions in binge eating, ED symptoms, trait food craving, and food cue reactivity. Active ABM tended to result in greater reductions in ED symptoms than sham ABM. However, food intake, approach bias, and attention bias toward food did not change.
So far, only a few studies have examined approach-avoidance tendencies toward food and body stimuli in clinical samples of women with AN or BN. Veenstra and de Jong (2011) and Neimeijer, Roefs, Glashouwer, Jonker, and de Jong (2019) assessed approach-avoidance tendencies in adolescents. They found evidence for less automatic motivational orientation toward food and reduced approach tendencies for high-calorie food in adolescent AN spectrum patients, compared to healthy controls (HCs). Paslakis et al. (2016) assessed approach-avoidance tendencies in adults. They found that HCs were generally faster in pulling high-calorie and low-calorie food stimuli, whereas patients with AN were generally slower in pulling food pictures. Paslakis and colleagues interpreted this finding as absence of an approach bias toward food in individuals with AN, whereas HCs showed an approach bias toward food. With regard to body stimuli, there is sparse evidence in clinical samples. In two studies, Brockmeyer et al. (2020) assessed approach-avoidance biases toward thin and normal weight bodies in AN patients compared to HCs. In the first study, they used thin and normal weight avatar bodies with a standard face and found no differences in automatic approach-avoidance tendencies. In the second study, they again used thin and normal weight avatar bodies but positioned the participant's own face and another women's face on the bodies. They found that patients with AN approached thin bodies significantly faster when depicted as themselves than when depicted as another woman.
In sum, there is some evidence that an approach bias toward food may be missing in individuals with AN. Concerning body stimuli, evidence for an approach-avoidance bias in individuals with AN is still inconclusive. So far, no study has examined approach-avoidance biases toward food or body stimuli in individuals with BN or compared the strength of these biases between individuals with an AN or BN. Therefore, it was the aim of the present study to assess approach-avoidance biases toward food and body stimuli using implicit Approach-Avoidance Tasks (AAT) in individuals with AN, BN, and HCs. In these tasks, participants see pictures on a computer screen and use a joystick either to push the pictures away from themselves or to pull them toward themselves. When participants pull the joystick toward themselves, the pictures increase in size; when participants push the joystick away from themselves, the pictures decrease in size. This zooming effect evokes the visual impression that the picture is pulled closer or pushed away and thus generates a sensation of approach and avoidance (Rinck & Becker, 2007). In addition to the implicit tasks, we also assessed explicit ratings of food and body pictures. It is hypothesized that explicitly measured variables are particularly valuable for the prediction of deliberate, controlled behavior, whereas implicitly measured variables may be more important for the prediction of less controlled, more impulsive behavior (Friese, Hofmann, & Waenke, 2008). Therefore, the assessment of implicit biases may provide important information even though differences in explicit variables are already known.
We expected that individuals with AN would show a lack of approach bias toward high-calorie food, whereas individuals with BN would show an approach bias toward high-calorie food (i.e., they would be faster when pulling than pushing high-calorie food). With regard to low-calorie stimuli, no differences in response times were expected. Our study was planned and designed before the study by Brockmeyer et al. (2020) was published. Therefore, we expected that individuals with AN and BN would show an approach bias toward thin bodies (i.e., they would be faster when pulling than pushing thin bodies). With regard to normal weight bodies, we expected a stronger avoidance bias in individuals with AN (i.e., they would be faster when pushing than pulling normal weight bodies) compared to individuals with BN and HCs.
2 METHODS 2.1 DesignThe present study was a cross-sectional study comparing individuals with AN, individuals with BN, and HCs. It included interview measures for diagnostic purposes, several questionnaires to describe the sample, two AATs to assess approach-avoidance tendencies toward high-calorie versus low-calorie food and thin versus normal weight bodies, and explicit ratings of the food and body stimuli.
2.2 Sample and recruitmentThe final sample included 104 individuals and consisted of 42 individuals with AN, 24 individuals with BN, and 38 HCs (16 students). Individuals with an ED were recruited from an inpatient clinic specialized in the treatment of EDs. Inclusion criteria for the AN and BN group were an AN or BN diagnosis according to DSM-5-criteria. Exclusion criteria for the AN and BN group were age < 18, pregnancy, substance abuse or misuse current or life time, bipolar disorder, psychotic disorder current or life time, schizophrenia, and suicidality. Exclusion criteria for the HC group were age < 18, pregnancy, BMI < 18.5, BMI > 25, and any current mental disorder. All participants provided written informed consent and received financial reimbursement for their participation. The local ethics committee approved the study.
2.3 ProcedureIndividuals with an ED were informed about the study in group therapy sessions and invited to participate in case of an AN or BN diagnosis at intake. Individuals for the HC group were recruited by using university e-mail lists and by distributing flyers in the university and public buildings. We used a telephone screening to assess inclusion and exclusion criteria for the HC group. A diagnostic session was scheduled with all participants. At the end of the diagnostic session, questionnaires were given to the participants, and another session within the next week was scheduled to carry out the experimental tasks. The experimental tasks (Food-AAT and Body-AAT) were administered in randomized order. Then, the participants rated the stimuli used in the tasks. Four items of the Grand Hunger Scales (Grand, 1968) were assessed before the experimental session started: time since last meal, hunger rating, amount of favorite food the participants could imagine eating, and time until next meal. Only participants whose last meal had taken place 2–4 hr (Paslakis et al., 2016) before the test procedure were included in the study, in order to ensure comparability in terms of satiety.
2.4 Materials 2.4.1 InterviewsShort diagnostic interview for mental disorders (Mini-DIPS) (Margraf, 1994): The Mini-DIPS is a structured diagnostic interview to assess current and lifetime DSM-IV diagnoses of the most frequent clinical disorders. We used an adapted version for DSM-5.
Structured Clinical Interview for Diagnostic and Statistical Manual of Mental Disorders, fourth edition, Axis I (SCID-I) (Wittchen, Wunderlich, Gruschwitz, & Zaudig, 1997): The SCID-module for DSM-IV disorders is a widely used structured interview to assess axis I mental disorders. The criteria were adapted to the criteria of the DSM-5.
2.4.2 QuestionnairesBeck Depression Inventory-II (BDI-II) (German version by Hautzinger, Keller, & Kühner, 2006): The BDI-II is a widely used self-report scale assessing depressive symptoms during the past 2 weeks. It includes 21 items, which are rated on scales from 0 to 3. All items are added up to form a total score. The total sum score ranges between 0 and 63, with higher scores indicating more severe depressive symptoms. Previous research has shown good internal consistency (Cronbach's α) in several clinical and nonclinical samples as well as high correlations with other measures of depression (Wintjen & Petermann, 2010). Internal consistency in the current sample was α = .96.
Eating Disorder Examination Questionnaire (EDE-Q) (German version by Hilbert & Tuschen-Caffier, 2016): The EDE-Q is a widely used 28-item self-report measure to assess eating disorder symptomatology during the past 28 days. It comprises four subscales: restrained eating, eating concern, weight concern, and shape concern. Items are rated on scales from 0 (no days) to 6 (every day). The total mean score ranges between 0 and 6, with higher scores indicating more severe eating disorder pathology. Previous research has shown good internal consistency (Cronbach's α) in clinical and nonclinical samples for the total scale and the subscales; the total score and the subscales have also been found to reliably discriminate between individuals with an ED (AB, BN, atypical EDs) and individuals without an ED (Hilbert & Tuschen-Caffier, 2016). In the current sample, internal consistency was α = .97 for the total score.
Sociocultural Attitudes Towards Appearance Questionnaire (SATAQ) (German version by Knauss, Paxton, & Alsaker, 2009): The SATAQ is a 16-item self-report questionnaire to assess sociocultural influences on body image. It includes three subscales: awareness of the existence of the thin body ideal, internalization of this ideal and the perceived pressure to conform to media ideals. Items are rated on 5-point Likert-scales ranging from 1 (strongly disagree) to 5 (strongly agree). Total sum scores range between 6 and 30 for the internalization subscale and between 5 and 25 for the pressure and awareness subscales, with higher scores indicating stronger sociocultural influences on body image. Previous research indicated that all three subscales have adequate or good internal consistency. For girls, there were high correlations between the internalization and pressure subscales with both body dissatisfaction measures and weight and eating concerns, while awareness only moderately correlated with body dissatisfaction and weight and eating concerns (Knauss et al., 2009). In the current sample, internal consistency was α = .95 for the total score and ranged between .84 and .93 for the subscales.
Body Shape Questionnaire (BSQ) (German version by Waadt, Laessle, & Pirke, 1992): The BSQ is a 34-item self-report instrument to assess the dissatisfaction with one's own body during the last 4 weeks. Each item is scored on a scale from 1 (never) to 6 (always). All items are added up to form a total score. Total sum scores range between 34 and 204, with higher scores indicating higher levels of body dissatisfaction. Previous research has shown excellent internal consistency (Cronbach's α) in clinical (AN, binge-eating disorder) and nonclinical samples; the total score has also been found to reliably discriminate between clinical and nonclinical groups (Pook, Tuschen-Caffier, & Stich, 2002). In the current sample, Cronbach's alpha was .98 for the total score.
Food Craving Questionnaire (FCQ-T-r) (German version by Meule, Hermann, & Kubler, 2014): The FCQ-T-r is the reduced version of the FCQ, which assesses trait food craving. It includes 15 items, which are rated on scales from 1 (never) to 6 (always). All items are added up to form a total score. Total sum scores range between 15 and 90, with higher scores indicating higher levels of food craving. Previous research has shown high internal consistency (Cronbach's α) in nonclinical samples. Furthermore, scores of the FCQ-T-r were positively correlated with BMI and negatively correlated with dieting success (Meule et al., 2014). In the current sample, internal consistency was α = .95 for the total score.
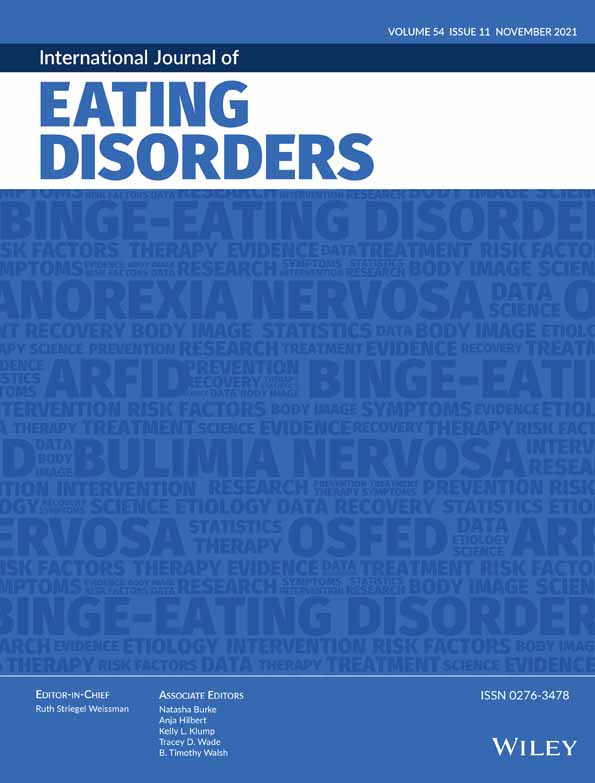
2.4.3 Stimuli for the Food and Body Approach-Avoidance Tasks Body stimuliTwelve pictures of a thin woman and 12 pictures of a normal weight woman were used in the Body-AAT. The pictures were computer-generated (e.g., see Figure 1). Different versions of the two body templates (thin and normal weight) were created by varying the pose of the body (e.g., body turned left ways, body turned right ways). We presented the pictures without heads to ensure that participants evaluated only the body. The selection of the two body templates (thin, normal weight) was based on the results of a pilot study (Leins, Waldorf, Kollei, Rinck, & Steins-Loeber, 2018). In this pilot study, 66 female participants rated 32 pictures displaying computer-generated female bodies with regard to their weight (ultra-thin, thin, normal weight, overweight, obese) and the desirability of their shape on a 7-point Likert-scale ranging from “strongly agree” to “strongly disagree.” The two body templates selected for the present study and a previous study (Leins et al., 2018) were (a) the one that was rated as the most desirable thin body picture (thin body) and (b) the one whose weight was rated as normal and as moderately desirable (normal weight body). Each picture was rendered with dark- and light-colored underwear, which was used in the Body-AAT as a reaction cue, with the color (light grey vs. dark grey) informing participants about the expected reaction (push vs. pull). To allow for the zooming effect, seven different sizes of each picture were constructed.

Example of pictures used in the Body Approach-Avoidance Task (thin body picture and normal weight body picture)
Food stimuliTwelve pictures of different kinds of high-calorie food (burger, ice cream, pastries, potato chips, muffins, pasta bake, chicken nuggets, pancakes, pizza, fries, chocolate, and torte) and 12 pictures of different kinds of low-calorie food (apple, strawberry, mixed fruits, vegetables, cucumber, crispbread, mandarin, fruit salad, mixed salad, asparagus, tomato salad, and fruits of the forest) were used in the Food-AAT. The selection of food stimuli was based on the 10 high- and 10 low-calorie stimuli used in an experimental Go/No-Go task by Meule, Hermann, & Kubler (2014). We added another four stimuli (two high-calorie stimuli: burger, chocolate, and two low-calorie stimuli: fruit salad and asparagus). In the high-calorie category, we replaced a picture used by Meule et al. (2014) displaying cheese with a picture displaying chicken wings as not all HCs may identify cheese as high calorie. We estimated the calorie content of all food stimuli using rating data provided for similar pictures in the Food Pics Database by Blechert, Meule, Busch, and Ohla (2014) to make sure that they were high and low calorie. We did not use the pictures from the Food Pics Database or another validated picture set, because analogous to the Body-AAT we included the reaction cue inside the pictures instead of using, for instance, the picture format as cue. Therefore, a professional photographer took pictures of the 12 high- and 12 low-calorie food stimuli that we had selected for the Food-AAT (e.g., see Figure 2). Each high- and low-calorie food was placed and photographed on a round plate and on a rectangular shaped plate, which was used in the AAT as reaction cue, informing participants about the expected reaction (push vs. pull). To allow for the zooming effect, seven different sizes of each picture were constructed.

Example of pictures used in the Food Approach-Avoidance Task (low-calorie and high-calorie food picture)
2.4.4 Food and Body Approach-Avoidance Task (Food-AAT, Body-AAT) Food-AATIn the Food-AAT, participants were shown color photographs of high- and low-calorie food items on a computer screen. They were asked to pull or push a joystick in response to the shape of the plate the food was placed on (round plate vs. rectangular plate) irrespective of the picture content (high- vs. low-calorie food). Pushing the pictures resulted in a reduction of the size of the picture, while pulling resulted in an increase. Half of the participants were instructed to pull round plates and push rectangular plates and the other half vice versa. The pictures of food were arranged in three blocks with each block comprising 48 trials. Each block included the following pictures: the 12 high-calorie foods on round plates, the 12 high-calorie foods on rectangular plates, the 12 low-calorie foods on round plates, and the 12 low-calorie foods on rectangular plates. In sum, each participant performed 144 trials.
Body-AATIn the Body-AAT, participants were shown color photographs of thin and normal weight women in underwear. They were asked to pull or push a joystick in response to the color of the underwear (light grey vs. dark grey) irrespective of the picture content (thin vs. normal weight). Pushing the pictures resulted in a reduction of the size of the picture while pulling resulted in an increase. Half of the participants were instructed to pull light grey underwear and push dark grey underwear and the other half vice versa. The pictures of women were arranged in three blocks with each block comprising 48 trials. Each block included the following pictures: the 12 thin bodies with light grey underwear, the 12 thin bodies with dark grey underwear, the 12 normal weight bodies with light grey underwear, and the 12 normal weight bodies with dark grey underwear. In sum, each participant performed 144 trials.
In both AATs, each trial started by pushing the start button while the joystick was positioned in the middle position. This made a medium-sized picture appear in the center of the screen. The picture disappeared as soon as the joystick was moved completely in the correct direction. Time until the end of the full correct movement was used as reaction time (RT). Technically, this is equivalent to the interval between appearance and disappearance of the picture.
2.4.5 Explicit rating of food and body stimuli Food stimuliParticipants were asked to rate each of the 12 high calorie and each of the 12 low-calorie food pictures on visual analog scales ranging from 0 (not at all) to 100 (very much) by answering the following questions: (a) How much would you like to eat this food now? (urge to eat) and (b) How much would you regret it if you ate this food now? (regret).
Body stimuliParticipants were asked to rate one version of the thin body and one version of the normal weight body on visual analog scales ranging from 0 (not at all) to 100 (very much) by answering the following questions: (a) How normal do you think this body weight is? (b) How attractive do you think this body is? and (c) How desirable do you think this body is?
2.5 Statistical analysesWe computed several univariate analysis of variance (ANOVAs) to compare groups with regard to sociodemographic variables and clinical variables.
For descriptive statistics and correlations, we computed compatibility effect scores (CES) by subtracting each participant's mean RTs in the pull conditions from the mean RTs in the corresponding push conditions. These scores reflect the relative strength of approach and avoidance tendencies: values that are more negative indicate more negative reactions, that is, stronger avoidance (Rinck & Becker, 2007).
For testing our hypotheses, we used several mixed ANOVAs with group (AN, BN, and HCs) as between subject factor and stimulus (food: high calorie vs. low calorie; body: thin vs. normal weight) and direction (pull vs. push) as within subject factors to analyze approach-avoidance tendencies in the Food-AAT and Body-AAT. Three individuals were excluded from the Food-AAT (n = 2 HCs) or Body-AAT (n = 1 individual with AN) due to too many errors. The cut-off for the error rates in both tasks was 12%, based on the distribution of error rates in box plots and exceedingly high error rates. Separately for the two tasks, the fastest 1% of all RTs of full correct movements and the slowest 1% of all RTs of these movements were excluded before aggregation. This led to the exclusion of one participant in the Body-AAT (n = 1 individual with BN). We computed mean RTs after the outlier exclusion. We also screened for outliers on a participant level by computing z-scores for RTs in both tasks for each group (AN, BN, and HCs). There were no outliers as defined by a z-score > 3.29.
We used several univariate ANOVAs with group (AN, BN, and HC) as the independent variable and explicit ratings as the dependent variables to analyze group differences with regard to explicit ratings. We used Tukey or Games Howell as post hoc tests depending on the homogeneity of variances. A two-tailed α of .05 was applied for all statistical tests. ANOVA is considered as a robust test even when sample sizes are unequal if variances are homogenous (Bühner & Ziegler, 2009). Effect sizes for ANOVAs are reported by partial eta squared. Döring and Bortz (2016) suggested the following cut-offs for partial eta squared: small: η2 = .01, moderate: η2 = .06, large: η2 = .14. We computed 90% CI for partial eta squared using an SPSS syntax provided by http://core.ecu.edu/psyc/wuenschk/SPSS/SPSS-Programs.htm
3 RESULTS 3.1 ParticipantsThe final sample consisted of 42 individuals with AN (mean age = 24.93, SD = 5.30), 24 individuals with BN (mean age = 26.83, SD = 6.32), and 38 HCs (mean age = 24.08, SD = 3.36). The groups did not significantly differ in age, F(2, 101) = 2.29, p = .106, η2 = .04, or in education, Fisher's exact test = 2.94, p = .216; there were significant group differences in relationship status, χ2(2) = 9.75, p = .007. Importantly, the groups did not differ with regard to the time since last meal, F(2, 101) = 1.95, p = .148, η2 = .04. However, individuals with AN and BN reported more hunger than HCs, F(2, 101) = 28.04, p < .001, η2 = .36, whereas HCs reported a greater amount of their favorite food that they could imagine eating right now than individuals with AN and BN, F(2, 101) = 19.28, p < .001, η2 = .28; there was no group difference in time until next meal, F(2, 101) = 0.35, p = .704, η2 = .01. With regard to clinical variables, individuals with AN showed a lower BMI than the BN group and HCs, F(2, 101) = 59.54, p < .001, η2 = .54. Expectedly, the ED groups significantly differed from HCs in several measures of psychopathology (all ps < .001): Individuals with AN and BN scored higher than HCs in depressive symptoms, eating disorder pathology, sociocultural influences on body image, and body dissatisfaction. Individuals with BN showed higher scores for food craving than the AN group and HCs. For descriptive data and comorbidities, see Tables 1 and 2.
TABLE 1. Sociodemographic and clinical characteristics in individuals with anorexia nervosa (AN), bulimia nervosa (BN) and healthy controls (HC) Variable AN (n = 42) BN (n = 24) HC (n = 38) Test statistic p Effect size η2 Sociodemographic characteristics Age, years, M (SD) 24.93 (5.30) 26.83 (6.32) 24.08 (3.36) F(2, 101) = 2.29 .106 .04 Relationship, n (%) Without relationship 26 (61.9) 14 (58.3) 11 (28.9) χ2(2) = 9.75 .007 With relationship 16 (38.1) 10 (41.7) 27 (71.1) Education, years, n (%) < 10 years 2 (4.8) 2 (8.3) 0 (0.0) Fisher's exact test = 2.94 .216 ≥ 10 years 40 (95.2) 22 (91.7) 38 (100.0) Grand Hunger Scales Time since last meal, minutes, M (SD) 165.55 (37.32) 158.96 (37.73) 177.76 (40.55) F(2, 101) = 1.95 .148 .04 Hunger, 0–6, M (SD) 0.43 (0.83) 1.04 (1.12) 2.39 (1.52) F(2, 101) = 28.04 <.001 .36 Amount of favorite food, 0–6, M (SD) 1.21 (1.29) 1.46 (1.22) 2.92 (1.36) F(2, 101) = 19.28 <.001 .28 Time until next meal, minutes, M (SD) 107.86 (47.27) 101.46 (44.05) 112.11 (52.86) F(2, 101) = 0.35 .704 .01 Clinical characteristics Duration of illness, years, M (SD) 6.59 (6.24) 7.38 (6.60) F(1, 58) = 0.21 .648 .00 Duration of inpatient treatment, weeks, M (SD) 6.88 (4.08) 6.38 (2.53) F(1, 60) = 0.30 .588 .01 BMI, M (SD) 16.85a (2.15) 22.21b (2.84) 21.43b (1.94) F(2, 101) = 59.45 <.001 .54 BDI, total score, M (SD) 21.19a (10.84) 24.04a (10.76) 3.63b (4.97) F(2, 101) = 50.94 <.001 .50 EDE-Q, total score, M (SD) 3.12a (1.34) 3.43a (1.32) 0.76b (0.75) F(2, 101) = 55.54 <.001 .52 SATAQ, total score, M (SD) 57.79a (14.87) 63.71a (9.71) 42.11b (13.87) F(2, 101) = 22.57 <.001 .31 BSQ, total score, M (SD) 122.43a (36.77) 138.25a (30.60) 60.03b (22.98) F(2, 101) = 60.63 <.001 .55 FCQ-T-r, total score, M (SD) 35.60a (13.13) 61.00b (14.46) 27.08c (7.17) F(2, 101) = 64.02 <.001 .56 Note: Means in the same row that share the same subscripts do not differ at p < .05 in post hoc tests. Abbreviations: BMI, body mass index; BDI, Beck Depression Inventory; BSQ, Body Shape Questionnaire; EDE-Q, Eating Disorder Examination Questionnaire; FCQ-T-r = Food Craving Questionnaire Trait reduced; SATAQ, Sociocultural Attitudes Towards Appearance Questionnaire. TABLE 2. Current comorbid disorders in individuals with anorexia nervosa (AN) and bulimia nervosa (BN) Variable AN (n = 42) BN (n = 24) Current comorbidities, n (%) Screening for psychotic disorder 0 (0.0) 0 (0.0) Bipolar disorder 0 (0.0) 0 (0.0) Depressive disorder 6 (14.29) 10 (41.67) Anxiety disorder 18 (42.86) 8 (33.33) OCD and related disorder 4 (9.52) 2 (16.67) Trauma-related disorder 2 (4.76) 2 (8.33) Somatoform disorder 2 (4.76) 0 (0.0) Sleep-related disorder 13 (30.95) 6 (25.00) Screening for sexual dysfunction 16 (38.10) 7 (29.17) Screening for impulse control disorder 0 (0.0) 0 (0.00) 3.2 Food-AATA 3 (group: AN vs. BN vs. HC) × 2 (stimulus: high calorie vs. low calorie) × 2 (response: pull vs. push) mixed within-between ANOVA revealed a main effect of stimulus, F(1, 101) = 58.72, p < .001, η2 = .37, 90% CI [0.25, 0.47], indicating that all participants reacted faster to low-calorie stimuli than to high-calorie stimuli. There was a small albeit significant main effect of direction, F(1, 101) = 8.04, p = .006, η2 = .07, 90% CI [0.01, 0.17], indicating that all participants were faster when pushing pictures than when pulling pictures.
Importantly and with respect to our hypotheses, there was no significant Group × Stimulus × Direction interaction, F(2, 101) = 0.94, p = .393, η2 = .02, 90% CI [0.00, 0.07], which indicated that individuals with AN, BN, and HCs did not differ in their approach-avoidance reactions to high-calorie and low-calorie food. There was, however, a significant Group × Stimulus interaction, F(2, 101) = 5.49, p = .005, η2 = .10, 90% CI [0.02, 0.19]. Follow-up analyses indicated that even though all participants reacted slower to high-calorie than to low-calorie food, the difference was greater in individuals with AN compared to HCs, F(1, 78) = 10.80, p = .002, η2 = .12, 90% CI [0.03, 0.24]. There was no significant difference between individuals with AN and individuals with BN, F(1, 64) = 2.23, p = .140, η2 = .03, 90% CI [0.00, 0.13], and no significant difference between individuals with BN and HCs, F(1, 60) = 1.93, p = .170, η2 = .03, 90% CI [0.00, 0.13]. The other interaction effects, Group × Direction, F(2, 101) = 2.44, p = .093, η2 = .05, 90% CI [0.00, 0.12], and Stimulus × Direction, F(1, 101) = 1.37, p = .244, η2 = 0.01, 90% CI [0.00, 0.07], were not significant. For descriptive data, see Table 3.
TABLE 3. Descriptive data for mean reaction times (ms) and compatibility effect scores in the Food-AAT and Body-AAT in individuals with anorexia nervosa (AN), bulimia nervosa (BN), and healthy controls (HC) Variable AN (n = 42) BN (n = 24) HC (n = 38) Food-AAT High-calorie food pull 906.63 (137.79) 905.11 (115.08) 846.57 (96.63) High-calorie food push 876.01 (117.01) 878.15 (104.22) 847.45 (90.96) CES high-calorie food −30.62 (78.49) −26.96 (48.51) 0.88 (54.31) Low-calorie food pull 865.72 (132.69) 871.37 (97.38) 835.02 (96.09) Low-calorie food push 842.23 (114.51) 862.69 (94.68) 832.34 (85.05)
留言 (0)