Antimony (Sb) plays an important role in social development and is used in storage batteries, printing industries, semiconductors, and pharmaceuticals (Awe and Sandström, 2013; Zhang et al., 2019) and is an important strategic material. Currently, via the pyrometallurgical route, Sb can be extracted from stibnite (Sb2S3), which is the most important and ubiquitous antimony ore (Biver and Shotyk, 2012; Multani et al., 2016), but such a method results in high-energy consumption and environmental pollution. In addition, with the mining of antimony ore and the decrease in high-grade antimony ores, there is a need to develop new methods to extract Sb from low-grade ores or tailings.
Bioleaching is a green, low-cost, and low-emission technology used to extract metal ions from ores (Hong et al., 2023; Zhao et al., 2020), and plenty of bioleaching research has been carried out on sulfide ore. For Sb2S3, several researchers have explored the dissolution process of Sb2S3 and reported that microorganisms play important roles in the release, migration, and transformation processes of Sb2S3 (Bagherifam et al., 2021; Loni et al., 2020), as well as the environmental processes and relevant molecular mechanisms of antimony in mining areas (Wang et al., 2020; Yang and He, 2015; Ye et al., 2020). These studies have focused mainly on the environmental effects of environmental microorganisms. The use of acidophiles to extract Au from refractory gold ores containing abundant stibnite and gudmundite has also been studied (de Carvalho et al., 2019); recently, we studied the dissolution of stibnite mediated by Acidithiobacillus ferrooxidans (A. ferrooxidans) and relevant Sb and S speciation transformations and reported that A. ferrooxidans can enhance the leaching process of stibnite in comparison with sterile control experiments (Wang et al., 2022). During the bioleaching process, microorganisms convert antimony through direct oxidation or indirect reduction, that is, Sb(III) is oxidized as an energy metabolism substrate to Sb(V), as shown in Equations (1)–(3), obtaining the energy required for its growth (Loni et al., 2020; Lu et al., 2018). However, the bioleaching rate is not high because of the toxicity and insolubility of Sb2S3. Therefore, it is necessary to study methods to improve the antimony leaching rate. The associated minerals significantly impact on mineral dissolution (Multani et al., 2016; Wilson et al., 2004); however, few studies have investigated about how pyrite (FeS2), a common natural mineral associated with Sb2S3, affects the bioleaching rate of Sb2S3 (Yan et al., 2020) and the transformation process of Sb during the bioleaching process, and the related mechanisms are still unclear.
Sb2S3s→MicrobialSb3+aq+S2−aq (1) Sb3+aq→MicrobialSb5+aq+2e− (2) Sb5+aq+5H2Ol→MicrobialSb2O5s+10H+aq+5e− (3)In the present study, the effects of FeS2 on the fate and speciation transformation of Sb during the bioleaching of stibnite were studied via synchrotron radiation-based Sb X-ray near-edge structure (XANES) spectroscopy, and X-ray photoelectron spectroscopy (XPS) analyses, combined with density functional theory (DFT) calculations. In bioleaching bacterial strains, e.g., Sulfobacillus thermosulfidooxidans (Liu et al., 2024; Li, 2017), extracellular polymeric substances (EPS) are important components that are beneficial for bacterial adhesion processes (Wang et al., 2010), and glucose is the major sugar component in EPS (Gehrke et al., 1998); thus, in DFT calculations, glucose is utilized to simulate the interactions between bacteria and minerals (Zheng et al., 2020), and the Fe(III)-6H2O that is oxidized from FeS2 is also considered to simulate indirect effects during the bioleaching process (Zheng et al., 2019; Magini, 1979; Magini and Radnai, 1979). This study aims to understand the element migration mechanism in the Sb mining area, thus further identifying a potential scheme for improving the bioleaching rate of Sb2S3. To our knowledge, reports exploring the interfacial interactions for the FeS2-Sb2S3 bioleaching system by combining experiments and DFT calculations are rare.
2 Materials and methods 2.1 MineralsThe minerals Sb2S3 and FeS2 were provided by the School of Minerals Processing and Bioengineering, Central South University, Changsha, China. The XRD (X-ray diffraction patterns) results in Figure 1 revealed that the pyrite is pure, and the stibnite is mainly composed of Sb2S3 and quartz. Furthermore, the composition of stibnite was determined by XRF (X-ray fluorescence), and the results (Supplementary Table S1) show that Sb, S, and Si are the main components, with a small amount of Al. The ICP (inductively coupled plasma-optical emission spectroscopy) results revealed that the contents of Sb, S, and Fe were 2:3:0. Before the bioleaching tests, the mineral samples were crushed and milled to 37–74 μm particle sizes. FeS2 and Sb2S3 were mixed well at weight ratios of 0:1, 0.1:0.9, 0.2:0.8, 0.3:0.7, 0.5:0.5, and 0.8:0.2.
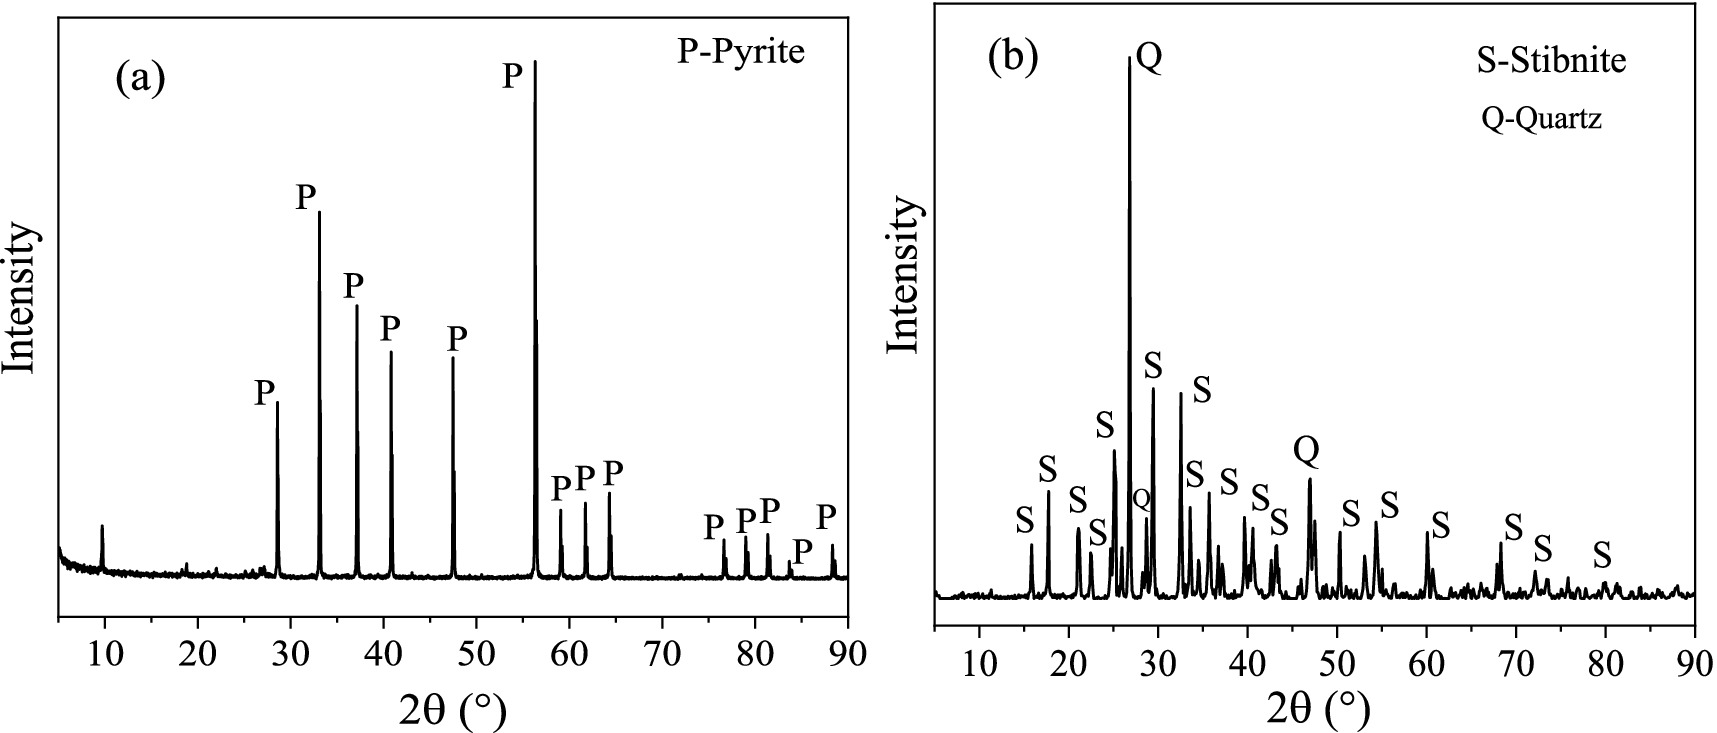
Figure 1. XRD results for FeS2(A) and Sb2S3(B).
2.2 Bioleaching experimentsFor the bioleaching experiments, the mixed samples were used as energy substrates, and the pulp density was 1% (w/v). The bacterium, Sulfobacillus thermosulfidooxidans YN22 (S. thermosulfidooxidans), provided by the School of Minerals Processing and Bioengineering, was used; the inoculation concentration was 4 × 10⁷ cells/mL in 100 mL 9 K medium, and the pH was adjusted to 2.0. Then, the flasks were placed in a rotary shaker at 180 rpm and 45°C. The pH and ORP during the bioleaching process were determined by a pH meter (PHS-3C) and Pt electrode using a calomel electrode (Ag/AgCl) as the reference, respectively; the concentrations of Sb and Fe were determined by ICP (SPECTROBLUE FMX26, Philadelphia, PA, United States), and the concentration of [Fe3+] was determined by the sulfosalicylic acid method. In detail, for [Sb] and [TFe], 1 mL of solution was collected, diluted with 10% nitric acid, and preserved at −80°C until analysis; for [Fe3+], 1 mL of solution was collected in the anaerobic chamber and diluted with prepared anaerobic water; then, 300 μL of 10% sulfosalicylic acid solution and 300 μL of diluted solution were added into a colorimetric tube, quantified to 10 mL with distilled water, shaken well, and then the mixed solution was measured using a microplate spectrophotometer at a wavelength of 500 nm. All the experiments were conducted in triplicate.
2.3 Residues composition analysisThe solid leaching residues were collected after leaching for 0, 5, and 10 days, washed three times with diluted sulfuric acid (pH 2.0) and hydrochloric acid (pH 2.0), and stored at −70°C. The surface morphologies of the residues were determined by scanning electron microscopy (SEM, Nano230, FEI) coupled with energy dispersive spectroscopy (EDS). In detail, the samples were prefixed with 25% formaldehyde, dehydrated via a graded ethanol series, coated with gold nanoparticles, and introduced into the SEM chamber for observation.
The residues phase compositions were analyzed by XRD in the range of 10–90° on a Bruker D8 instrument (BrukerAXS) with Cu Kα radiation The Sb speciation of the solid residue was analyzed by X-ray photoelectron spectroscopy (XPS). Briefly, XPS spectra were collected by an X-ray photoelectron spectrometer (Thermo Scientific K-Alpha+, United Kingdom) with a voltage and current of 12 kV and 6 mA, respectively. The obtained XPS data were analyzed in CasaXPS software, and all photoelectron binding energies were referenced to the C1s adventitious contamination peak set at 284.5 eV BE. Furthermore, Sb L-edge XANES spectroscopy was performed at beamline 4B7A in the Beijing Synchrotron Radiation Facility, Beijing, China. The Sb L-edge XANES spectra were recorded in total electron yield (TEY) mode with a step size of 0.1 eV and a dwell time of 2 s at each energy at 25°C from 4.60 to 4.80 keV across the Sb L-edge. Owing to the easy oxidization of the sample surfaces, all samples and tests were performed under strict anaerobic conditions with high-purity nitrogen gas (Goh et al., 2006), and were detected under the same conditions and parameter settings. The XANES spectra were normalized to the maximum of the absorption spectrum using reference spectra with the IFEFFIT program (Ide-Ektessabi et al., 2004; Prange, 2008; Ravel and Newville, 2005).
2.4 Electrochemical experimentsElectrochemical measurements were performed in 9 K medium (pH 2.0) via an electrochemical working station (INTERFACE 1010E, GAMRY, America). A conventional three-electrode system was used, including a counter electrode (carbon rods), a reference electrode (Ag/AgCl), and a working electrode (mineral electrode). The working electrodes were prepared by mixing 0.3 g graphite, 1.05 g minerals, and 0.15 g solid paraffin, and then the mixture was compressed at 120 KPa for 10 min. The Tafel curves were tested from −200 to +750 mV (vs open circuit potential, OCP) with a scan rate of 1 mV/s; the EIS (electrochemical impedance spectroscopy) curves were tested in the frequency range of 10−1 to 10−5 Hz, and fitted by Gamry Echem Analyst; the forward CV (cyclic voltammetry) was scanned from −1.0 to +1.0 V, while the reversed CV from +1.0 to −1.0 V. To explore the role of bacteria, S. thermosulfidooxidans was added to the medium with an inoculation amount of 2*108 cells/mL during the CV test. In this study, all the potentials reported were expressed vs. Ag/AgCl.
2.5 Computational detailsThe DFT calculations were performed via CASTEP (Cambridge Sequential Total Energy Package) (Segall et al., 2002) and GGA-PBE (Generalized gradient approximation-Perdew-Burke-Ernzerhof functional) (Perdew et al., 1996; Segall et al., 2002), in which only the valence electrons were considered explicitly using ultrashort pseudopotentials (Vanderbilt, 1990). Sb2S3 belongs to the space group Pmn21 (Park et al., 2010), and FeS2 belongs to the space group Th6-Pa3 (Qiu et al., 2004). After obtaining the Sb2S3 (0 1 0) surface and the FeS2 (1 0 0) surface, which are the most stable surfaces of the two sulfide ores (Blanchard et al., 2007; Cao et al., 2018; de Lima et al., 2011; de Oliveira et al., 2012), the supercells were built with a vacuum slab of 15 Å to avoid adjacent interlayer interactions (Fan et al., 2017). The FeS2-Sb2S3 interaction model was built by using building layer tools, and the calculation was performed after constraining the model size. A 3 × 3 × 1 k-point and 500 eV cutoff energy were used for the calculations. Glucose and Fe(III)-6H2O were optimized in a 15 × 15 × 15 Å slab. The convergence tolerances were set to a maximum displacement of 0.002 Å, a maximum force of 0.05 eV/Å, a maximum energy change of 2.0 × 10⁻⁵ eV/atom, and a maximum stress of 0.1 GPa, while the SCF convergence tolerance was set to 2.0 × 10⁻⁶ eV/atom. For all the calculations, spin polarization, dipole correction, and DFT-D correction were considered. The frontier orbitals, HOMO-LUMO, were calculated in DMol3. According to previous work, the calculation method above can provide reliable results for Sb2S3 and FeS2 (Cao et al., 2018; Cao et al., 2020; Zheng et al., 2018).
The glucose or Fe(III)-6H2O adsorption energies (Eads) can be calculated using equation 4:
Eads=EFeS2−Sb2S3−adsorbate−EFeS2−Sb2S3+Eadsorbate (4)where EFeS2-CuFeS2, Eadsorbate, and E(FeS2-CuFeS2 - adsorbate) represent the total energies for the clean FeS2-Sb2S3 surface, the free glucose/Fe(III)-6H2O, and the FeS2-Sb2S3–adsorbate system, respectively.
3 Results and discussion 3.1 Leaching parametersThe results (Figure 2) show that by adding FeS2, the pH decreases faster while the ORP increases faster, implying that the dissolution process of Sb2S3 may be accelerated. After leaching for 5 days, the extraction rates of Sb were approximately 2.22% (Sb2S3), 3.15% (0.1 FeS2: 0.9 Sb2S3), 4.1% (0.2 FeS2: 0.8 Sb2S3), 5.7% (0.3 FeS2: 0.7 Sb2S3), 24.6% (0.5 FeS2: 0.5 Sb2S3), and 18.7% (0.8 FeS2: 0.2 Sb2S3), where in the sterile control results (Supplementary Figure S1), the extraction rates of Sb were lower than 0.7%. After 10 days of leaching, the extraction rates of Sb decreased, and the reason may be the formation of secondary products that were found by the further results. In the 0.5 FeS2: 0.5 Sb2S3 system, the Sb dissolution rate was almost 11 times higher than that of pure Sb2S3, indicating that such a mixing ratio is the best leaching group. In addition, Figure 2D shows that Fe3+ occurs after the addition of FeS2 because FeS2 is oxidized by S. thermosulfidooxidans. In addition, Fe3+ attacks minerals (Jiang et al., 2019), which is called indirect action, thereby accelerating the dissolution of minerals. Notably, the concentration of Fe3+ is lower than that of the total Fe (Supplementary Figure S2A), which is probably because of formation of Fe2+ (Ubaldini et al., 2000; Zhang et al., 2019), as shown in Supplementary Figure S2B. In the next section, the 0.5 FeS2: 0.5 Sb2S3 mixture is analyzed further.
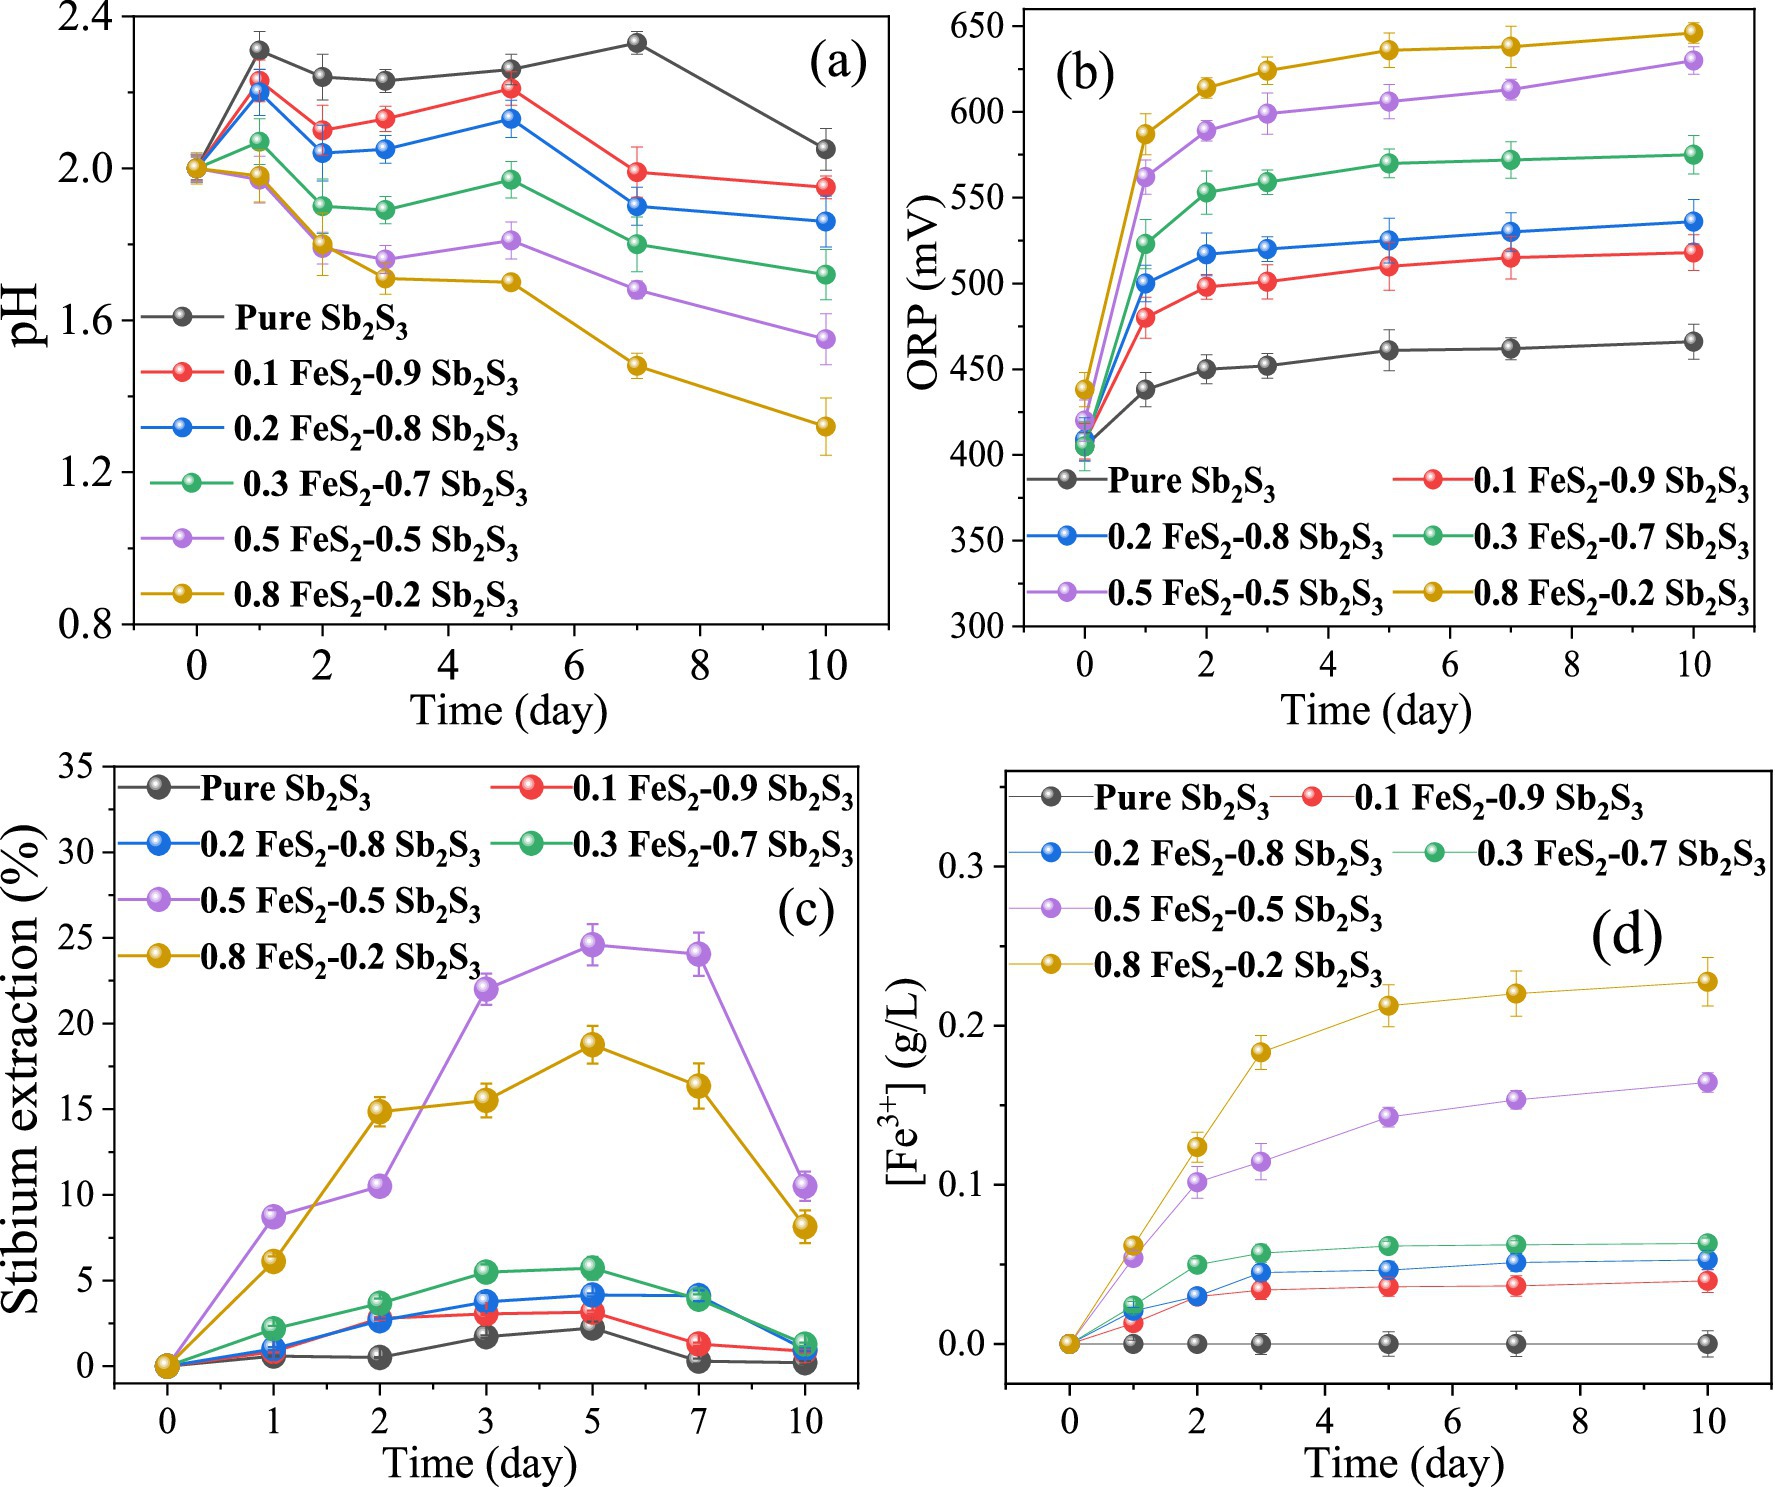
Figure 2. Curves for the pH (A), ORP (B), Sb extraction rate (C), and Fe3+ concentration for the bioleaching of Sb2S3 in the presence of varying concentrations of FeS2.
The XRD results (Figure 3) revealed that after 5 and 10 days of bioleaching, the peaks of FeS2 at 47.5° weakened, implying the dissolution of FeS2; the peak at 27° associated with Sb2O3 became stronger, and the peaks at 15.7° and 17.6° associated with Sb2S3 became weaker, indicating that Sb2S3 was transformed to Sb2O3 during bioleaching (Wang et al., 2022). Notably, in the sterile control sample, the peaks presented little or no change after 10 days of leaching. The SEM results (Figure 4; Supplementary Figure S3) show that by adding FeS2, the Sb2S3 surface obviously changed after 5 days of leaching with obvious secondary products, whereas the changes in pure Sb2S3 (Supplementary Figure S4) were negligible, confirming the promoting effect of FeS2, and the source of secondary minerals was the dissolution of some FeS2 (Yang et al., 2016). In addition, in the sterile control sample (Figures 4D,E), the mineral surface changed little, indicating that bacteria play an important role in the oxidation of minerals.
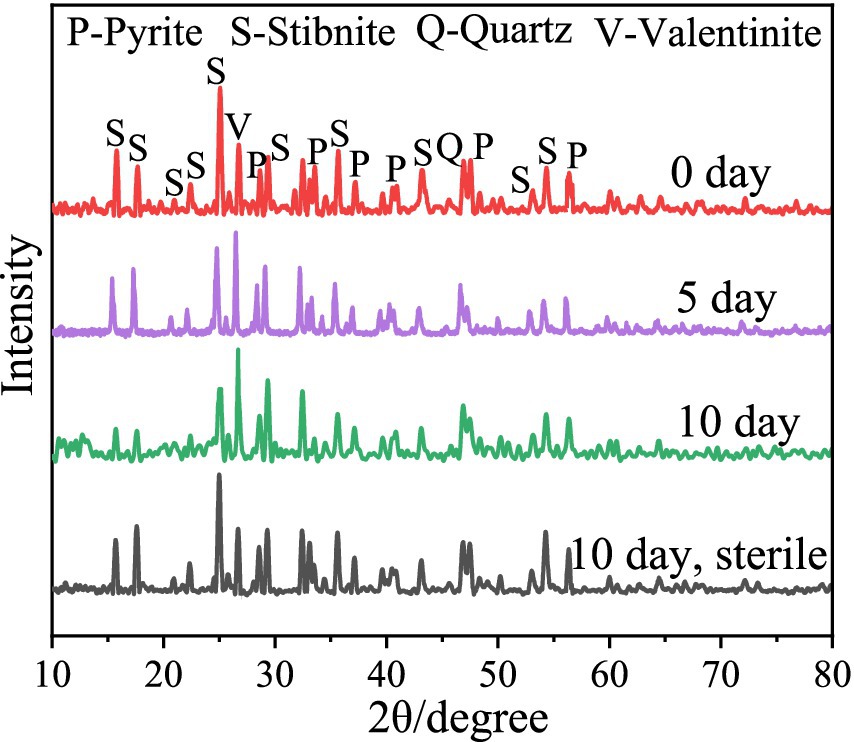
Figure 3. XRD of the bioleaching residues.
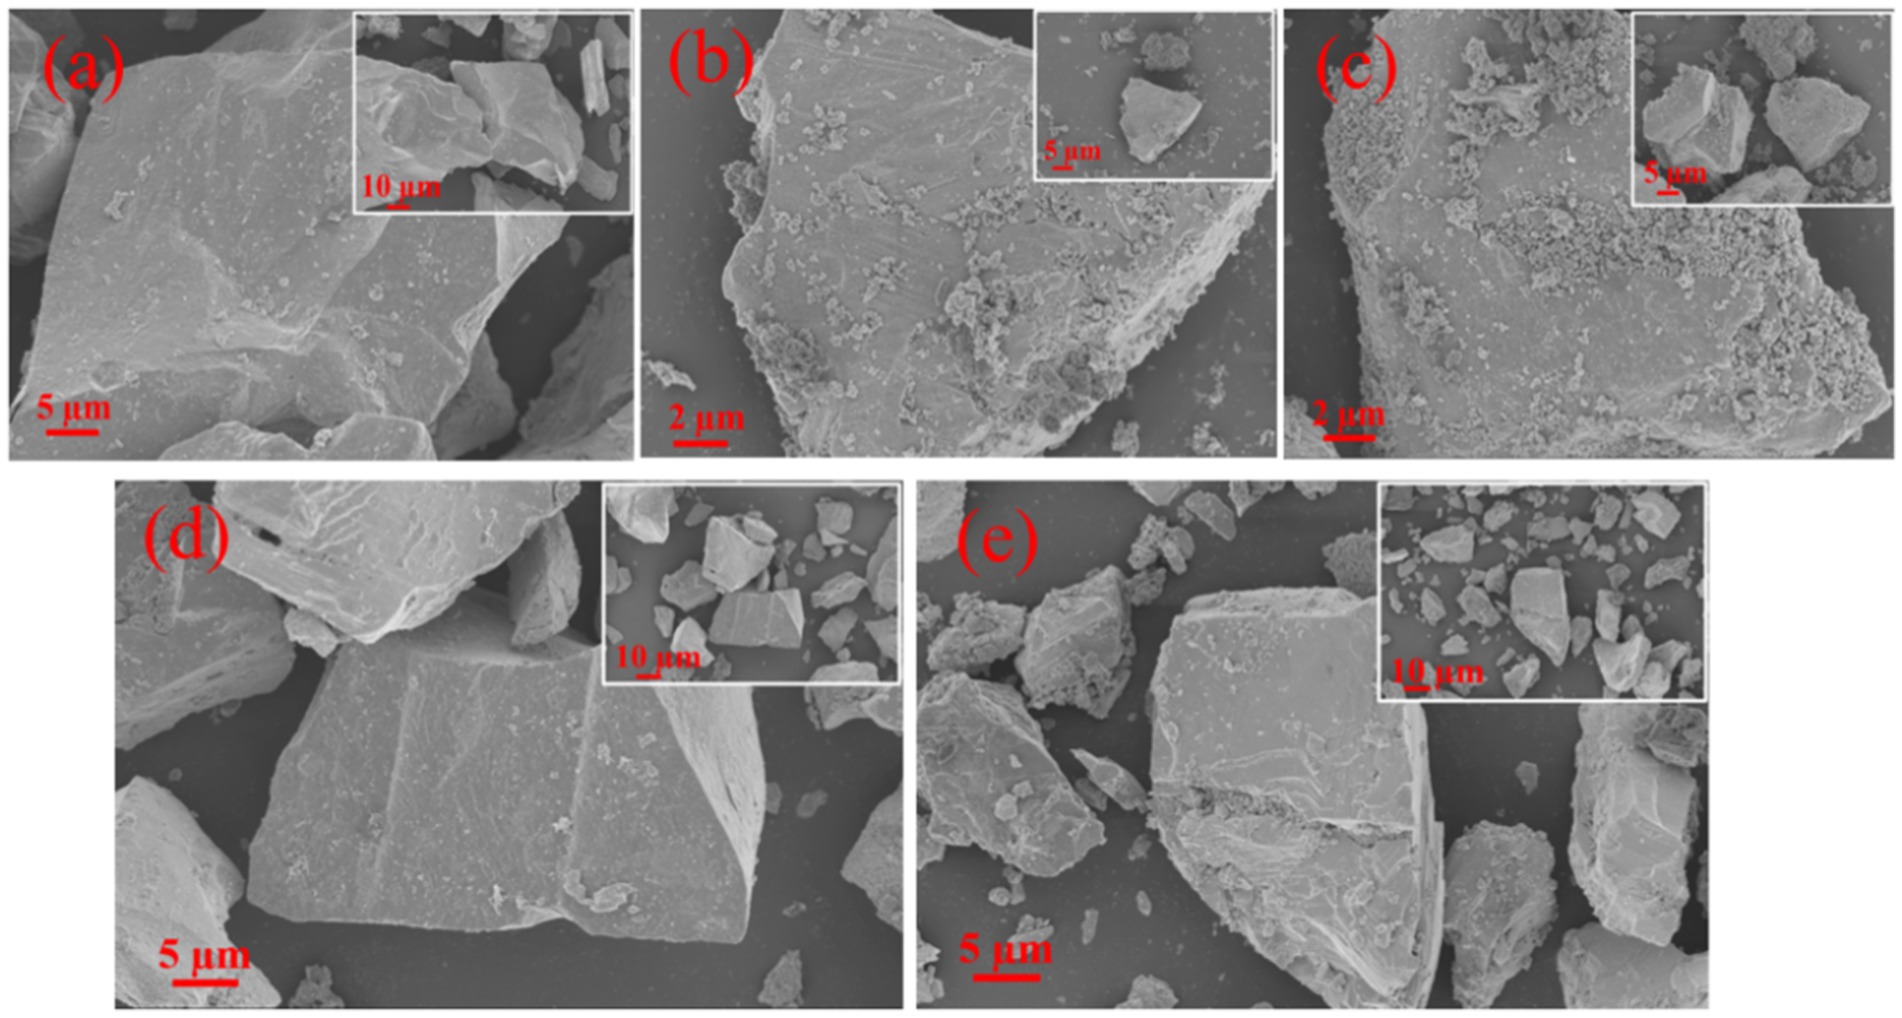
Figure 4. (A–C) SEM images of the bioleaching residues after 0, 5, and 10 days with the addition of FeS2; (D,E) SEM images of the residues after 0 and 10 days in the sterile control.
The XPS results (Figure 5) show that after 5 days of bioleaching, part of Sb2S3 (529.5 eV) (Morgan et al., 1973) was transformed to Sb2O3 (530.5 eV, 48.7%) and Sb2O5 (532.1 eV, 9%), and the proportion of Sb2S3 decreased from 74.6 to 42.3%; as the leaching time increased to 10 days, the proportion of Sb2O3 increased to 66%, and that of Sb2O5 increased to 9.4%, whereas the proportion of Sb2S3 decreased to 24.5%; in the sterile controlled experiment (Figure 5D), the proportion of Sb2S3 decreased to 62.4% after 10 days of leaching, which was much slower.
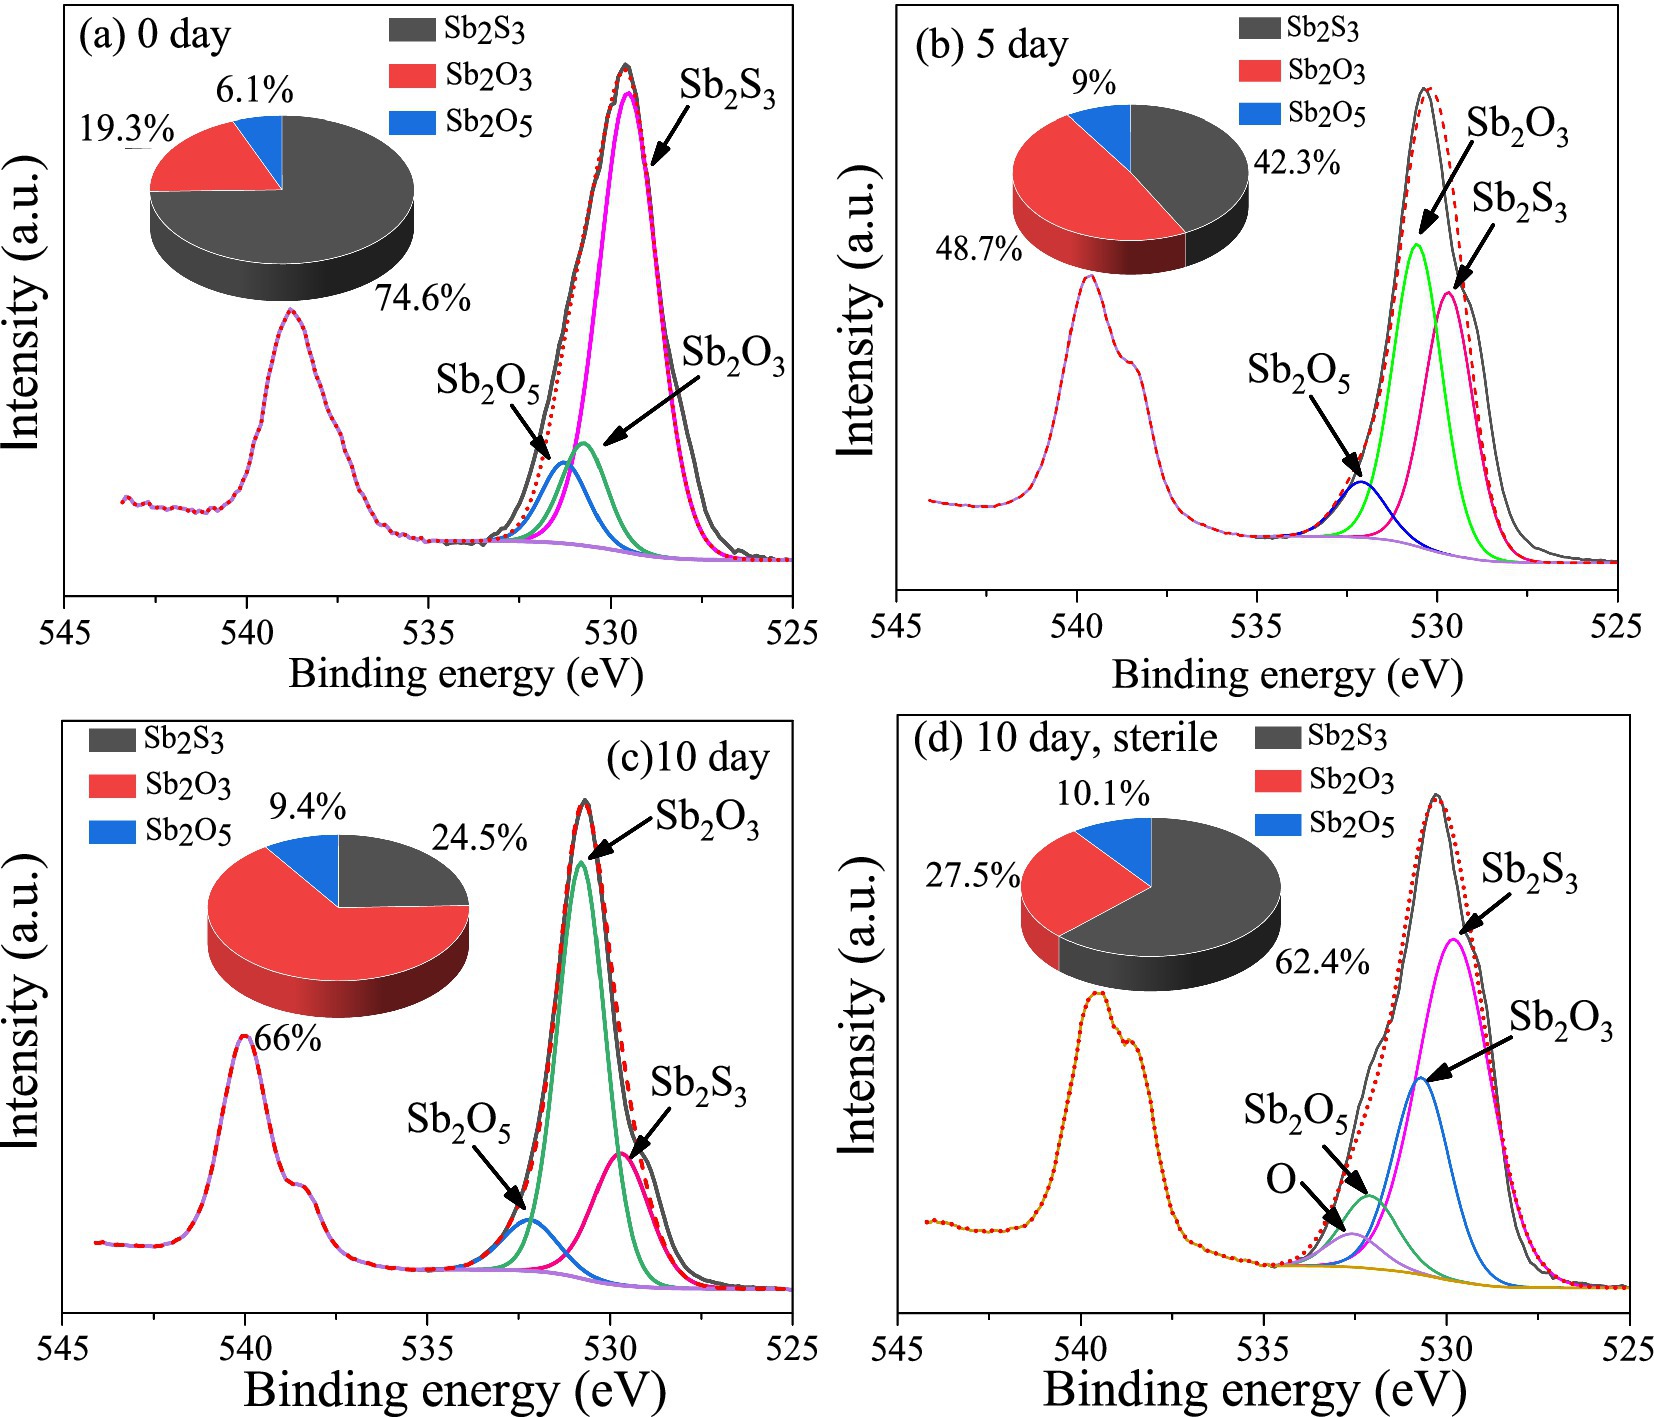
Figure 5. XPS spectra of Sb on the surface of the bioleaching residues.
The Sb L-edge XANES spectra (Figure 6) show that after 5 and 10 days of bioleaching, the peak shifts from 4.7062 to 4.707 keV, indicating the conversion of Sb2S3 to Sb2O3, and the peak at 4.711 keV increases with increasing bioleaching time, which indicates the conversion of Sb(III) to Sb(V), similar to the XPS results. In addition, in the sterile controlled experiment, after 10 days, no or little Sb(III) was converted to Sb(V), confirming the important role of bacteria.
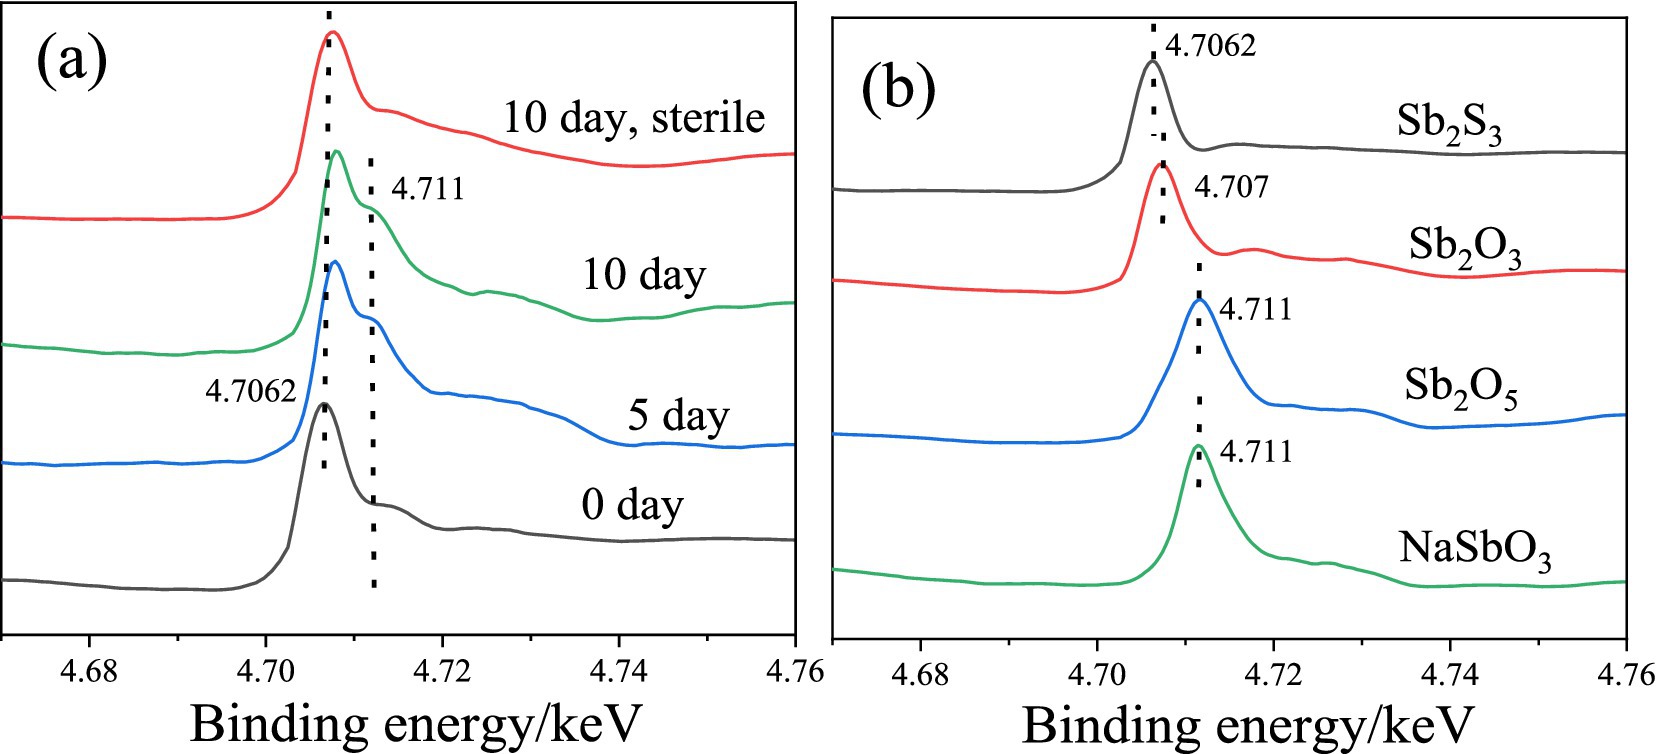
Figure 6. Sb L-edge XANES spectra of the residues during bioleaching (A) and the reference materials (B).
3.2 Electrochemical analysesFor mineral-mineral interactions, a galvanic effect may occur when two minerals have different corrosion potentials; however, minerals with higher potentials can act as cathodes and the other minerals with lower potential can act as anodes electrode (Ekmekqi and Demirel, 1997). The lower the value of the corrosion potential is, the easier it is for the mineral to corrode. Tafel tests were performed to analyze the mineral corrosion kinetics. The Tafel results (Figure 7A) show that the corrosion potentials (vs. Ag/AgCl) for FeS2 and Sb2S3 are 428 mV and 327 mV, respectively; thus in a FeS2-Sb2S3 system, the galvanic effect occurs, and Sb2S3 is the anode electrode, implying that the leaching rate of Sb2S3 is promoted (Zheng et al., 2021).
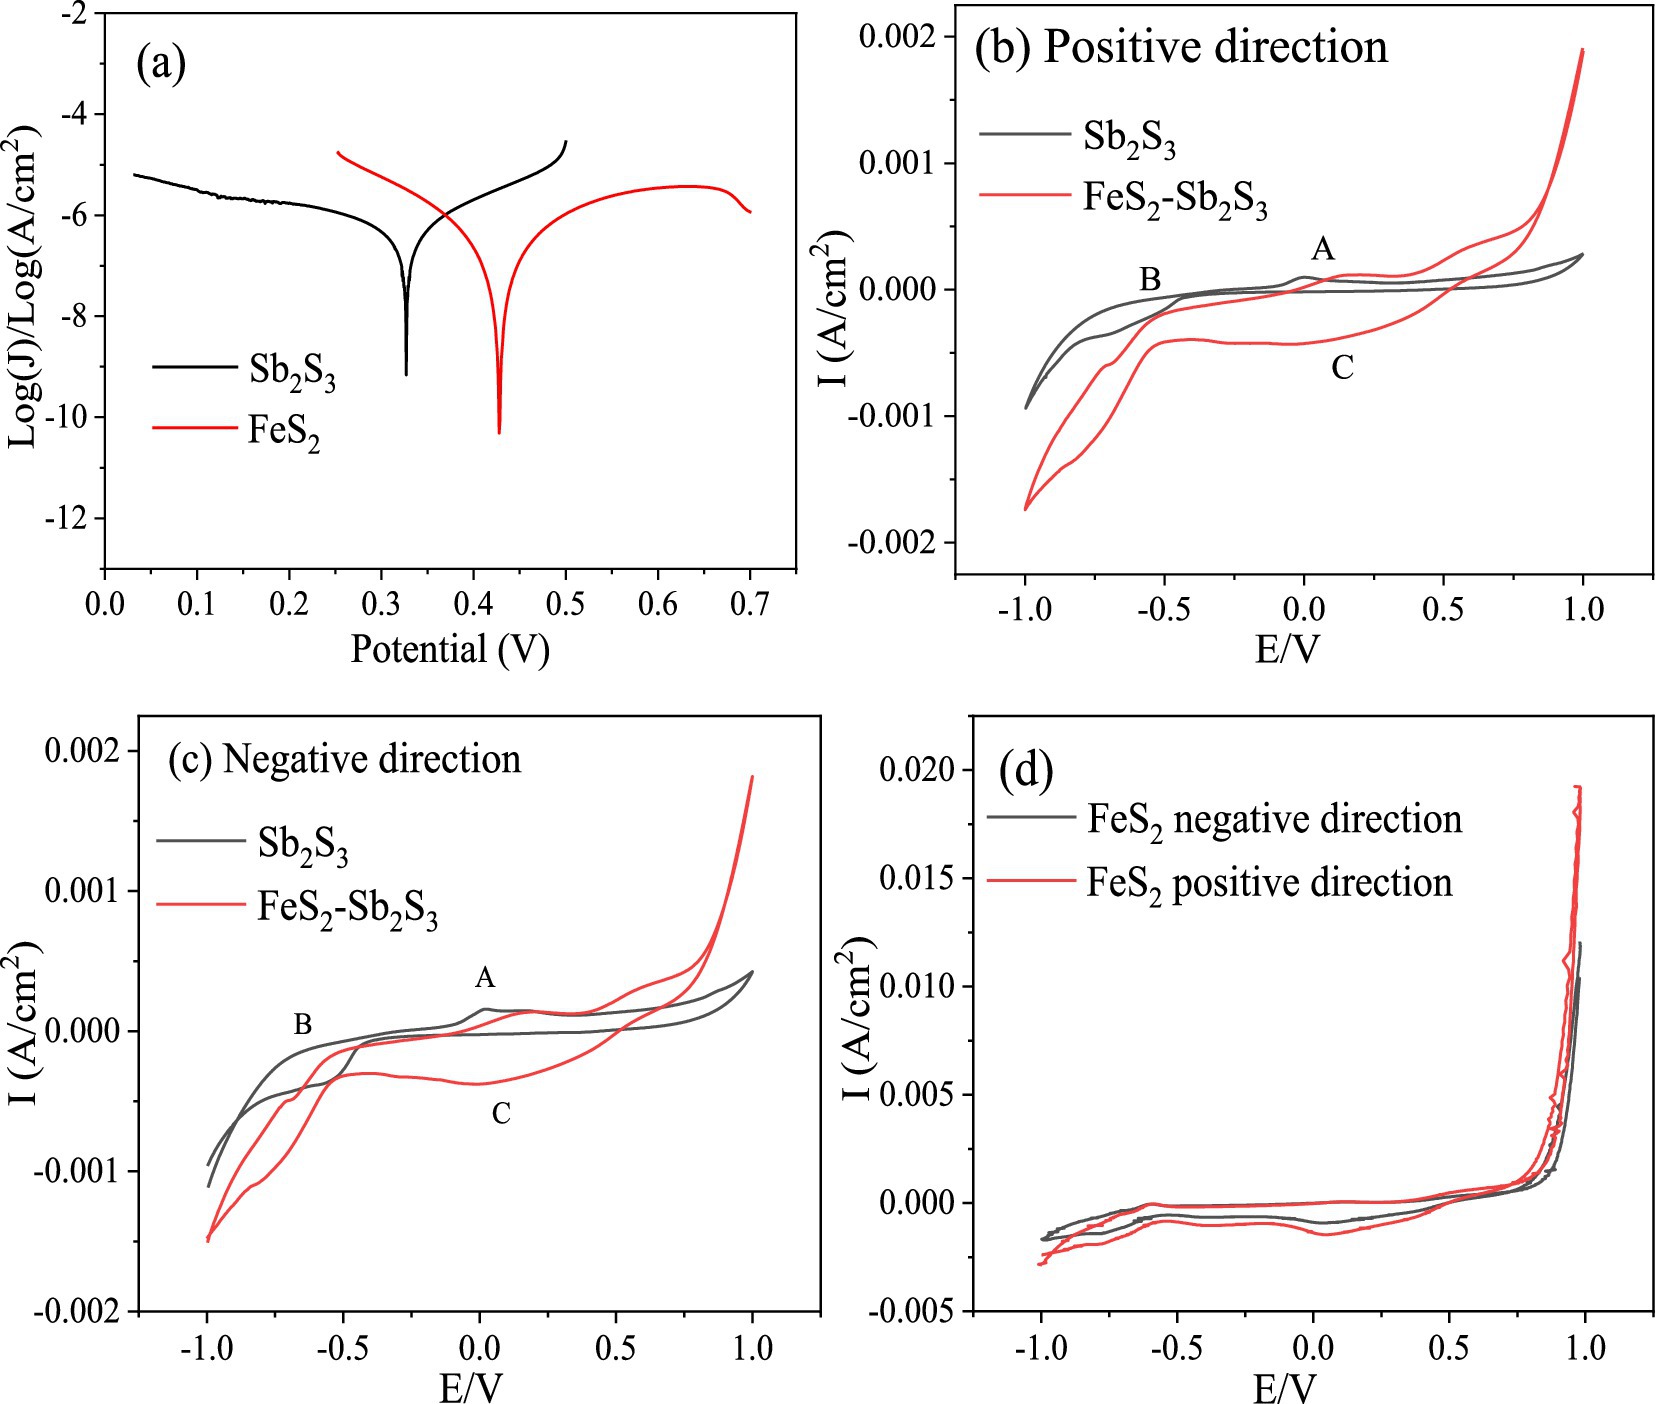
Figure 7. Tafel and CV curves for FeS2, Sb2S3 and FeS2-Sb2S3.
Among electrochemical methods, CV is widely used due to its simple operation and effective results for the interpretation of electrochemical reactions. The results in Figure 7 show that the oxidation peaks of Sb2S3 and the corresponding reduction peaks are not symmetrical, indicating that the redox reaction on the Sb2S3 surface is an irreversible process (Córdoba et al., 2009). Figures 7B,C shows that the CV peaks of FeS2-Sb2S3 are similar to those of Sb2S3 (A1, B1, and C1), implying that Sb2S3 reacts preferentially during the electrochemical process. The current density is greater after addition of FeS2, indicating an increase in the Sb2S3 reaction.
To investigate the effects of bacteria on the dissolution of Sb2S3, the effects of CV with S. thermosulfidooxidans were analyzed. Supplementary Figure S5 shows that after adding bacteria (2*108 cells/ml), the current density increased further, confirming that the bacteria can obviously enhance the leaching rate of Sb2S3. During the bioleaching process, some of the FeS2 is oxidized by bacteria to produce Fe3+ (Yang et al., 2016), so the effect of Fe3+ was also studied, and the results (Supplementary Figure S6) revealed that after adding Fe3+ (0.15 g/L), the current density also increased, indicating that Fe3+ can also enhance the leaching rate of Sb2S3.
The electron transfer efficiency of minerals was analyzed via EIS. The data obtained were analyzed by fitting the impedance data to an appropriate equivalent circuit as Rs(Q1(R1Q2)) (Bevilaqua et al., 2009; Supplementary Figure S7). In the equivalent circuit, Rs, R1, and Q1 represent the solution resistance, ion exchange impedance, and constant phase element, respectively. Q1 is connected to the electrode interface. Q2 represents a Warburg element, and is related to the electrode/electrolyte interface diffusion process (Zeng et al., 2020). Figure 8 shows that after adding FeS2, the curve radius decreases; the results in Table 1 show that R1 for FeS2-Sb2S3 (30.71 Ω·cm−2) is much smaller than that for Sb2S3 (24,300 Ω·cm−2). Both results indicate that after mixing, the ion exchange resistance on the mineral surface decreases; in other words, after Sb2S3 mixed with FeS2, the leaching system has a relatively high electron transfer efficiency, which significantly promotes the bioleaching rate.

Figure 8. Nyquist plots for Sb2S3(A), FeS2(B), and FeS2-Sb2S3(C).

Table 1. Fitting results obtained via the circuit Rs(Q1(R1Q2)) for Sb2S3, FeS2, and FeS2-Sb2S3.
3.3 Computational results 3.3.1 Electronic structureThe models of Sb2S3 and FeS2-Sb2S3 are shown in Figure 9, and the corresponding atomic numbers used are shown in Supplementary Figure S8. The results in Figure 9 show that after adding FeS2, the surface structure of Sb2S3 gradually became disordered, which was conducive to the dissolution of Sb2S3. Table 2 shows that after adding FeS2, the Hirshfeld charge value of FeS2 decreases from 0 to −0.77, whereas the charge value of Sb2S3 increases from 0 to 0.77, indicating that the direction of electron transfer is from Sb2S3 to FeS2.
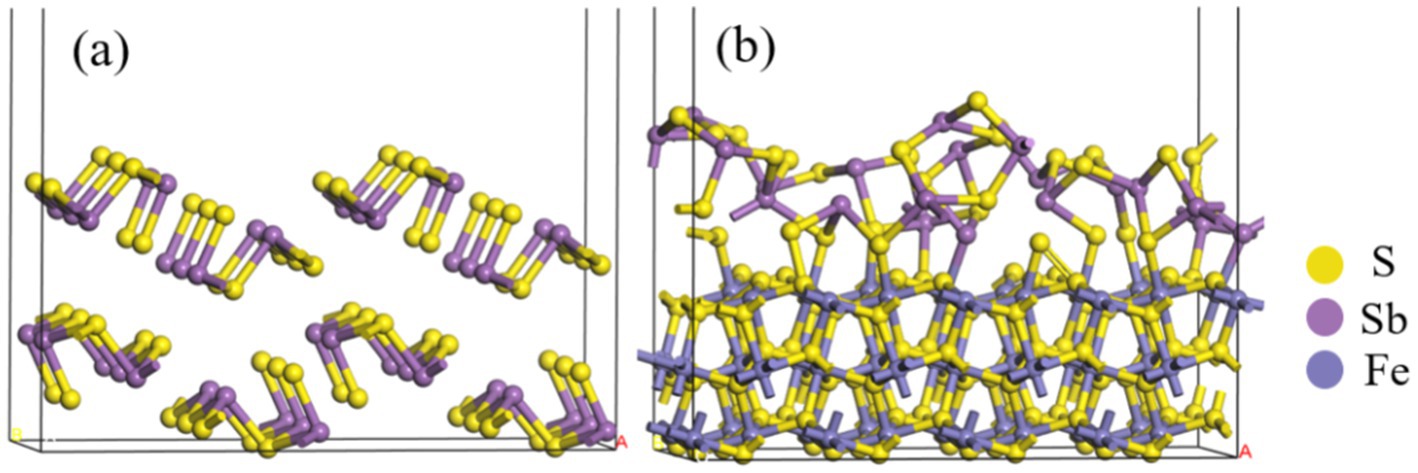
Figure 9. Optimized configurations of Sb2S3(A), and FeS2-Sb2S3(B).

Table 2. Hirshfeld charge analysis of FeS2-Sb2S3.
The bond lengths between FeS2 and Sb2S3 are shown in Table 3. In the FeS2-Sb2S3 galvanic cell, S-Fe, S-S, Sb-Fe, and S-Sb bonds formed at the interface, and the number of S-Fe bonds was greater than that of the other materials. S3-S23 is the shortest bond (2.128 Å), whereas Sb12-S48 is the longest bond (2.619 Å). The Mulliken bond population results show that the S2-Fe2 bond has stronger covalent interactions, and that the Sb5-S32 bond has stronger ionic interactions.
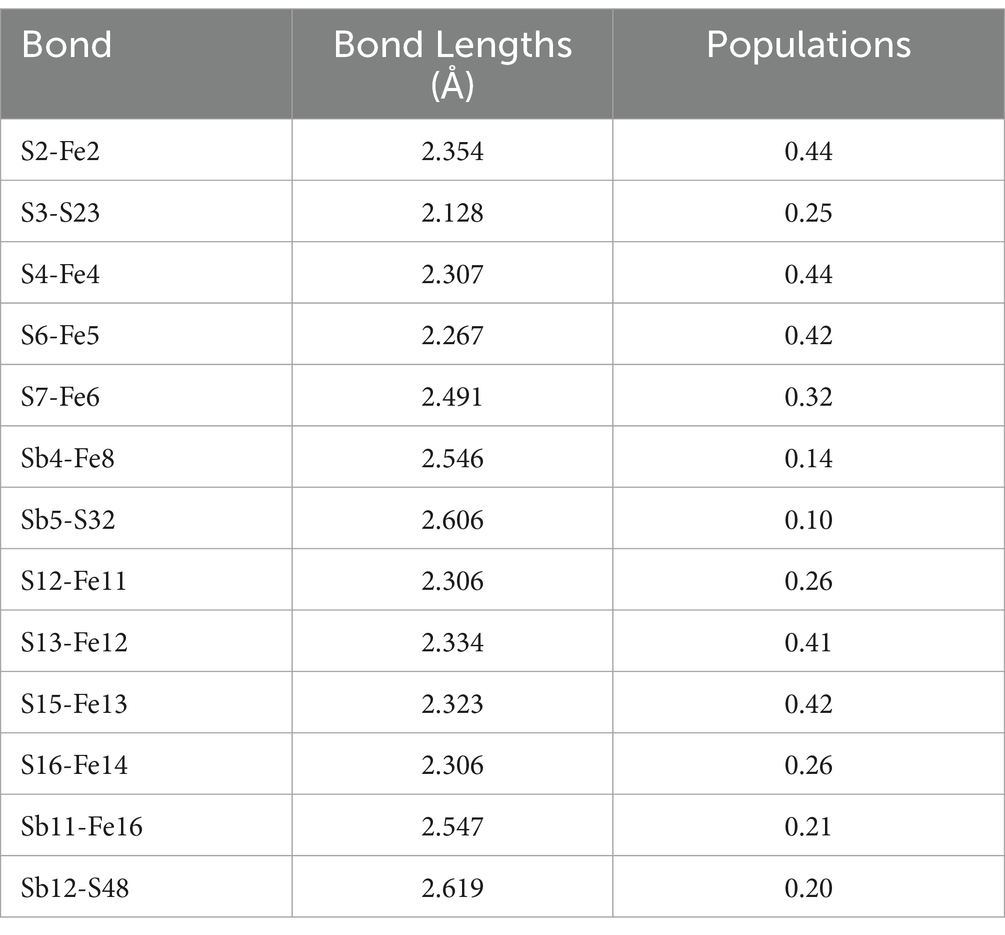
Table 3. Mulliken bond population analysis of FeS2-Sb2S3.
The PDOS of the S3-S23, S6-Fe5, Sb4-Fe8, and Sb6-S32 bonds were analyzed further. Figure 10 shows that in the S3-S23 bond, from −20 eV to 10 eV, the main peaks belong to σ(2 s), σ*(2 s), σ(2p), π(2p), π*(2p), and σ*(2p) bonds, and the maximum overlap area between S 3p ranges from −10 eV to 5 eV, implying that σ(2p) and π(2p) are the main covalent interactions; in the S6-Fe5 bond, from −15 eV to 5 eV, the main peaks belong to σ(s-d), σ*(s-d), π(p-d), and π*(p-d) bonds, and the maximum overlap area between S 3p and Fe 3d ranges from −10 eV to 5 eV, implying that π(p-d) are the main covalent interactions, and the same result can also be obtained in the Sb4-Fe8 bond; in the Sb6-S32 bond, the antibonding function from 0 eV to 15 eV is strong, implying weak covalent interactions, similar to the population results.
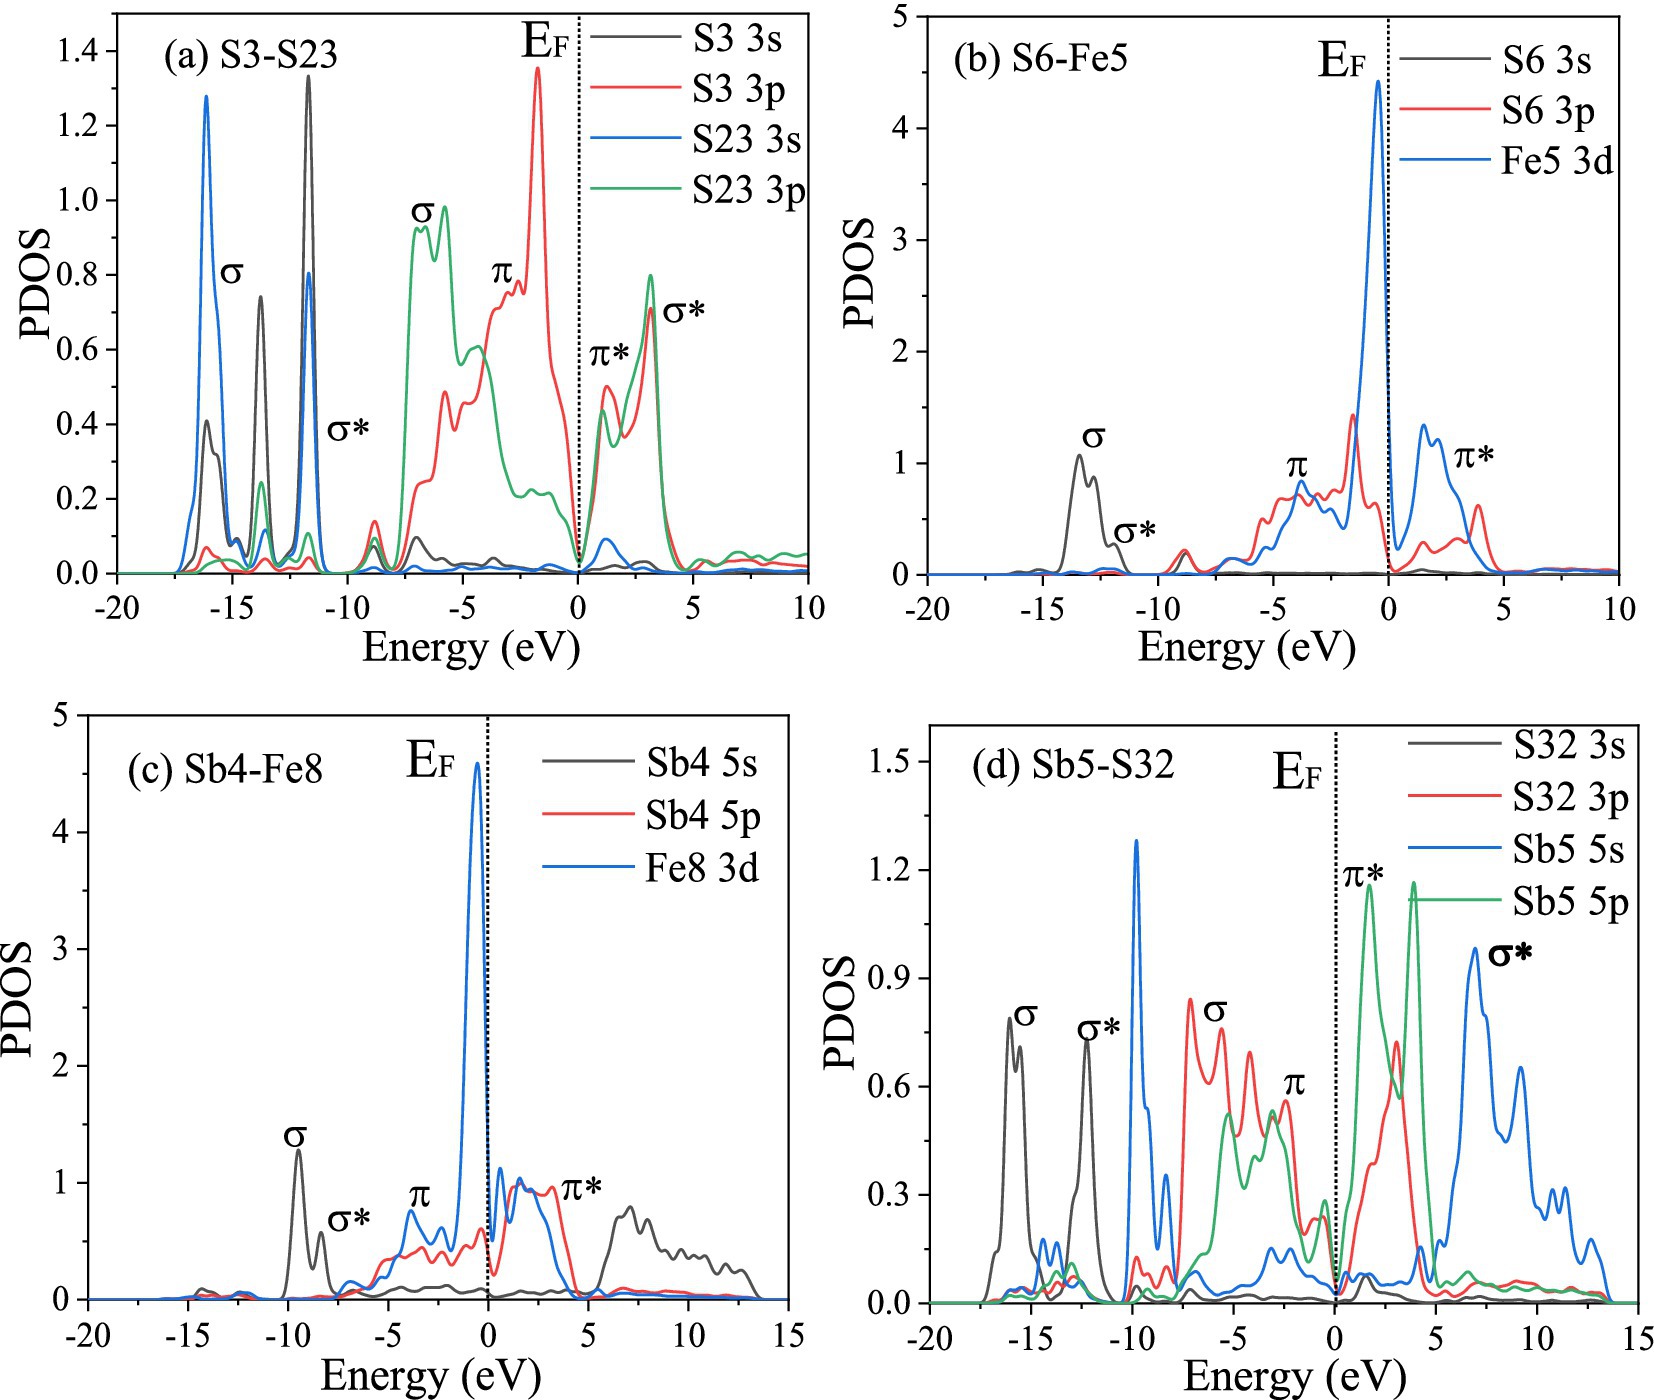
Figure 10. PDOS of the bonds between the FeS2 and Sb2S3 surfaces.
The work functions (Figure 11) for Sb2S3 and FeS2-Sb2S3 were calculated to be 5.17 eV, and 4.59 eV, respectively, implying that the electron transfer efficiency becomes faster after mixing, which agrees with the EIS results above.

Figure 11. Work functions of Sb2S3(A), and FeS2-Sb2S3(B).
3.3.2 Adsorption configurations and energiesIn the theory of frontier orbitals, HOMO (highest occupied molecular orbital) can donate electrons, and LUMO (lowest unoccupied molecular orbital) can accept electrons (Sauer and Sustmann, 1980). According to previous studies (Sauer and Sustmann, 1980; Zheng et al., 2018), a smaller HOMO-LUMO energy difference absolute value implies a more beneficial interaction. The results in Table 4 shows that ΔE2 is lower than ΔE1, indicating that the interaction mainly occurs between the HOMO of glucose and LUMO of FeS2-Sb2S3 rather than the HOMO of FeS2-Sb2S3 and the LUMO of glucose; the results also show that ΔE4 is lower than ΔE3, implying a beneficial interaction between the HOMO of Fe(III)-6H2O and LUMO of FeS2-Sb2S3.

Table 4. Frontier orbital energies of FeS2-CuFeS2 and glucose/Fe(III)-6H2O.
Figures 12A,B and Table 5 show that after adding FeS2, the bond length (Å) between glucose and the Sb2S3 surface becomes shorter, from 3.093 Å to 2.907 Å, and the adsorption energy decreases from 0.35 eV to 0.16 eV, indicating that FeS2 can promote the adsorption of bacteria on the Sb2S3 surface, thereby enhancing bioleaching. Figures 12C,D and Table 5 show that Fe(III)-6H2O can adsorb on the Sb2S3 surface and has a shorter bond length and lower adsorption energy than glucose. Table 6 shows that after Fe(III)-6H2O adsorption, the charge change is more greater (−0.21) than that of glucose (−0.03). The EDD (Electron density difference) result (Figure 13) shows that there is more electron transfer between Fe(III)-6H2O and Sb2S3, implying stronger adsorption. Notably, the results also show that FeS2 can promote the adsorption of Fe(III)-6H2O on the Sb2S3 surface, possibly because adding FeS2 makes the Sb2S3 surface disordered, which is beneficial for Fe(III)-6H2O adsorption. In general, trivalent iron derived from FeS2 has a stronger oxidation effect on Sb2S3 during the bioleaching process.
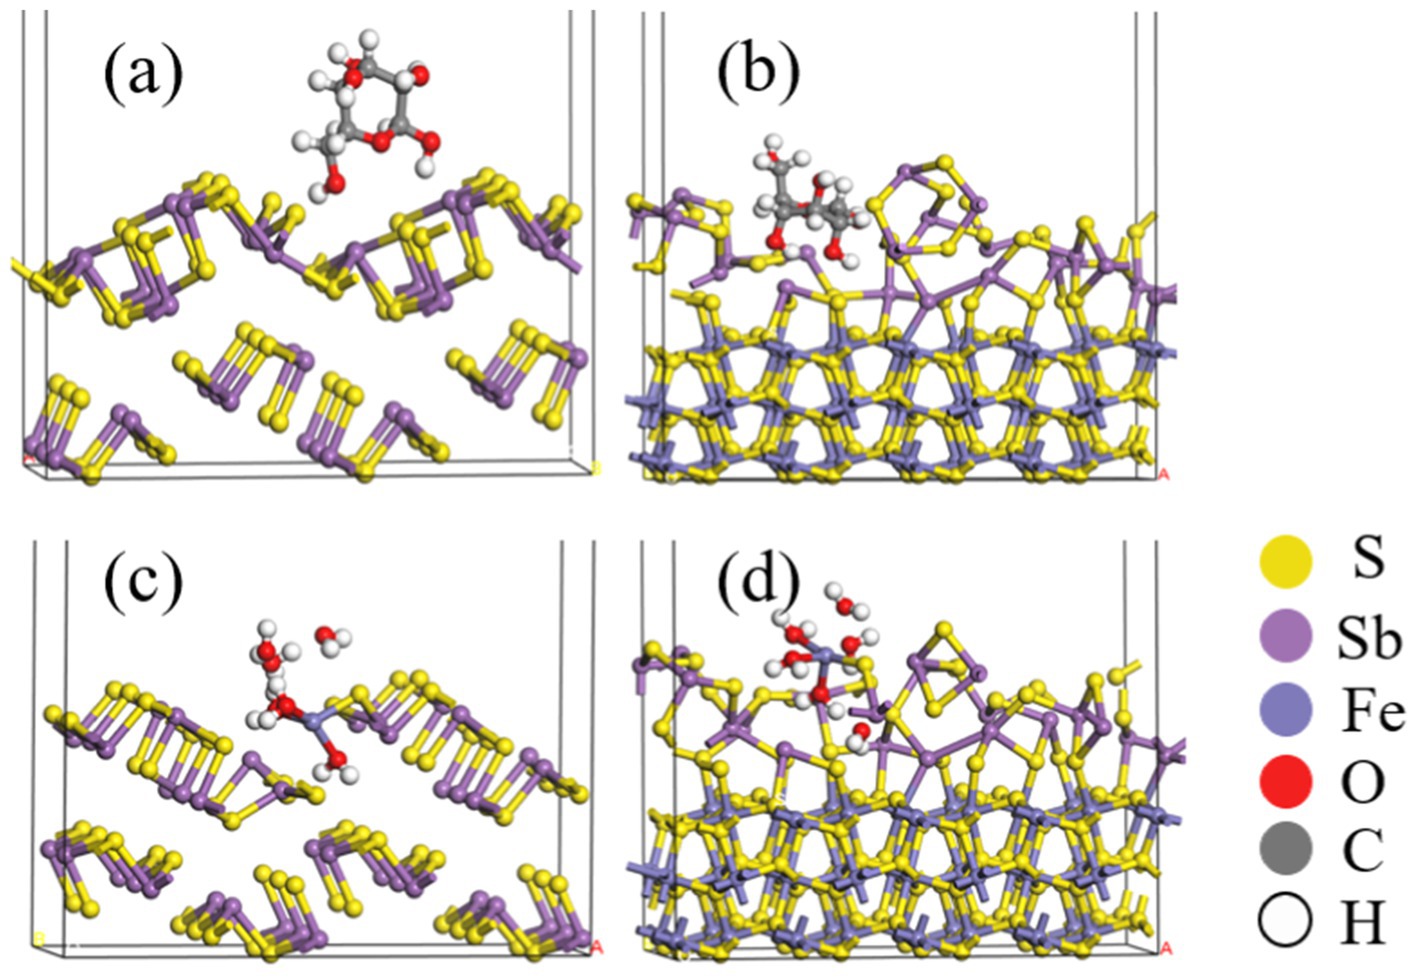
Figure 12. Optimized configurations of glucose (A,B) or Fe(III)-6H2O (C,D) adsorbed on Sb2S3, FeS2-Sb2S3.

Table 5. Mulliken bond population analysis of FeS2-Sb2S3.

Table 6. Hirshfeld charge analysis of Sb in Sb2S3.

Figure 13. (A,B) Electron density difference for the interaction between glucose and the Sb2S3, FeS2-Sb2S3 surface; (C,D) electron density difference for the interaction between Fe(III)-6H2O and the Sb2S3, or FeS2-Sb2S3 surface. The green area represents electron loss, and the blue contours indicate an increase in the electron density.
4 ConclusionIn this work, the effects of FeS2 on the bioleaching of Sb2S3 were investigated by combining experiments and DFT calculations, and the results can be summarized as follows: (1) After adding FeS2, the bioleaching rate of Sb2S3 increased significantly, from 2.23 to 24.6% after 5 days of bioleaching, and the best mass mixing ratio was 0.5:0.5; (2) During the bioleaching process, Sb2S3 was gradually transformed to Sb2O3 and Sb2O5; (3) Adding FeS2 can form a FeS2-Sb2S3 galvanic cell, which has a greater redox reaction current density, and faster electronic delivery efficiency; and (4) The DFT results indicated that after mixing, both Fe(III)-6H2O and glucose could adsorb onto the Sb2S3 (0 1 0) surface more easily, and Fe(III)-6H2O may play a major role in Sb2S3 bioleaching.
Data availability statementThe original contributions presented in the study are included in the article/Supplementary material, further inquiries can be directed to the corresponding authors.
Author contributionsX-fZ: Methodology, Resources, Software, Validation, Visualization, Writing – original draft, Writing – review & editing. J-lX: Funding acquisition, Resources, Supervision, Visualization, Writing – original draft, Writing – review & editing. Z-yN: Formal analysis, Methodology, Resources, Supervision, Writing – review & editing. H-pC: Investigation, Methodology, Resources, Writing – review & editing. R-JH: Formal analysis, Supervision, Writing – review & editing. Y-tL: Data curation, Methodology, Supervision, Writing – review & editing. H-cL: Funding acquisition, Methodology, Visualization, Writing – original draft, Writing – review & editing.
FundingThe author(s) declare financ
留言 (0)