
記住我


In total, 12 healthy individuals were recruited for participation in this study (mean age, 30.5 ± 5.9 years; seven males). The study protocol was explained to all participants, who gave verbal and written consent before enrollment. None of the participants had a history of dysphagia, gastrointestinal disease, pulmonary and neurological diseases, or other significant medical conditions. The experimental protocol was approved by the Ethics Committee of Hamamatsu City Rehabilitation Hospital (#17 − 02).
High-Resolution Manometry (HRM)HRM was used to determine whether the participants successfully reproduced vacuum swallowing. Pressure and timing data were extracted using the ManoScan software (Medtronic Inc., Minneapolis, MN, USA), and a solid-state high-resolution manometer (Laborie Medical Technologies Corp., Portsmouth, NH, USA) was used for data collection. Manometric data were obtained using a solid-state manometry catheter assembly (outer diameter, 4.2 mm) with 36 circumferential pressure sensors placed 1 cm apart. The catheter was calibrated and zeroed to atmospheric pressure, and manometric studies were performed in the sitting position. The nasal cavity was anesthetized with lidocaine jelly. Additionally, the catheter was lubricated with lidocaine jelly to ease its passage through the nasal cavity; it was intranasally inserted and positioned to obtain data from the hypopharynx to the stomach beyond the high-pressure zone at the LES. Next, the catheter was fixed with tape at the nasal wing. After a 5–10-min acclimatization period, the basal pressure was recorded for 30 s. Subsequently, the participants reproduced the vacuum swallowing technique as per the instructions.
Instruction on Vacuum SwallowingFirst, two healthy individuals, the attending medical doctor and speech-language pathologist for the previously reported case, attempted to reproduce vacuum swallowing by observing the patient and VF [15]. The VF revealed diaphragmatic movement and thoracic expansion during vacuum swallowing. As previously reported, these two instructors confirmed that the use of HRM created strong subatmospheric negative pressure in the esophagus during swallowing. Consistent with previous reports, strong negative pressure creation in the esophagus and increased LES pressure were observed during vacuum swallowing compared to normal swallowing.
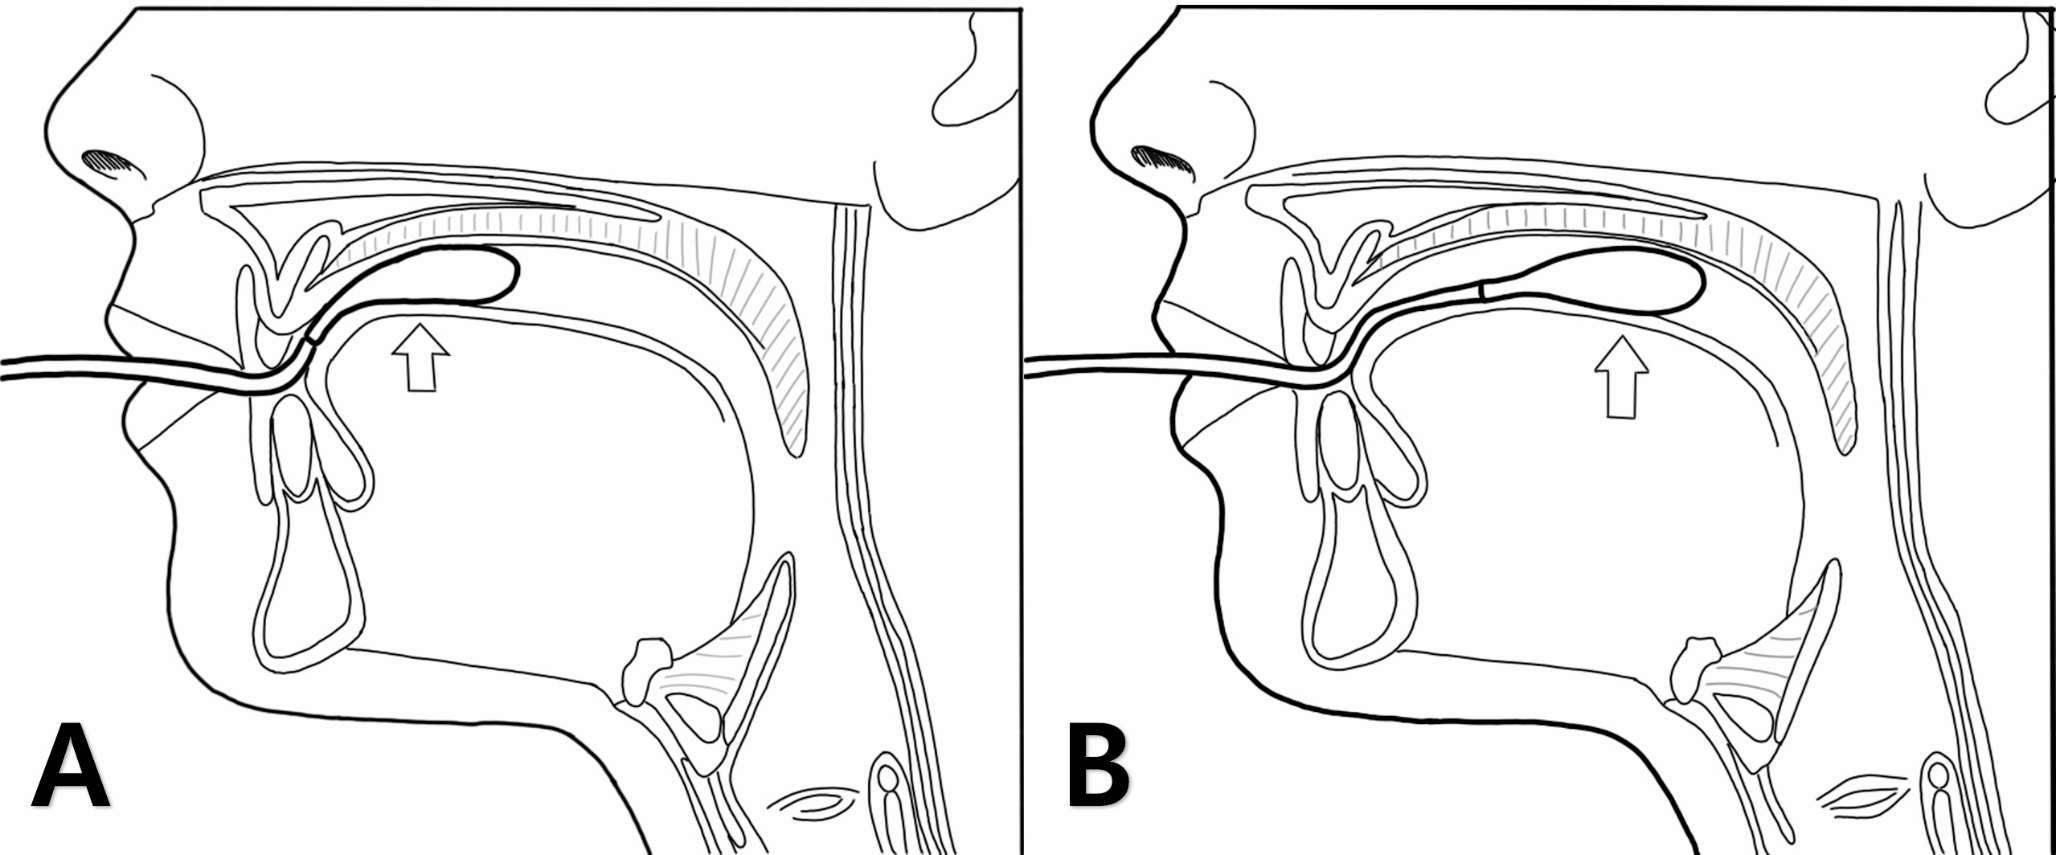
The two instructors who acquired vacuum swallowing taught the swallowing technique to the remaining 12 participants. First, they explained the mechanism of the swallowing method for approximately 20 min using a video portraying vacuum swallowing. The video included the VF findings and HRM’s topography in vacuum swallowing. Table 1; Fig. 1 present the instructions on vacuum swallowing. Furthermore, a video for instruction is provided in Online Resource 1.
Table 1 Instructions for vacuum swallowing (referring to Online Resource 1)Fig. 1
Procedure for the instruction of vacuum swallowing. After explaining the mechanism behind vacuum swallowing, two points need to be instructed: First, how to create subatmospheric negative pressure in the thoracic cavity; second, the ideal timing of swallowing and inspiratory effort. The depression of the neck indicates the generation of strong negative pressure in the thoracic cavity
Swallowing Monitoring System and Analysis MethodsWe used an SBMS to evaluate its safety using respiratory flow, laryngeal motion, and swallowing sound [22, 24, 25]. The monitoring system comprises a nasal cannula-type flow sensor, a film-type piezoelectric sensor, and signal processing units. The laryngeal motion and the absence of respirator flow indicated swallows. Using a series of respiratory flow, the laryngeal motion, and sound data, the piezoelectric sensor has a wide dynamic range (0–4 kHz), which ensures the capture of both the laryngeal motion and sound. Swallowing periods are extracted semi-automatically with an algorithm using the respiratory flow, the swallowing sound, and the laryngeal motion [25]. We evaluated breathing–swallowing coordination and respiratory pause during swallowing. Figure 2 shows an example of a breathing–swallowing coordination analyzed by this system. Swallowing typically occurs during expiration, and the subsequent respiration re-initiates with expiration [23,24,25]. The expiration-swallow-expiration (E-SW and SW-E) pattern is usual. Vacuum swallowing creates a subatmospheric negative pressure in the thoracic cavity through inspiratory effort; therefore, the risk of aspiration might be high. The E-SW/SW-E patterns are useful to prevent the pharyngeal residues from invading the lower airway [24]. However, two unusual patterns (I-SW and SW-I) may also occur in healthy individuals [24, 25], and their occurrence (I-SW and/or SW-I) may indicate breathing-swallowing discoordination. The frequency of I-SW and SW-I patterns increases with age in patients with stroke, head-neck cancer after treatment, Parkinson’s disease, and chronic obstructive pulmonary disease [25]. Although these patterns are observed even in healthy individuals, the identification of a high I-SW/SW-I rate and the appropriate treatment to reduce it may prevent aspiration pneumonia [25]. We used water for test foods. The participants were upright, sitting on a chair, and voluntarily swallowed approximately 3 mL water from a 10-mL syringe three times during each normal and vacuum swallowing. These swallowing and respiratory patterns were identified using automatic calculations.
Fig. 2
Coordination between breathing and swallowing. Swallowing occurs during expiration, and respiration resumes with expiration (a: E–SW–E pattern). Swallowing is immediately followed by inspiration, and expiration occurs after swallowing (b: I-SW-E pattern). The values on the y-axis were analog-digital converted values of biological signals obtained from respiration and laryngeal elevation
E–SW–E, expiration–swallow–expiration; I-SW-E, inspiration-swallowing-expiration
Data CollectionHRM data were analyzed using the ManoView analysis software (Star Medical, Tokyo, Japan). The minimum esophageal pressure (Pmin) and the maximum pressure (Pmax) of the LES were measured during swallowing (Fig. 3). First, the UES opening time during swallowing was used as the range of analysis on the time axis. Subsequently, the Pmin during swallowing was assessed within the analysis range defined between the upper and lower ends as the UES and LES, respectively. Regarding the Pmax during swallowing, it was analyzed at the resting LES level. During vacuum swallowing, Pmax was evaluated, including the high-pressure zone of the LES. The participants performed vacuum and normal swallowing with 5 mL of water five times each. Visual feedback was also provided using the HRM topography to enable the participants to match the timings of swallowing with that of the LES contraction. Successful vacuum swallowing was defined as when the HRM topography simultaneously generated a strong esophageal negative pressure with swallowing.
Fig. 3
Pressure topography of healthy participants using high-resolution manometry. The subatmospheric pressure in the esophagus was defined as the minimum pressure between the UES and the LES when the UES opened due to swallowing. The maximum pressure of the LES was defined as the LES pressure during swallowing. Vacuum swallowing (right) is characterized by creating subatmospheric negative pressure in the esophageal body and constriction of LES.
LES, lower esophageal sphincter; UES, upper esophageal sphincter
Statistical AnalysisThe distribution of all continuous variables was assessed using the Shapiro–Wilk test. Comparisons with and without vacuum swallowing were conducted using the paired t-test and Wilcoxon signed-rank test for normally and non-normally distributed continuous variables, respectively. The collected data were compared between normal and vacuum swallowing using paired t-tests. Furthermore, the critical value for rejecting the null hypothesis was P < 0.05. All statistical analyses were performed using IBM SPSS Statistics for Windows, version 22.0 (IBM Japan Corp., Tokyo, Japan).
留言 (0)