
記住我


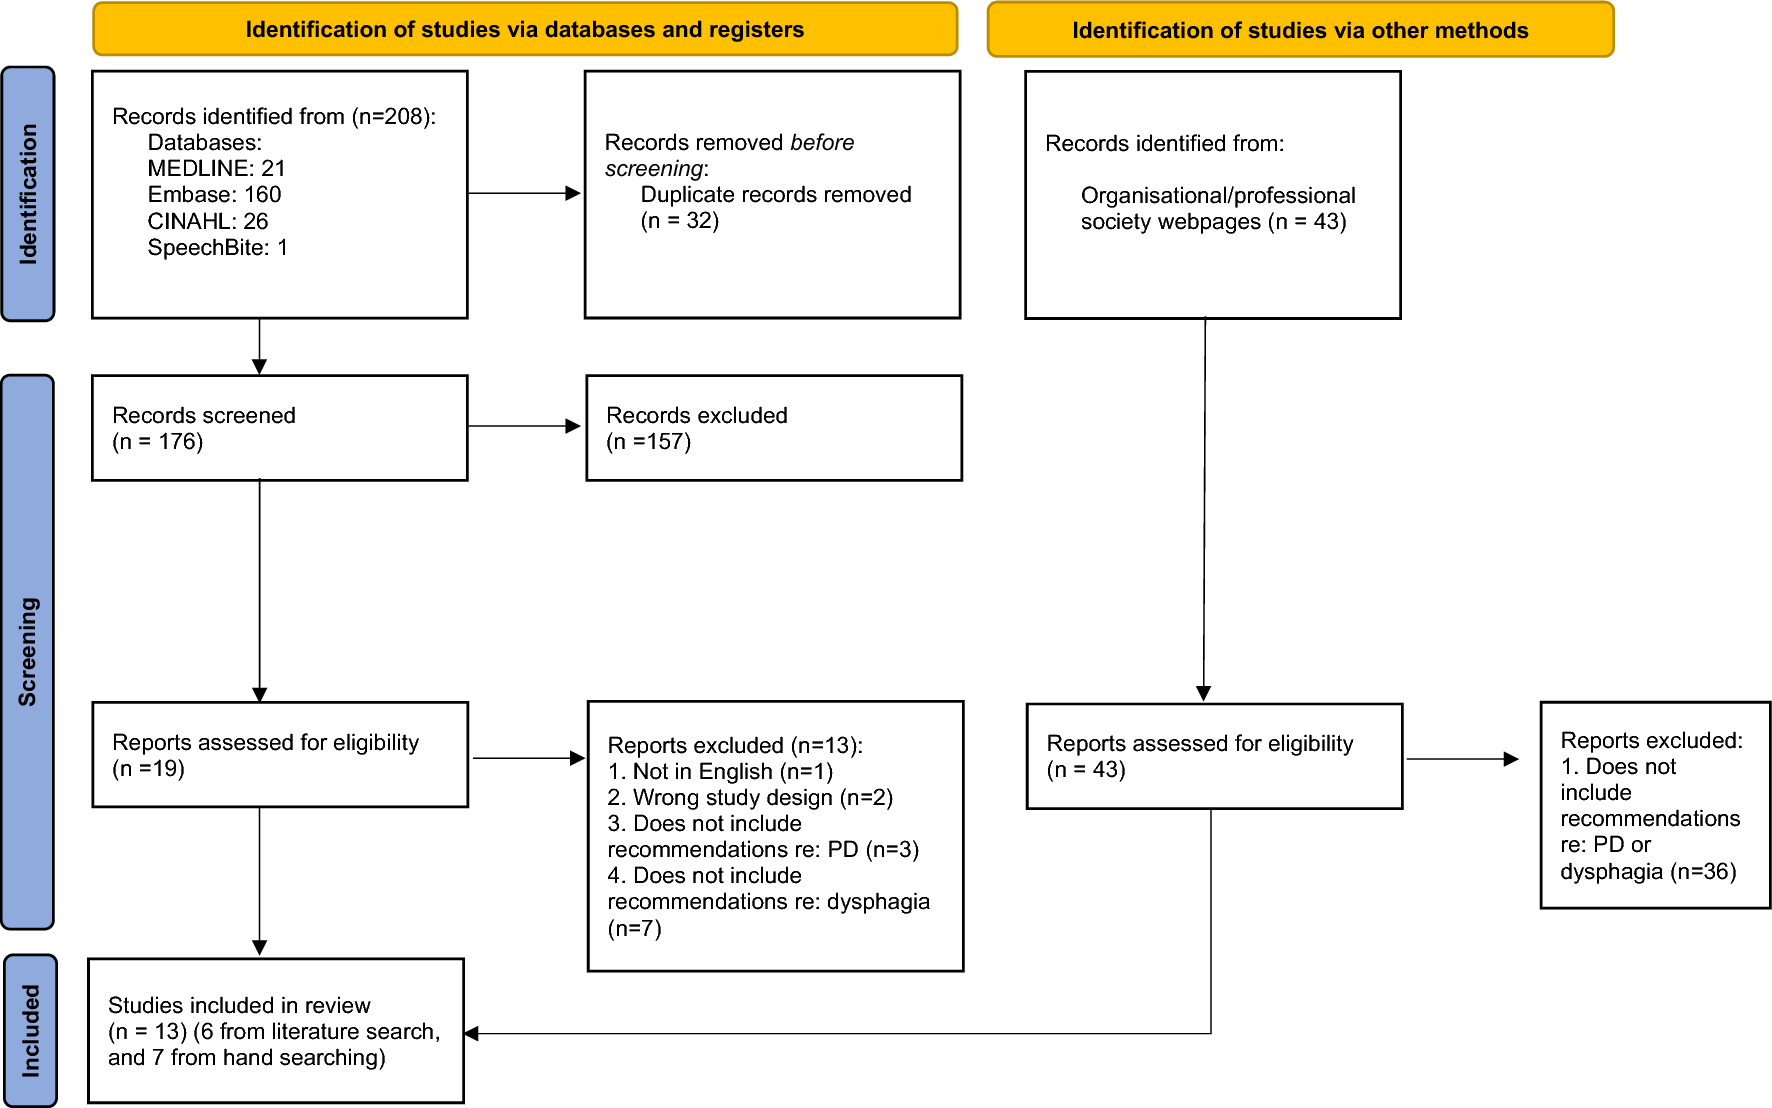


Recruitment was open from June 2021 to August 2022. Eighty-seven participants were enrolled in the study. Three participants did not complete the protocol and were not included in the final data analyses. Reasons for withdrawal included two participants not returning for scheduled study visits and one participant having schedule conflicts for continued participation. A CONSORT flow diagram is provided in Fig. 1. The final dataset included eighty-four participants (60 female), with a mean age of 64 years (range: 55–82 years). Other participant demographics are presented by group in Table 1. Oral pressure changes pre- and post-treatment have been reported previously [26] and will not be repeated here.
Fig. 1
CONSORT diagram showing the flow of participants through each stage of a randomized trial
Accuracy Measures and Effect of Biofeedback and Exercise IntensityRetention (from instruction two weeks prior) accuracy data was collected from 84 participants, with complete datasets across four visits for 75 participants. Mean retention accuracy was 5.8 ± 4.8 kPa across groups (range: 0.01–28.5 kPa), meaning that upon return two weeks after training, participants were, on average, approximately 6 kPa above or below their target pressure. Mean retention accuracy was statistically significantly improved for participants using biofeedback (5.1 ± 2.9) than those without (6.7 ± 2.8), U = 527.0, z = −3.2, adj p = 0.01, effect size r = 0.35 (lower scores indicate closer to target pressure). Mean retention accuracy was also improved for participants with maximum intensity exercise (5.1 ± 2.7) compared to submaximal exercise (6.7 ± 3.0), U = 1190.0, z = 2.8, adj p = 0.03, effect size r = 0.31. Using Cohen’s definitions, these reflect medium effect sizes [37].
Training (during session) accuracy was collected from 84 participants, with complete datasets across four visits for 77 participants. Mean training accuracy across groups was 96.4% ± 7.6%, meaning that on average, 96% of participants’ practice pushes were within the target range. Mean training length was 10.2 ± 8.4 pushes, indicating that it required 10 pushes to establish competency to the exercise (defined as eight consecutive pushes within the acceptable range). Training pushes were, on average, 4.0 ± 1.9 kPa above or below the target pressure. Mean training accuracy did not differ between participants using biofeedback (10.3 ± 8.4) than those without (9.9 ± 2.8), U = 654.0, z = −2.1, adj p = 0.17, effect size r = 0.23. This indicates a small to medium effect size. However, training accuracy was improved for participants with maximum intensity exercise (8.9 ± 2.0) compared to submaximal exercise (11.4 ± 8.3), U = 1333.0, z = 4.22, adj p = 0.005, effect size r = 0.46 (lower scores indicate less training required to achieve exercise competency). This reflects a medium to large effect size.
Self-reported HEP accuracy (meeting the pressure target) from 40 participants was collected from participants in the biofeedback groups who received immediate feedback on their TSE performance at home. Complete datasets across all eight weeks of HEP were available for 35 participants. The mean HEP accuracy was 95.5% ± 8.1%, meaning that 95% of HEP pushes fell within the target range. HEP accuracy was statistically significantly improved for participants completing maximum intensity exercise 97.4 ± 4.7) compared to those completing submaximal exercise (93.8 ± 5.1), U = 83.0, z = −3.2, adj p = 0.005, effect size r = 0.51. This indicates a large effect size.
Predictors of Oral Pressure ChangeA complete dataset for oral pressure changes from baseline to the end of the study for 84 participants was included. A backward linear regression was run to predict oral pressure outcomes from participant confidence, motivation, adherence to the program, training accuracy, HEP accuracy, and retention. Sex and age were included in the model. There was linearity and heteroscedasticity, as assessed by studentized residuals plotted against the predicted values. There was no evidence of multicollinearity, as assessed by tolerance values greater than 0.1. The assumption of normality was not met. The final backward regression model revealed that none of the models that included accuracy measures were better at predicting oral pressure outcomes than the model that included age alone. Of the included variables, age was the only predictor of oral pressure change for healthy participants (β = -0.41, SE = 0.11, p = 0.002). There was a weak negative correlation between age and oral pressure change (rs = −0.35). Accuracy measures, adherence, confidence, motivation, and sex did not significantly impact tongue strength gains in our model. The final regression model accounted for 8% of the variance in oral pressure change, as indicated by the adjusted R-squared value. The model’s F-statistic was statistically significant (F(1, 83) = 7.9, p < 0.01), suggesting that the predictor, age, explained a significant proportion of the variance in oral pressure change. The 95% bootstrap confidence interval for the β of age was (-0.64, -0.22). The fitted regression model was Y = 34.97 + [−0.41] * age.
Predictors of Participant ConfidenceConfidence measures were gathered for 84 participants with complete data sets across all visits for 73 participants. Mean confidence across visits was 84 ± 15.8 (out of 100).
A backward linear regression was run to predict participant confidence from adherence to the program, training accuracy, HEP accuracy, retention, biofeedback, exercise intensity, sex, and age. There was linearity and heteroscedasticity, as assessed by studentized residuals plotted against the predicted values. There was no evidence of multicollinearity, as assessed by tolerance values greater than 0.1. The assumption of normality was not met. The final backward regression model revealed that training accuracy (β = −0.46, SE = 0.38, p < 0.05) was the strongest and only predictor of participant confidence. Retention accuracy, HEP accuracy, biofeedback, exercise intensity, adherence, age, and sex were not found to have a significant impact on participant confidence in our model. The final regression model accounted for 4.5% of the variance in confidence, as indicated by the adjusted R-squared value. The model’s F-statistic was statistically significant (F(1, 83) = 4.9, p < 0.05), suggesting that the predictor, training accuracy, explained a significant proportion of the variance in participant confidence. The 95% bootstrap confidence interval for the β of training accuracy was (-1.4, -0.35). The fitted regression model was Y = 89.3 + [−0.46] * training accuracy.
Predictors of Participant MotivationMotivation measures were available from 84 participants with complete datasets across all visits for 74 participants. Mean motivation was 90 ± 12 (out of 100).
A backward linear regression was run to predict participant motivation from adherence to the program, training accuracy, HEP accuracy, biofeedback, exercise intensity, sex, and age. There was linearity and heteroscedasticity, as assessed by studentized residuals plotted against the predicted values. There was no evidence of multicollinearity, as assessed by tolerance values greater than 0.1. The assumption of normality was not met. There were no significant predictors of participant motivation within the tested variables. The final model included adherence (β = 0.15, SE = 0.09, BCa 95% CI (−0.033, 0.29), p > 0.05), which did not significantly explain the variance in participant motivation (F(1, 80) = 1.98, p > 0.05).
Predictors of Adherence to the Exercise ProgramComplete or partial adherence (completion of requested repetitions) data was collected across the 84 participants. Mean adherence was 97.0% ± 10.6%.
A backward linear regression was run to predict adherence to the exercise program from training accuracy, HEP accuracy, retention, biofeedback, exercise intensity, sex, and age. There was linearity and homoscedasticity, as assessed by studentized residuals plotted against the predicted values. There was no evidence of multicollinearity, as assessed by tolerance values greater than 0.1. The assumption of normality was not met. The backward regression model indicated that predictors of adherence included biofeedback (β = −5.2, SE = 2.2, p < 0.05), age (β = 0.29, SE = 0.15, p = 0.05), and training accuracy (β = 0.43, SE = 0.23, p < 0.01). Retention accuracy, HEP accuracy, exercise intensity, and sex were not found to have a significant impact on adherence in the model. However, examination of the bootstrap bias-corrected and accelerated 95% confidence intervals for training accuracy (-0.16, 0.74) and age (-0.08, 0.64) indicated that they were not significant predictors within the model but were independent predictors of adherence (Table 3). Examination of adherence means by biofeedback indicated that participants who completed their program without biofeedback had a mean adherence of 100.0% (BCa 95% CI (97.1, 103.1)) and participants with biofeedback had a mean adherence of 93.9% (BCa 95% CI (90.4, 97.1)).
Table 3 Simple regression results for adherence to the exercise program for predictors in the final model
留言 (0)