
記住我
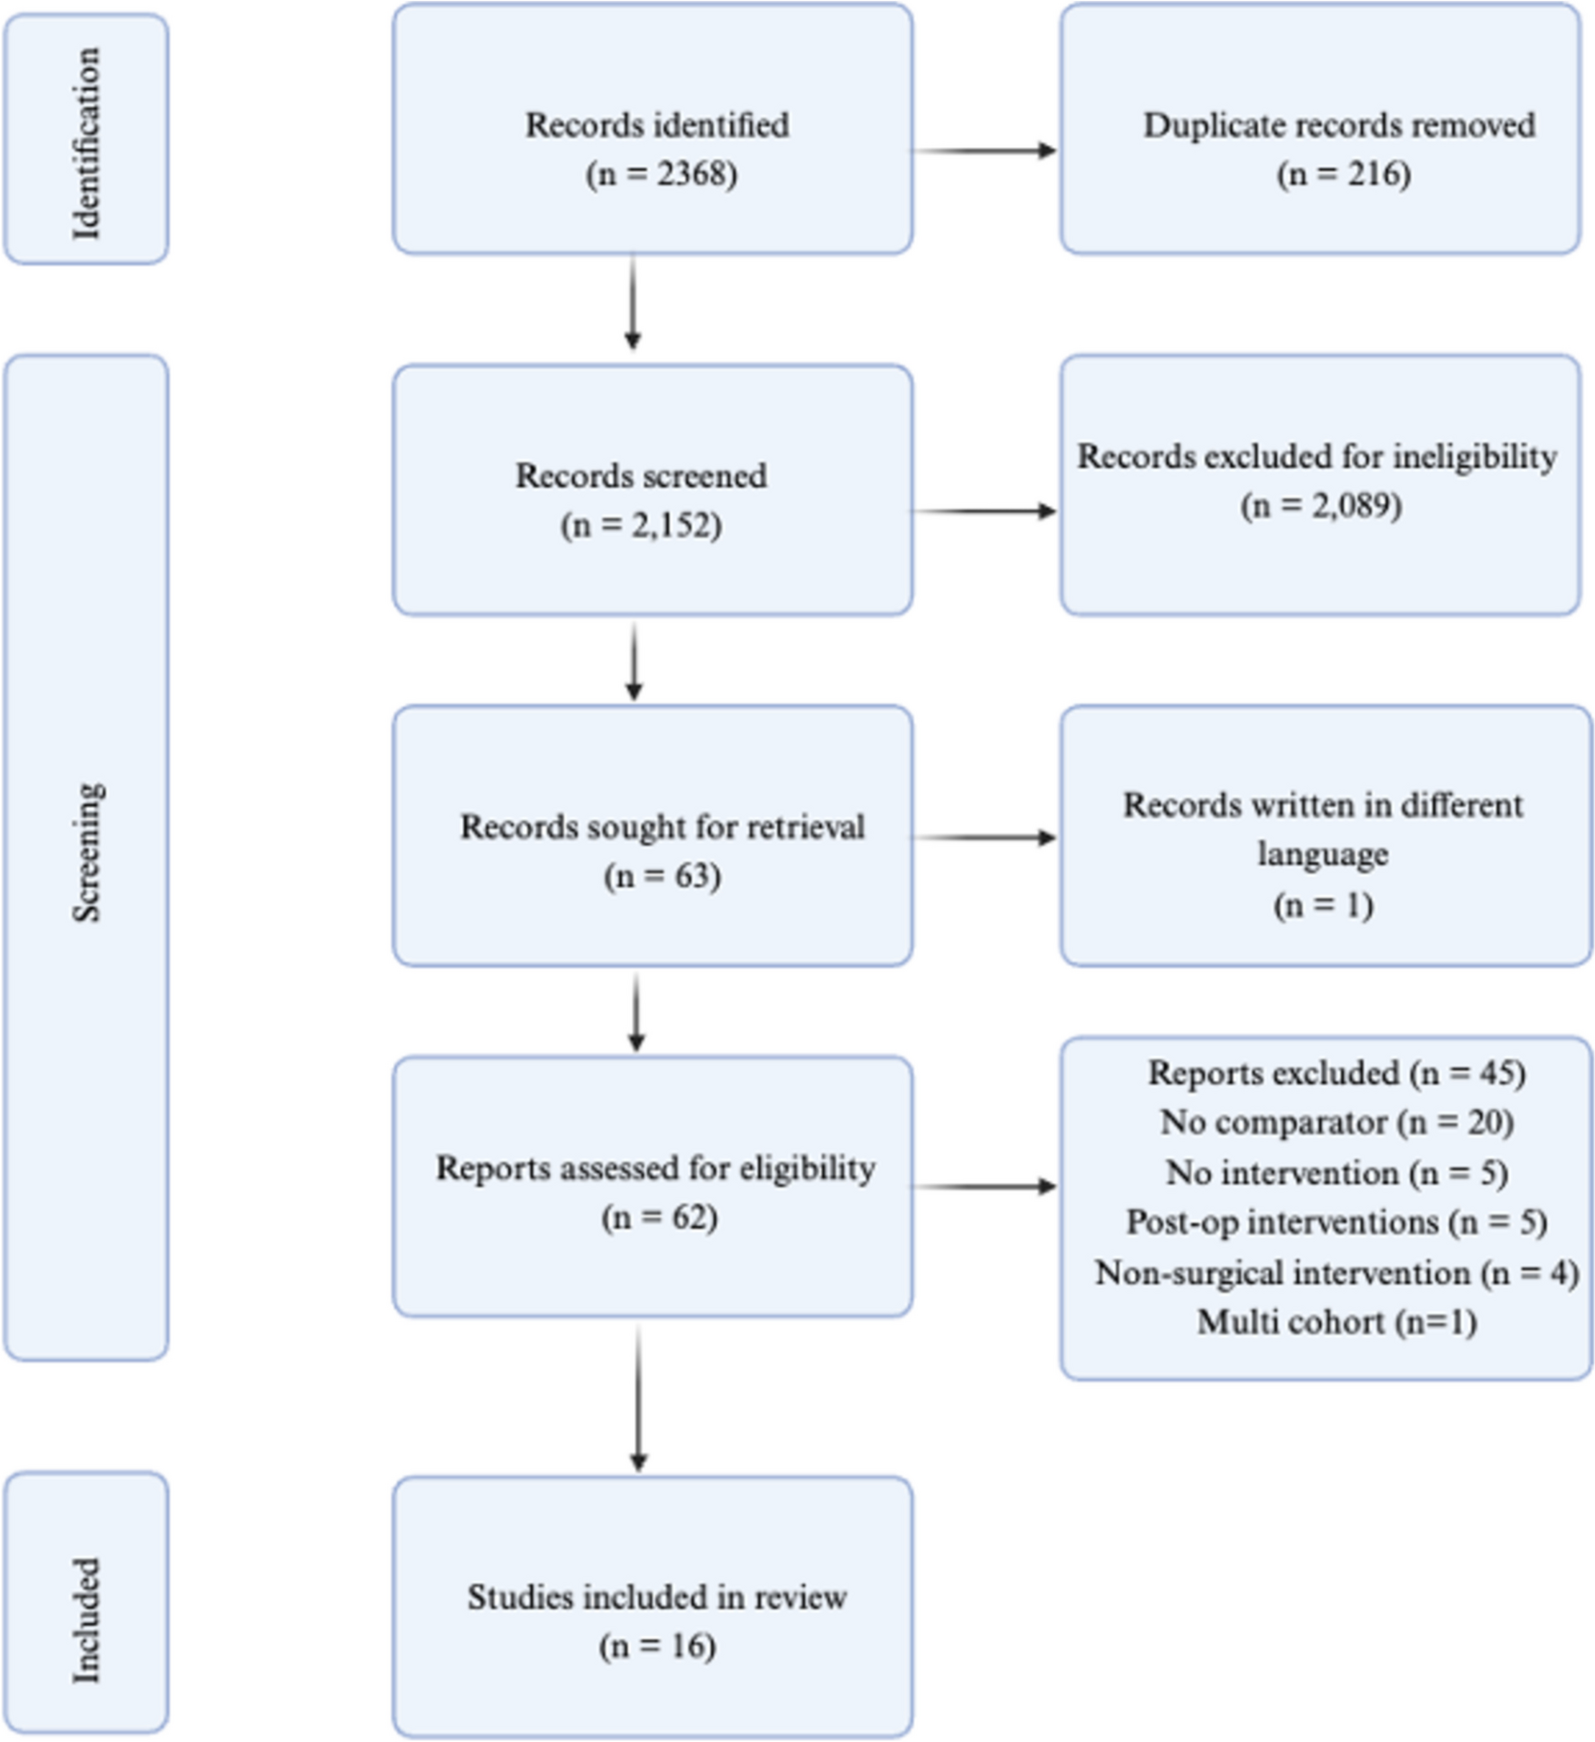


Our search resulted in a total of 4506 records; after the duplicates were removed, 1918 records entered the process of title and abstract screening. Twenty-six articles were eligible for the full-text screening, and finally, seven studies (Jaafar et al. 2020; Regimbeau et al. 2014; Braak et al. 2022; Park et al. 2023; Kim et al. 2017; Loozen et al. 2017; Santibañes et al. 2018) were available to enter our meta-analysis. The selection process of the included studies is shown in Fig. 1.
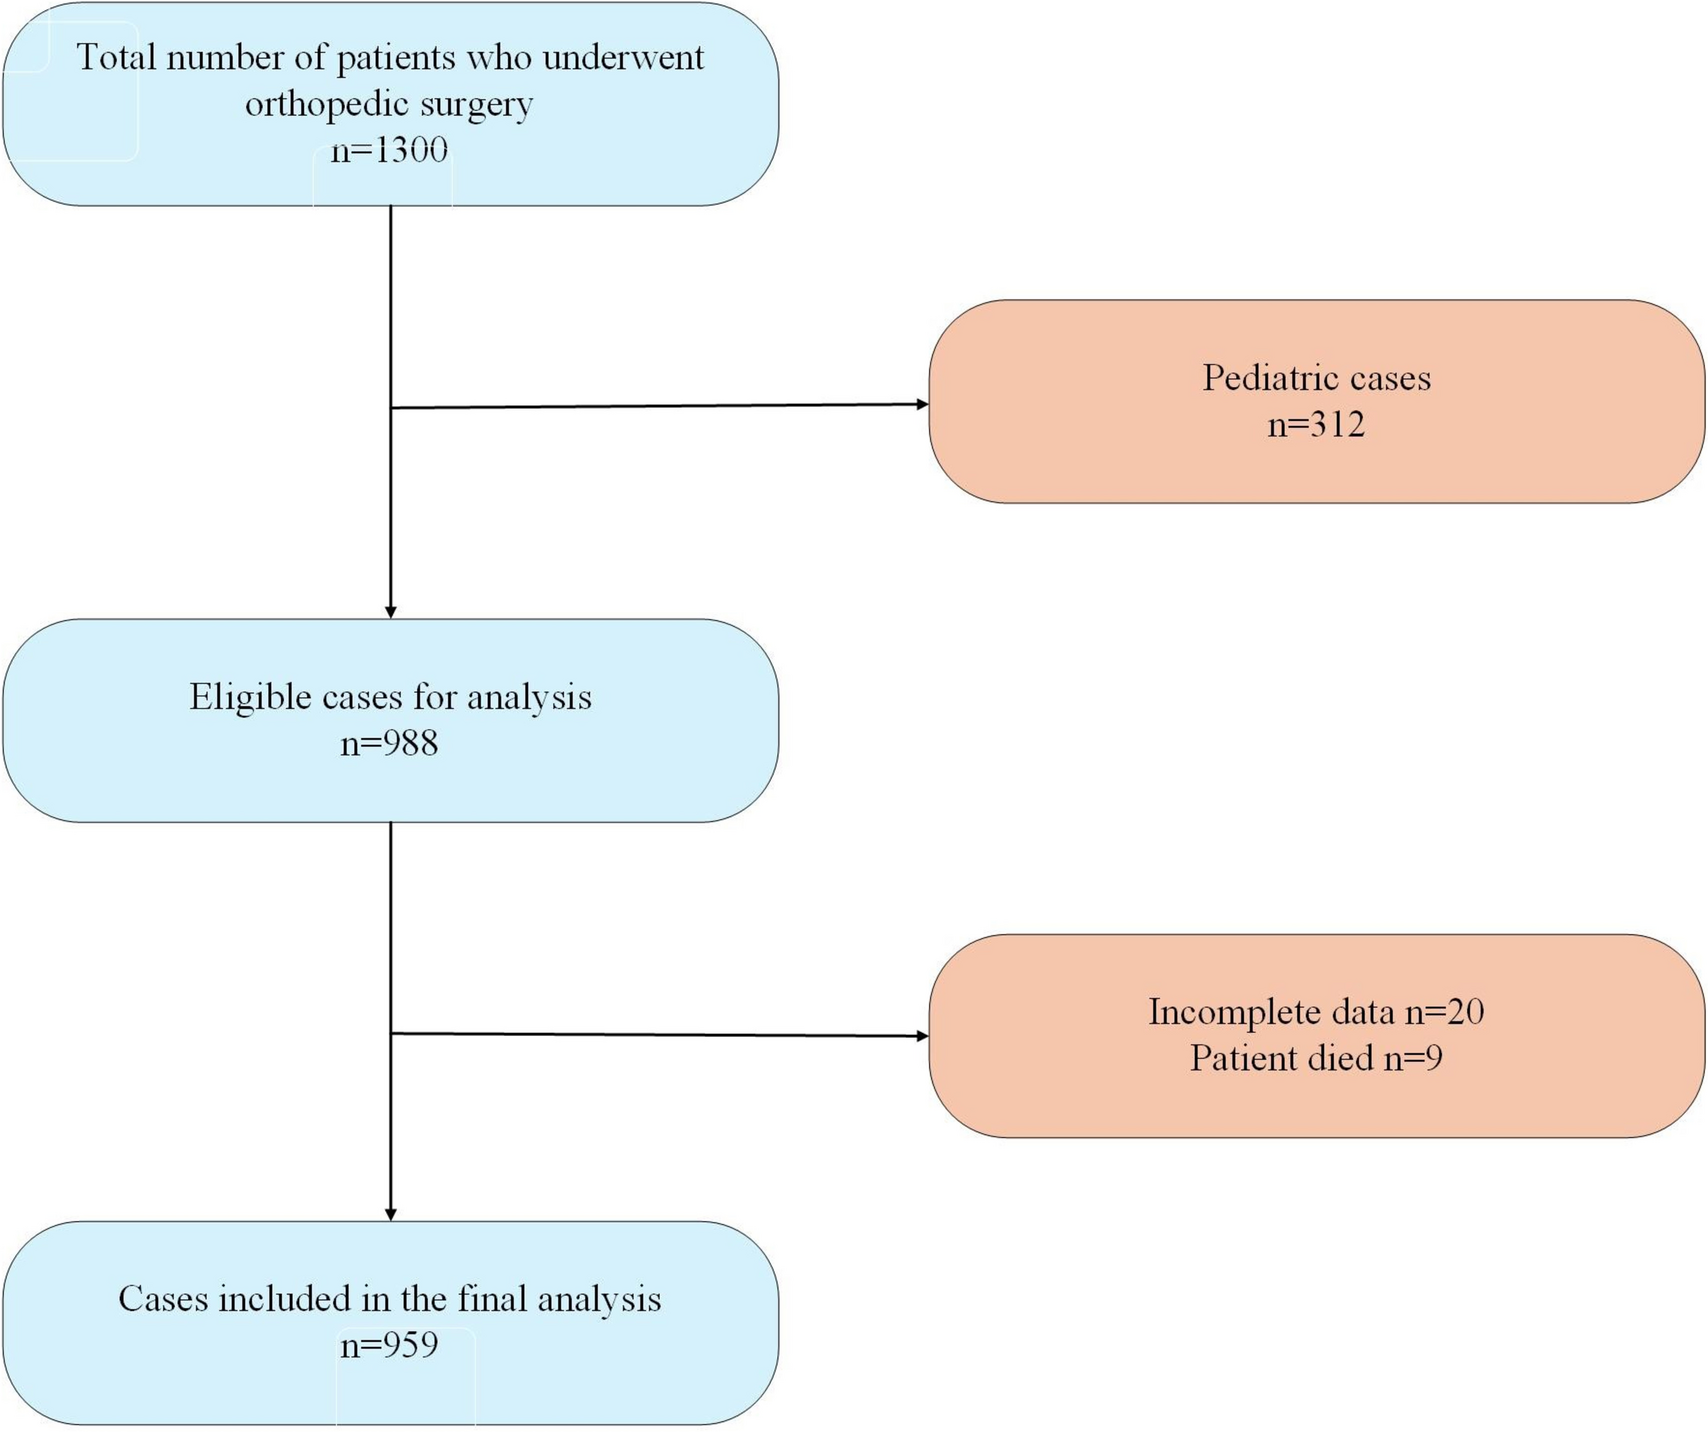
Fig. 1
PRISMA flow diagram of the included studies
Characteristics of the included studiesOut of the seven studies, two were conducted in South Korea (Park et al. 2023; Kim et al. 2017), two in the Netherlands (Braak et al. 2022; Loozen et al. 2017), and one in Argentina (Santibañes et al. 2018), France (Regimbeau et al. 2014), and Sweden (Jaafar et al. 2020). These studies encompassed a time frame spanning from 2009 to 2021 and had a collective sample size of 1747 patients. Of these patients, 866 were administered antibiotics, while the remaining 881 patients constituted the control group. All included patients had mild to moderate AC. Laparoscopic cholecystectomy (LC) was the surgical technique employed in all of the studies included in the analysis. Regimbeau et al. (2014) utilized open cholecystectomy in 6.8% (14 patients) in the antibiotic group and 5.3% (11 patients) in the control group. Jaafar et al. (2020) included four patients who were initially scheduled to have LC; nevertheless, as a result of technical concerns, the surgeon decided to do an open surgical procedure instead. The summary of included studies and baseline characteristics are reported in Tables 2, and 3.
Table 2 Summary of the included studiesTable 3 Baseline characteristics of the included studiesRisk of bias assessment resultsAccording to ROB2 (2023), four studies showed a low risk of bias (Braak et al. 2022; Park et al. 2023; Kim et al. 2017; Santibañes et al. 2018), while three showed a high risk (Jaafar et al. 2020; Regimbeau et al. 2014; Loozen et al. 2017). Jaffar et al. (2020) did not report some of the secondary outcomes as planned in their protocol, which introduces a significant risk of reporting bias. Loozen et al. (2017) had concerns regarding the randomization process; neither the patients nor the investigators were blinded to the allocation process. Furthermore, the study conducted by Regimbeau et al. (2014) revealed a higher proportion of patients with diabetes mellitus in the treatment group (27%) compared to the control group (13%). This discrepancy raises concerns regarding potential biased allocation and divergence from the planned study arm. The quality assessment of the included studies is shown in Fig. 2.
Fig. 2
Risk of bias assessment of the included studies according to Cochrane risk of bias assessment tool 2
Postoperative infectious complicationsOur analysis resulted in no significant difference regarding total PIC (RR = 0.84 with 95% CI (0.63, 1.12), P = 0.23) (I2 = 0%, P = 0.67), preoperatively administered antibiotics (RR = 0.69 with 95% CI (0.45, 1.08), P = 0.10) (I2 = 8%, P = 0.34), and postoperatively administered antibiotics (RR = 0.96 with 95% CI (0.66, 1.40), P = 0.85) (I2 = 0%, P = 0.88), as shown in Fig. 3.
Fig. 3
Forest plot of total postoperative infectious complications
Surgical site infectionThere were no significant differences regarding total SSI (RR = 0.79 with 95% CI (0.56, 1.12), P = 0.19) (I2 = 0%, P = 0.44), preoperatively administered antibiotics (RR = 0.66 with 95% CI (0.27, 1.59), P = 0.06) (I2 = 63%, P = 0.10), and postoperatively administered antibiotics (RR = 0.98 with 95% CI (0.61, 1.56), P = 0.23) (I2 = 0%, P = 0.96), as shown in Fig. 4A. Also, there were no significant differences in each type of SSI: superficial SSI (RR = 0.97 with 95% CI (0.58, 1.64), P = 0.92) (I2 = 0%, P = 0.53), preoperatively administered antibiotics (RR = 0.73 with 95% CI (0.36, 1.48, P = 0.38) (I2 = 0%, P = 0.44), and postoperatively administered antibiotics (RR = 1.37 with 95% CI (0.64, 2.94), P = 0.42) (I2 = 0%, P = 0.68), as shown in Fig. 4B; deep SSI (RR = 0.38 with 95% CI (0.09, 1.52), P = 0.17) (I2 = 0%, P = 0.52), preoperatively administered antibiotics (RR = 0.17 with 95% CI (0.02, 1.40), P = 0.10) (I2 = 0%, P = 0.89), and postoperatively administered antibiotics (RR = 0.70 with 95% CI (0.11, 4.40), P = 0.70) (I2 = 19%, P = 0.27), as shown in Fig. 4C; organ and/or space SSI (RR = 0.64 with 95% CI (0.32, 1.26), P = 0.20) (I2 = 10%, P = 0.34), preoperatively administered antibiotics (RR = 1.19 with 95% CI (0.09, 15.94), P = 0.89) (I2 = 67%, P = 0.08), and postoperatively administered antibiotics (RR = 0.69 with 95% CI (0.29, 1.62), P = 0.39) (I2 = 0%, P = 0.65), as shown in Fig. 4D.
Fig. 4
Forest plot of surgical site infections. a Total surgical site infections; b superficial surgical site infection; c deep surgical site infection; d organ and/or space surgical site infection
Distant infectionsWe found no significant difference in the total number of postoperative distant infections (RR = 1.01 with 95% CI (0.55, 1.88), P = 0.97) (I2 = 0%, P = 0.72) (I2 = 0%, P = 0.72), preoperatively administered antibiotics (RR = 3.68 with 95% CI (0.61, 22.28), P = 0.16) (I2 = 0%, P = 0.87), and postoperatively administered antibiotics (RR = 0.85 with 95% CI (0.44, 1.65), P = 0.64) (I2 = 0%, P = 0.89), as shown in Fig. 5A. Similarly, there were no significant differences in pneumonia (RR = 0.55 with 95% CI (0.17, 1.80), P = 0.33) (I2 = 0%, P = 0.64), preoperatively administered antibiotics (RR = 1.61 with 95% CI (0.20, 12.98), P = 0.66) (I2 = 0%, P = 0.63), and postoperatively administered antibiotics (RR = 0.34 with 95% CI (0.08, 1.41), P = 0.14) (I2 = 0%, P = 0.96), as shown in Fig. 5B. Our analysis did not show any significant difference in UTI (RR = 0.81 with 95% CI (0.25, 2.64), P = 0.73) (I2 = 0%, P = 0.59), preoperatively administered antibiotics (RR = 3.07 with 95% CI (0.13, 74.87), P = 0.49) and postoperatively administered antibiotics (RR = 0.66 with 95% CI (0.19, 2.34), P = 0.52) (I2 = 0%, P = 0.56), as shown in Fig. 5C.
Fig. 5
Forest plot of postoperative distant infections. a Total number of postoperative distant infections; b pneumonia; c urinary tract infection
Non-infectious complicationsOur analysis indicated that there were no significant differences in the overall incidence of postoperative non-infectious complications (RR = 0.84 with 95% CI (0.64, 1.11), P = 0.22) (I2 = 0%, P = 0.61), preoperatively administered antibiotics (RR = 0.85 with 95% CI (0.61, 1.17), P = 0.31) (I2 = 0%, P = 0.32), and postoperatively administered antibiotics (RR = 0.82 with 95% CI (0.46, 1.47), P = 0.51), (I2 = 0%, P = 0.46), as shown in Fig. 6A.
Fig. 6
Forest plots of noninfectious morbidity and mortality. a The overall incidence of postoperative non-infectious complications; b mortality; c readmission; d operation time (minutes); e length of hospital stay (days)
We found no significant difference in mortality (RR = 0.34 with 95% CI (0.04, 3.23), P = 0.35) (I2 = 0%, P = 0.99), preoperatively administered antibiotics (RR = 0.34 with 95% CI (0.01, 8.32), P = 0.51), and postoperatively administered antibiotics (RR = 0.33 with 95% CI (0.01, 8.14), P = 0.50), as shown in Fig. 6B.
The pooled result of the meta-analysis showed comparable readmission rates in both groups (RR = 0.69 with 95% CI (0.43, 1.11), P = 0.13) (I2 = 0%, P = 0.92), preoperatively administered antibiotics (RR = 0.57 with 95% CI (0.30, 1.07), P = 0.08) (I2 = 0%, P = 0.89), and postoperatively administered antibiotics (RR = 0.88 with 95% CI (0.44, 1.78), P = 0.72) (I2 = 0%, P = 0.94), as shown in Fig. 6C.
Operation time showed no change with either group (MD = 0.98 min with 95% CI (-1.49, 3.45), P = 0.44) (I2 = 0%, P = 0.46), preoperatively administered antibiotics (MD = -0.80 min with 95% CI (-4.05, 2.46), P = 0.63) (I2 = 16%, P = 0.27), and postoperatively administered antibiotics (MD = 3.40 min with 95% CI (-0.39, 7.20), P = 0.08) (I2 = 0%, P = 0.86), as shown in Fig. 6D.
Our results showed that the length of hospital stay was equal in both groups (MD = 0.89 day with 95% CI (-0.14, 1.92), P = 0.09) (I2 = 98%, P < 0.00001), preoperatively administered antibiotics (MD = 3.67 day with 95% CI (-4.04, 11.37), P = 0.35) (I2 = 90%, P = 0.001), and postoperatively administered antibiotics subgroup (MD = 0.78 day with 95% CI (-0.55, 2.10), P = 0.25) (I2 = 98%, P < 0.00001), as shown in Fig. 6E. Heterogeneity within the postoperatively administered antibiotics were addressed when excluding results of Santibanes et al. (2018) (I2 = 0%, P = 0.32), and the results did not change in this subgroup (MD = 0.21 day with 95% CI (-0.22, 0.48), P = 0.09).
留言 (0)