
記住我
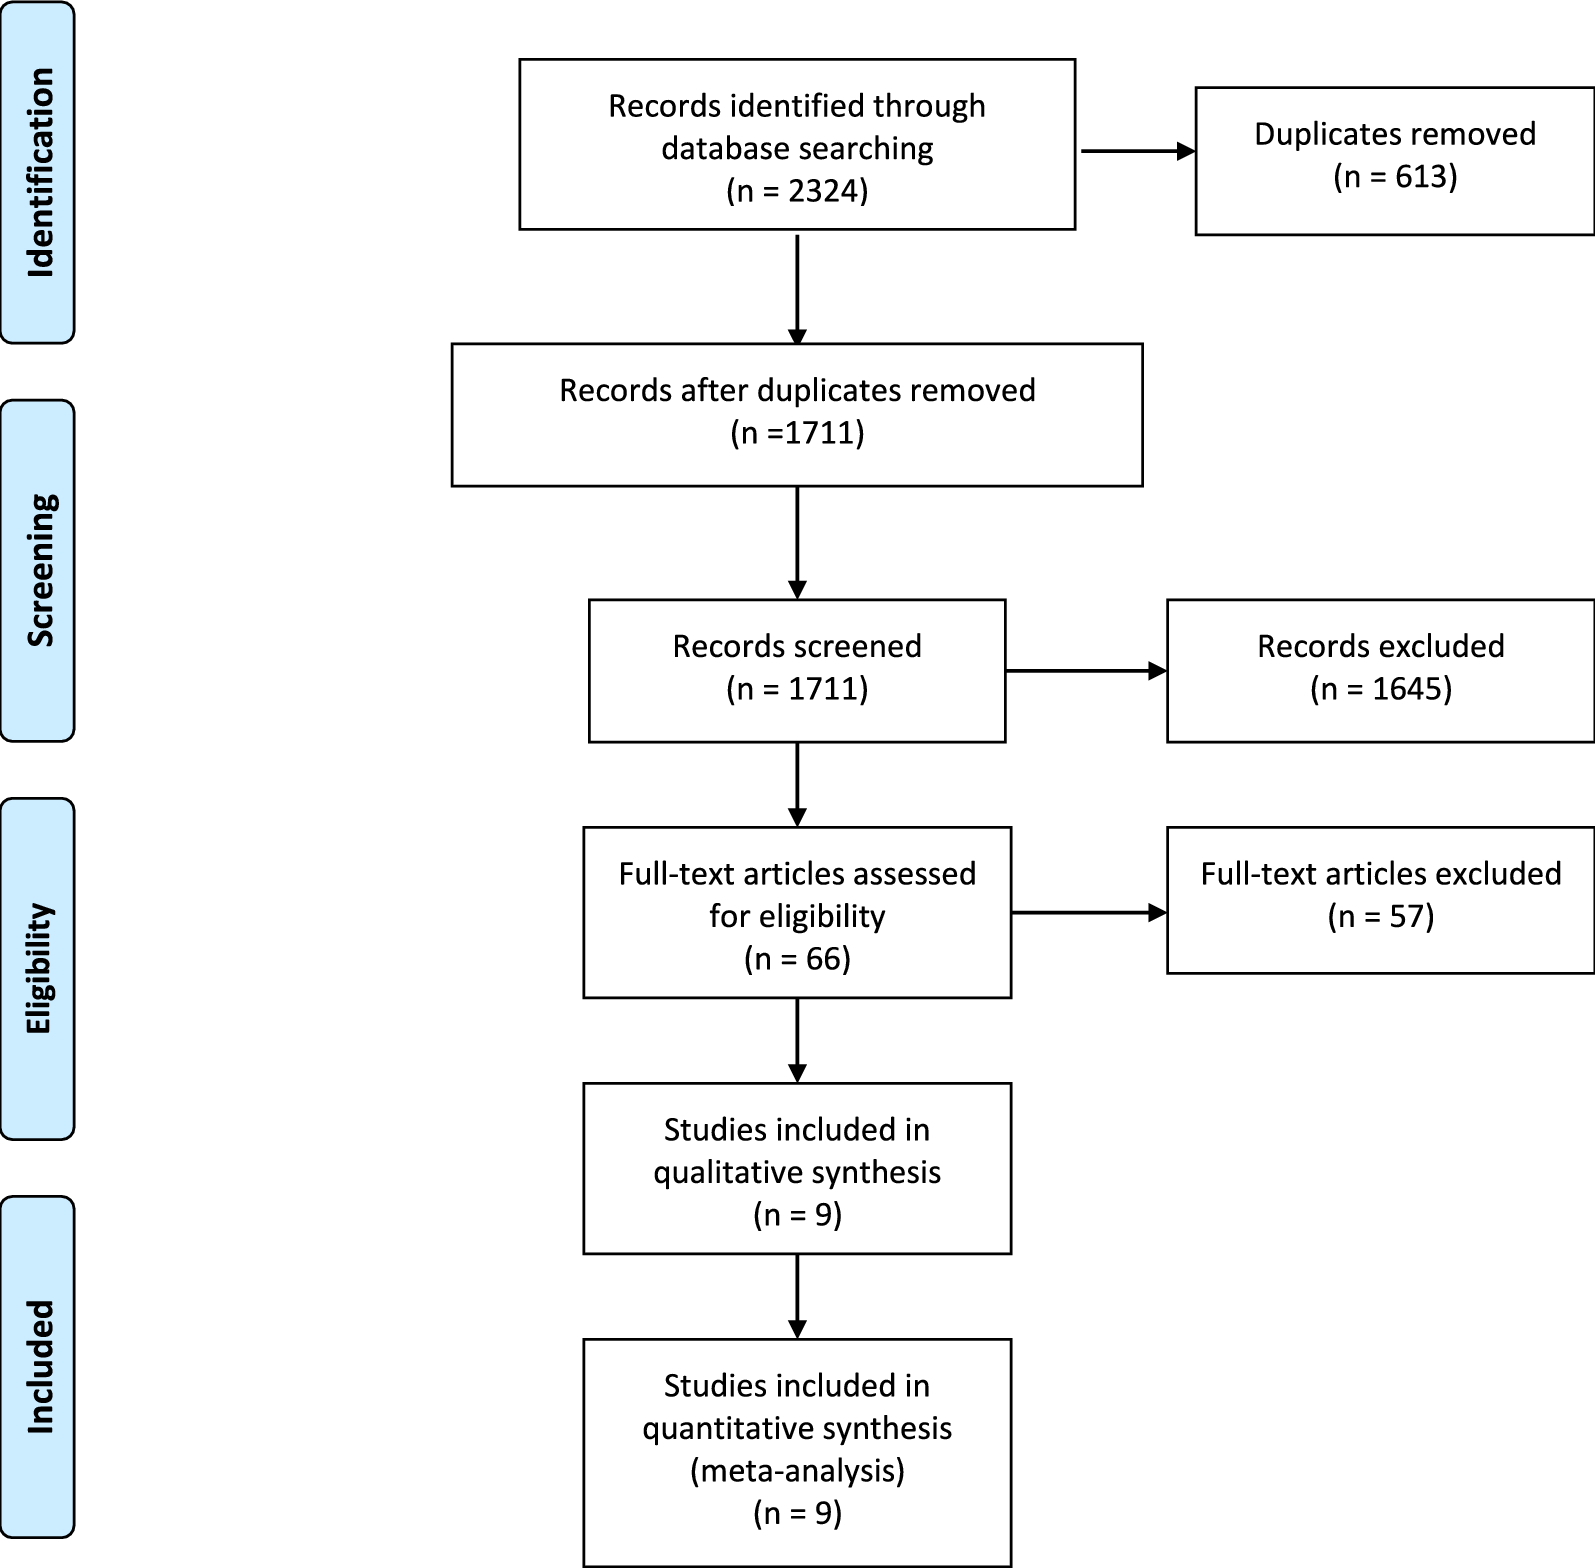


The process of literature retrieval and screening is displayed in detail in Fig. 1. Through systematic literature retrieval, 1,711 related articles were finally obtained from PubMed (n = 342), Embase (n = 644), Cochrane (n = 150) and Web of Science (n = 575). Then 1,033 titles and abstracts of studies were screened after deleting duplicates. Finally, 12 full-text articles were included, concerning 2,863 patients (1,449 RA-TKAs and 1,414 M-TKAs) for pooled analysis [11,12,13, 21,22,23,24,25,26,27,28,29]. Among them, five were RCTs [11, 12, 21,22,23] and seven were cohort studies [13, 24,25,26,27,28,29]. The specific features of all included studies are presented in Table 1. Quality evaluation of eligible cohort studies and RCTs is shown in Table S2 and Fig. 2, respectively.
Fig. 1
Flowchart of the systematic search and selection process
Table 1 Baseline characteristics of the included studiesFig. 2
Risk of bias graph summary for randomized controlled trials
Change of Knee Society ScoreIn the analysis of KSS improvement from preoperative to postoperative stages, the RA-TKA and M-TKA groups exhibited similar changes in KSS scores (WMD: −1.18; 95%CI: −3.41, 1.05: p = 0.30), with significant heterogeneity observed (I2 = 98%, p < 0.00001) (Fig. 3a). The subgroup analysis of > 6-month follow-up duration revealed a significantly lower KSS score in the RA-TKA group compared to the M-TKA group (WMD: −0.61; 95%CI: −0.89, −0.33: p < 0.00001) (Table 2).
Fig. 3
Forest plots of score: a KSS, b WOMAC, c OKS, d ROM, e SF*36, f HSS, g FJS
Table 2 Subgroup analysis of RA-TKA versus M-TKAChange of Western Ontario McMaster Universities Osteoarthritis IndexFive studies reported WOMAC. The pooled analysis indicated that RA-TKA and M-TKA groups demonstrated similar changes in WOMAC scores (MD: 2.32; 95%CI: -4.27, 8.91; p = 0.49), with salient heterogeneity observed (I2 = 98%, p < 0.00001) (Fig. 3b). The subgroup analysis of > 6-month follow-up duration unveiled a significantly lower WOMAC score in the RA-TKA group in contrast to the M-TKA group (WMD: −3.40; 95%CI: −3.72, −3.08; p < 0.00001) (Table 2).
Change of Oxford Knee ScoreOKS was reported in four studies, which unraveled that the RA-TKA and M-TKA groups presented with similar OKS scores (WMD: 5.70; 95% CI: -0.97, 12.37; p = 0.09), with salient heterogeneity found (I2 = 100%, p < 0.00001) (Fig. 3). Sensitivity analysis showed that after excluding the research published by Lincon et al. in 2016 [23], the result changed from insignificant to significant, indicating instability of the index (Fig. 4c). The subgroup analysis of cohort studies, > 6-month follow-up duration, and European population revealed a significantly higher ROM score in the RA-TKA group compared to the M-TKA group (Table 2).
Fig. 4
Sensitivity analysis of a KSS, b WOMAC, c OKS, d ROM, e pain score, f operative duration, g HKA, h FFC, i FTC, j LFC, k LTC
Change of joint range of motionSeven studies reported ROM. The comprehensive analysis suggested a significantly lower ROM score improvement in the RA-TKA group in contrast to the M-TKA group (WMD: −2.84; 95% CI: −3.72, −1.95; p = 0.00001), with significant heterogeneity observed (I2 = 98%, p < 0.00001) (Fig. 3d). Sensitivity analysis uncovered that after excluding the research published by Kim et al. in 2020 [12] or Jin et al. in 2018, the result changed from significant to insignificant, indicating instability of the index (Fig. 4d).
Change of the 36-Item Short Form Health Survey scoreThe primary analysis demonstrated no statistically significant difference in postoperative SF-36 values between the RA-TKA group and the M-TKA group (WMD: −1.47; 95% CI: −4.02, 1.08; p = 0.26) (Fig. 3e), with significant heterogeneity (I2 = 6%, p < 0.30). Subgroup analysis similarly found no statistical difference.
Change of hospital for special surgeryIn the analysis of KSS improvement from preoperative to postoperative stages, the RA-TKA group and the M-TKA group indicated no statistical difference (WMD: −1.06; 95% CI: −3.75, 1.64; p = 0.44) (Fig. 3F) and notable heterogeneity was discovered (I2 = 98%, p < 0.00001).
Forgotten Joint Score (FJS)Six studies reported FJS. The pooled analysis unveiled a significantly higher FJS score in the RA-TKA group in contrast to the M-TKA group (WMD: 5.59; 95% CI: 3.53, 7.66; p < 0.0001) (Fig. 3g), with no significant heterogeneity (I2 = 21%, p = 0.27).
Change of pain scoreFour studies reported pain scores. The comprehensive analysis found no significant difference in pain scores between the RA-TKA and M-TKA groups (WMD: 1.51; 95% CI: -0.34, 3.36; p = 0.11). Sensitivity analysis showed that after excluding the research published by Linkon et al. in 2016, the result changed from insignificant to significant, indicating instability of the index (Fig. 4d).
Patient satisfaction scoreThree studies reported patient satisfaction scores. The pooled analysis showed that the RA-TKA and M-TKA groups exhibited similar patient satisfaction scores (WMD: -0.08; 95% CI: −1.40, 1.24; p = 0.91), with no salient heterogeneity (I2 = 0%, p = 0.82) (Fig. 5b).
Fig. 5
a Pain score, b patients' satisfactory score, c operative duration (min), d intraoperative blood loss (ml)
Operative durationThe operation time was reported in three studies. The comprehensive analysis found that the RA-TKA group exhibited a significantly longer operation time than the M-TKA group (WMD: 25.97; 95% CI: 12.59, 39.34; p = 0.0001), with significant heterogeneity (I2 = 85%, p = 0.001) (Fig. 5c). Sensitivity analysis uncovered that after excluding the research published by Kim et al. in 2020 or Xu et al. in 2022, the result changed from significant to insignificant, indicating instability of the index (Fig. 4f).
Intraoperative blood lossThe comprehensive analysis revealed no statistically significant difference in intraoperative blood loss between the RA-TKA group and the M-TKA group (WMD: −5.53; 95%CI: −1.90, 12.95; p = 0.14), with no salient heterogeneity (I2 = 0%, p = 0.65) (Fig. 5d).
Change of hip-knee-ankle angleHKA was reported in six studies. The comprehensive analysis suggested a significantly superior HKA score improvement in the RA-TKA group than that in the M-TKA group (WMD: 1.10; 95%CI: 0.40, 1.80: p = 0.002), with significant heterogeneity (I2 = 99%, p < 0.00001) (Fig. 6a).
Fig. 6
Radiographic findings: a HKA, b FFC, c FTC, d LFC, e LTC
Frontal femoral component angleFrontal femoral component (FFC) angle was reported in three studies. The comprehensive analysis found no clinical difference in the FFC angle between the RA-TKA group and the M-TKA group (WMD: 0.61; 95%CI: −0.19, 1.42; p = 0.14), with no salient heterogeneity (I2 = 90%, p < 0.0001) (Fig. 6b). Sensitivity analysis indicated that after excluding the research published by Jin et al. in 2018 [26], the result changed from insignificant to significant, indicating instability of the index (Fig. 4h). The subgroup analysis of RCT in a study revealed a significantly higher FFC score in the RA-TKA group compared to the M-TKA group (WMD: 1.01; 95%CI: 0.81, 0.21; p < 0.0001) (Table 2).
Frontal tibia component angleThree studies reported frontal tibia component (FTC) angle. Pooled analysis revealed no meaningful difference in FTC angle between the RA-TKA group FFC and the M-TKA group (WMD: 0.13; 95%CI: -0.99, 1.25; p = 0.82), and there was remarkable heterogeneity (I2 = 93%, p < 0.00001) (Fig. 6c).
Lateral femoral component angleThree studies reported lateral femoral component (LFC) angle. Pooled analysis revealed no significant difference in the LFC angle between the RA-TKA group FFC and the M-TKA group (WMD: −0.80; 95%CI: −3.73, 2.13; p = 0.59), and there was remarkable heterogeneity (I2 = 99%, p < 0.00001) (Fig. 6d). The cohort study subgroup analysis discovered a significantly lower LFC score in the RA-TKA group than in the M-TKA group (WMD: −2.90; 95%CI: −3.42, −2.38; p < 0.00001) (Table 2).
Lateral tibia component angleThree studies reported lateral tibia component (LTC) angle. Pooled analysis found no meaningful difference in LTC score between the RA-TKA group and the M-TKA group (WMD: 0.65; 95%CI: -0.52, 1.81; p = 0.28), and remarkable heterogeneity was noted (I2 = 93%, p < 0.00001) (Fig. 6f). Sensitivity analysis discovered that when the research published by Jin et al. in 2018 [26] was excluded, the result changed from insignificant to significant, indicating that the index was unstable (Fig. 4k). RCT subgroup analysis revealed a significantly higher FFC score in the RA-TKA group than in the M-TKA group (WMD: 1.06; 95%CI: 0.80, 1.31; p < 0.0001) (Table 2).
Publication biasA visual assessment of funnel plots for all outcome measures (Fig. 7) was performed. Outcome measures showing potential publication bias were subjected to Egger’s test. No statistically significant publication bias was observed.
Fig. 7
Funnel plots of a KSS, b WOMAC, c OKS, d ROM, e FJS, f pain score, g patients' satisfactory score, h operative duration, i intraoperative blood loss, j HKA, k FFC, l FTC, m LFC, n LTC
留言 (0)