
記住我


Lung cancer begins in the lungs and spreads throughout the rest of the body (1), including the brain. Lung cancer is the most common cause of cancer-related mortality worldwide (2). Although lung cancer is more frequent in smokers, it may also occur in nonsmokers (3). The incidence of lung cancer is often and excessively increased with smoking. Lung cancer risk may be lowered even if you have smoked for a long period. Segmentation, a type of image compression, is necessary to infer information from photos. Imaging modalities (4), including Magnetic Resonance Imaging (MRI) and Computed Tomography (CT), can be utilized to create Computer-Aided Diagnostic (CAD) (5) models that can be used to diagnose and treat patients in precision medicine. Using a limited quantity of medical image data, we demonstrated the efficacy of our proposed model, which we refer to as U-NET++. A method known as the dice coefficient loss was used to compute the findings of the investigations. An approach to labeling preprocessing that is in line with the approaches that are already in use is presented in this paper.
The main novelty of this study is as follows.
• To propose the segmentation model for identifying lung disease made on CT scans with the limited set of CT scan images using the CLAHE.
• To develop the learning architecture combining U-Net with a two-parameter logistic distribution for image segmentation, was used for segmentation.
• To train the models using several deep learning classifiers and evaluate the performance of the models using benchmarks on the LUNA16 dataset using different information retrieval metrics.
The following section describes the organization of the subsequent sections of this study.
A considerable amount of important research is presented in Section 2. Deep learning architectures are used in segmenting medical images by U-NET++, which is created by combining the two-parameter model recommended with distribution learning of the U-Net type. Section 3 provides a comprehensive explanation of the topic. At this point, the criteria for evaluating the model's performance discussed in the fourth part of the section are presented.
2 Related worksA meta-analysis of the literature was performed. Table 1 clearly shows the literature matrix representation of their meta-analysis and the strong relationships between the authors and their respective works. CT scans were assessed based on the image brightness. Different areas of the same region should have the same intensity; hence, segmentation is an effective method to separate objects. Various segmentation procedures were found to be useful in this study. Three-step segmentation-based strategy for distinguishing lung regions.
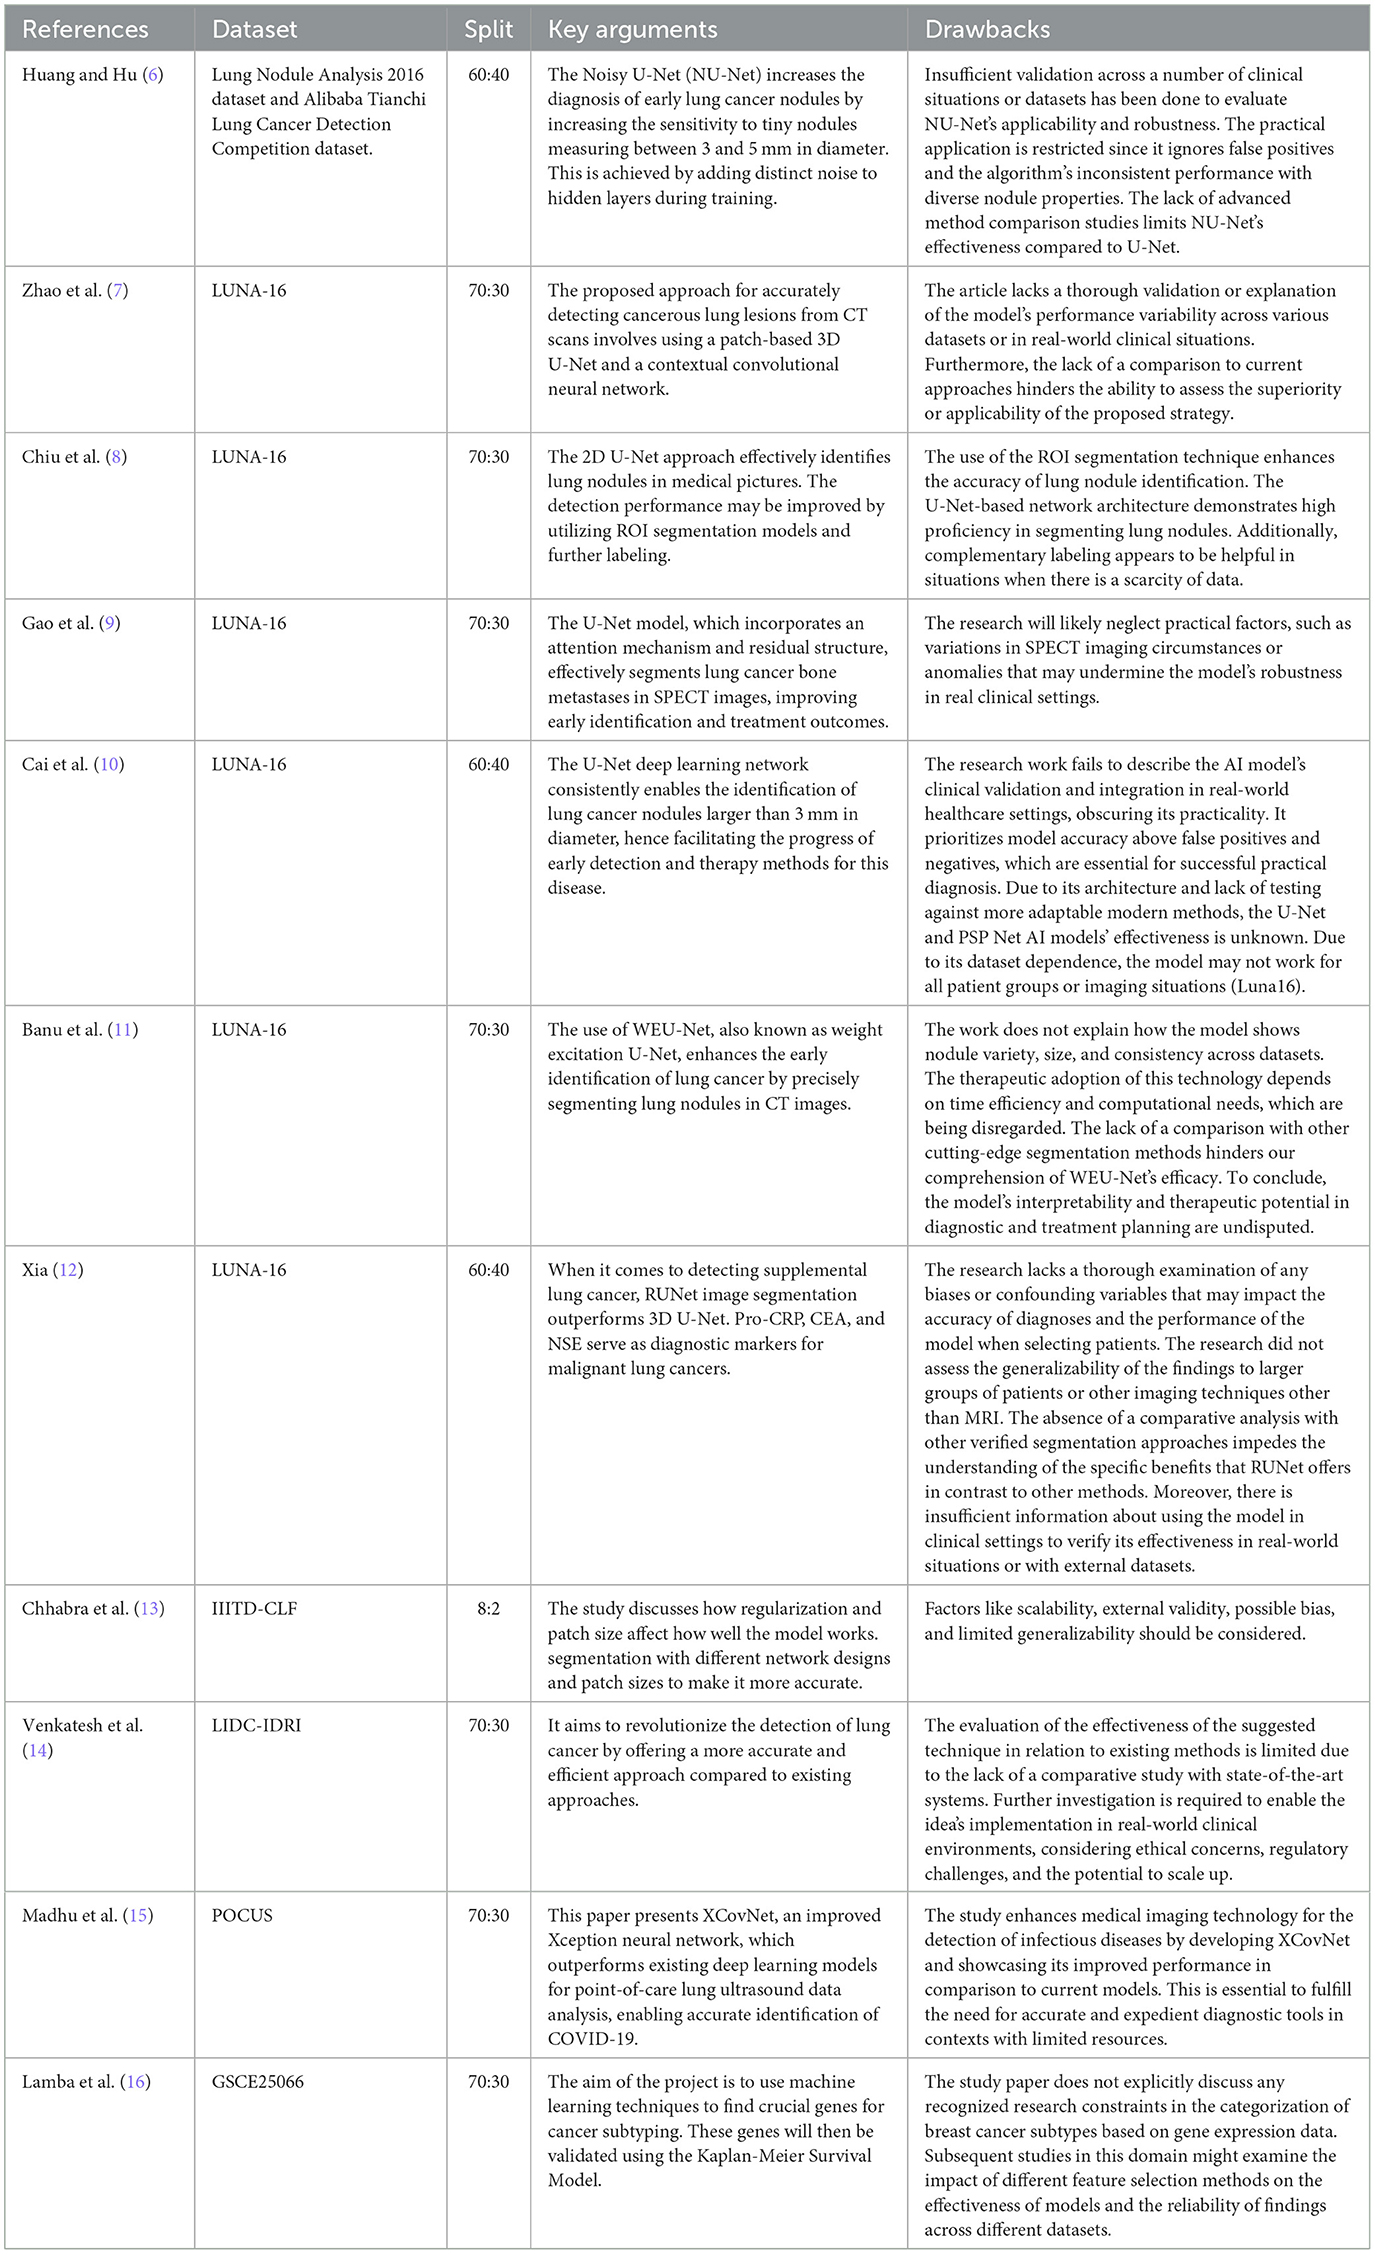
Table 1. Presents the related study and limitations in the works.
First, the lung was segmented using gray-level thresholding. Dynamic programming then divides the lung lobes. Finally, morphology-based smoothing approaches were employed. Region-based segmentation includes enlarging, dividing, and combining the areas (17).
A novel convolutional network type known as U-NET++ was developed to analyze CT images used in the biological sciences. U-NET++ was used in this study to extract lung fields from CT images. In healthcare, U-NET++ is nothing more than a variation of ConvNet, combined with various ad hoc data augmentation methods.
The robustness of the model was compromised because the authors of (6–8) carried out their research using the same data potential. The traditional U-Net network (9–16) is a semantic segmentation network built using a fully convolutional neural network. Although it has a relatively small number of layers, the network is nevertheless capable of functioning well, although less complex than its predecessors. The UNET network consists of two main components: down-sampling and up-sampling algorithms. The process of feature extraction, also known as down sampling, involves using convolutional, and pooling layers. This stage is accountable for obtaining characteristics from the original image. A deconvolution technique is employed to enhance the feature map's intricacy. The alternative term for the structure that involves down-sampling and up-sampling is the decoder-encoder structure. The original picture undergoes convolutional and pooling layers during the down-sampling process. This leads to the generation of feature maps that include different levels of information. Regarding visual characteristics, the feature maps exhibit diverse abstraction levels. Combining the down-sampled feature map makes it possible to retrieve a larger portion of the abstract detail information lost during training. As a consequence, the network becomes more successful at segmentation. During the up-sampling process, the deconvolution layer systematically increases the feature image's dimensions. Consequently, the lung's three-dimensional nature results in a substantial loss of spatial information. Consequently, a substantial quantity of relevant information is lost when down-sampling occurs. As retrieving all data is impractical, up-sampling yields imprecise outcomes and disregards visual nuances. Moreover, in addition to the aforementioned concerns, implementing a deep neural network is necessary for future advancement. According to the results of applying U-NET++ to a new dataset, the precision of the IOU and Dice coefficients improved. The test results demonstrate that the U-NET++ architecture improves the efficiency of multiscale conversion and fully connected systems. The authors in (18) propose a novel approach for lung CT scan classification. They combined handcrafted features were extracted using Q-deformed entropy (QDE), which captured image texture based on intensity variations, with features automatically learned by a Convolutional Neural Network (CNN). This fusion strategy aimed to improve the identification of healthy lungs from those affected by conditions like COVID-19 or pneumonia (18). This proposed approach demonstrated the benefits of combining handcrafted and automatically learned features. Segmentation focused the model on relevant lung regions, and the LSTM network effectively utilized the fused features for accurate classification.
3 Materials and methods 3.1 U-NET++ architectural designThis study introduces the U-NET++ hybrid model, which utilizes a two-parameter logistic function to identify lung nodules from CT scans accurately. Lung CT scans were classified as “benign” or “malignant” when used as an input for a binary classification system. A unique hybrid model that combines U-Net (19) and two-parameter logistic distribution was developed to segment and diagnose lung cancer. The model was generated using the dataset of LUNA-16 lung CT images. The U-NET++ model is highly esteemed as a leading architecture in computer vision, primarily because it is built on established computer vision approaches. When assessed using the ImageNet test dataset, this model achieved a precision rate of 91%. The main architectural improvement in the model is the filter size, an improved version of the U-NET. Figure 1 illustrates the architecture of the proposed model.
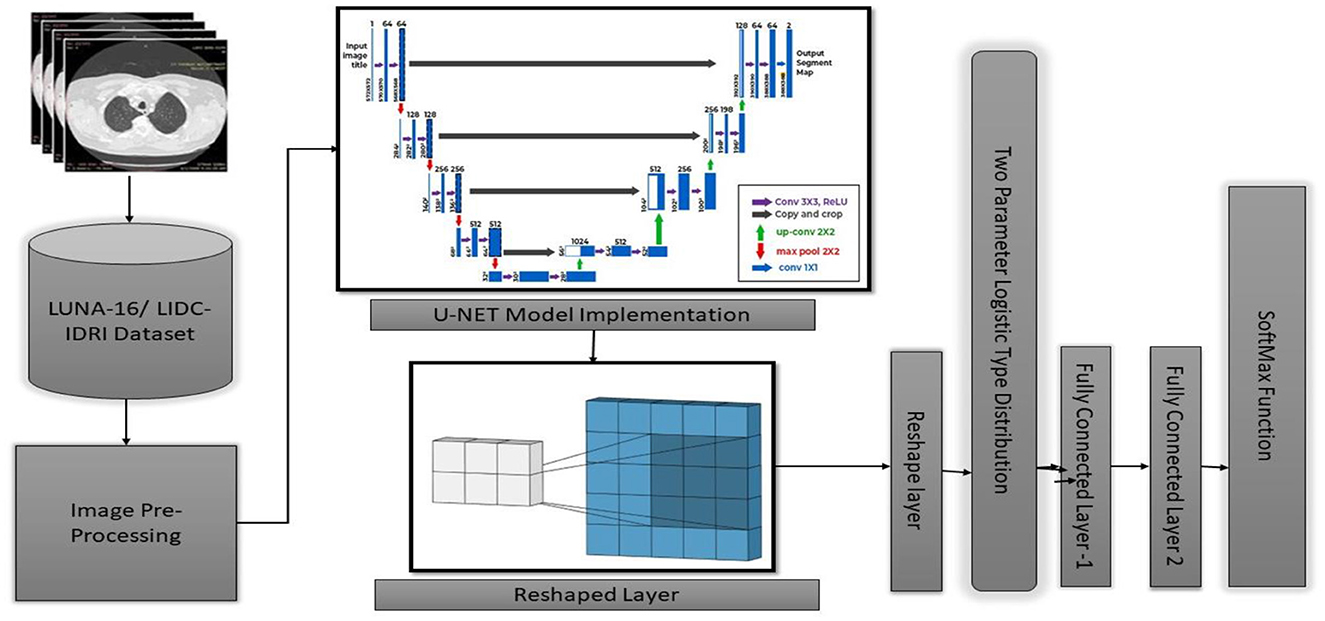
Figure 1. Architecture of U-NET++.
In the current section, a detailed presentation of the combination of two- and three-parameter logistic distribution models is presented. Figure 2 shows a two-parameter U-NET++ logistic-type distribution. In general, the pixel intensities are the content through which the quantification of the image details performed on several regions of the images. The brightness of a picture or image can be measured by using several performance metrics such as the moisture in the surroundings, lightening of the images, vision, and the surrounding environmental conditions. This measurement can be performed using the pixel values and pixel intensities. For instance, pixel (a, b) intensity measurement was performed using the function z = f (a, b) and considered as a random variable. To better analyze and understand the performance of the currently considered model and the intensities of pixels for various images, the model was designed for both parametric and parametric models. The pdf of the pixel intensity is given by
f(y,Մ,Ω2)=[3(12+π2)][4+(y-ՄΩ)2]e-(y-ՄΩ)k[1+e-(y-ՄΩ)2],-∞<y<∞,-∞<Մ<∞,Ω>0 (1)Where y is the pixel Intensity, Մ is the mean of pixels s, and omegas the variance of the ented image's pixels.
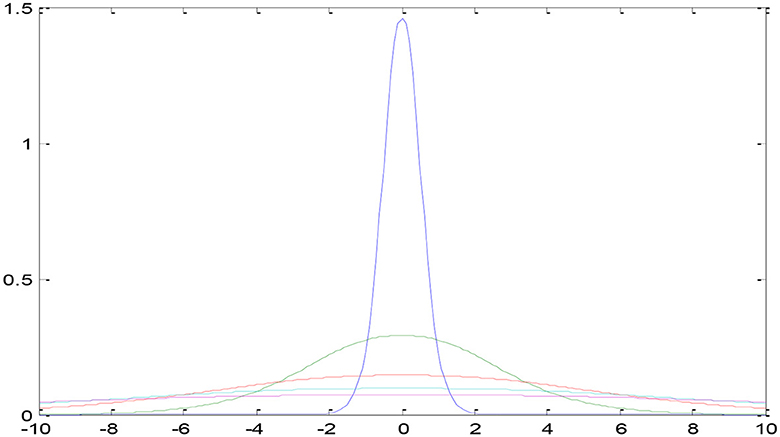
Figure 2. Two-parameter U-NET++ two-parameter type distribution.
3.2 U-NET++ algorithm 3.2.1 U-Net ith two parameter type distribution Ωi 2For updating Ωi2 we differentiate R(Q, Q) with respect to Ωi2 and equate it to zero. That is ∂∂Ω2(Q(Q,Q(l)))=0. This implies E[∂∂Ω(logL(Q,Q(l)))]=0. The derivative was applied and implemented for both parameter models with σi2 for the two-parameter model, with estimation error of 0.001 and it was with the biased estimation. From the Equations 1–6 segmentation algorithm used in the proposed algorithm.
∂∂Ωi 2[∑s=1N∑i=1KPi(ys.,Ql)logβi[312+π2][4+(ys−ՄiΩi)2]e−(ys−ՄiΩi)Ωi[1+e−(ys−ՄiΩi)2]]=0. (2)The updated equations of σi2 at (l+1)th iteration is
Ωi 2(l+1)=∑s=1N[[(ys−Մi (l+1))Ωi 3(l)]−[1Ωi 2(l)]−[(ys−Մi (l+1))2Ωi 4(1+e(ys−Մi (l+1)σi (l))2)]]pi(ys,Q(l))∑s=1N(xs−μi (l+l))pi(xs,θ(l))σi 4(l)(4σi 2(l)+(xs−μi (l+1))2). (3)For three-parameter logistic type distribution: -
∂∂Ωi 2[∑s=1N∑i=1KPi(ys.,Ql)logβi[33p+π2][p+(ys−ՄiΩi)2]e−(ys−ՄiΩi)Ωi[1+e−(ys−ՄiΩi)]2]=0. (4) ϒi2(l+1)=∑s=1NPi(ys.,Q(l))(ys−Մi (l+1))2Ωi 3(l)−∑s=1NPi(ys.,Q(l))(ys−Մi (l+1))σi 3(l)[1+e(ys−Մi)Ωi]−∑s=1NPi(ys.,Q(l))2Ωi 2(l)∑s=1NPi(ys.,Q(l))(ys−Մi (l+1))2σi 4(l)[pΩi 2(l)+(ys−Մi (l+1))2]. (5)Were
pi(ys,Q(l))=[βi(l+1)fi(ys,ϒi(l+1),Ωi2(l))∑i=1kβi(l+1)fi(ys,ϒi(l+1),Ωi(l))]. (6) 3.3 Module designFigure 3 discuss about the methodology design followed in our proposed work. A typical image processing method is contrast-limited adaptive histogram (CLAHE) equalization. Smooth regions become noisier with adaptive histogram equalization. CLAHE may enhance noise in hectic circumstances. Histogram size may be limited by CLAHE. Understand that deep learning variation is a major issue. Use two tag techniques for variety. Match the center to the background to reduce variation. This study employed the dice coefficient loss function used by picture segmentation pros. The experiment suggests labeling may be better than initial marking in cases with insufficient data. Medical images are hard to classify and find. Everyone agrees transferring less data is hard. Semi-supervised learning overcomes auto-labeling naming issues. Proposed study successfully locates the lung using ROI segmentation from CT scans. Process attention model. The ROI segmentation model during data processing may find lung tumors, study suggests.
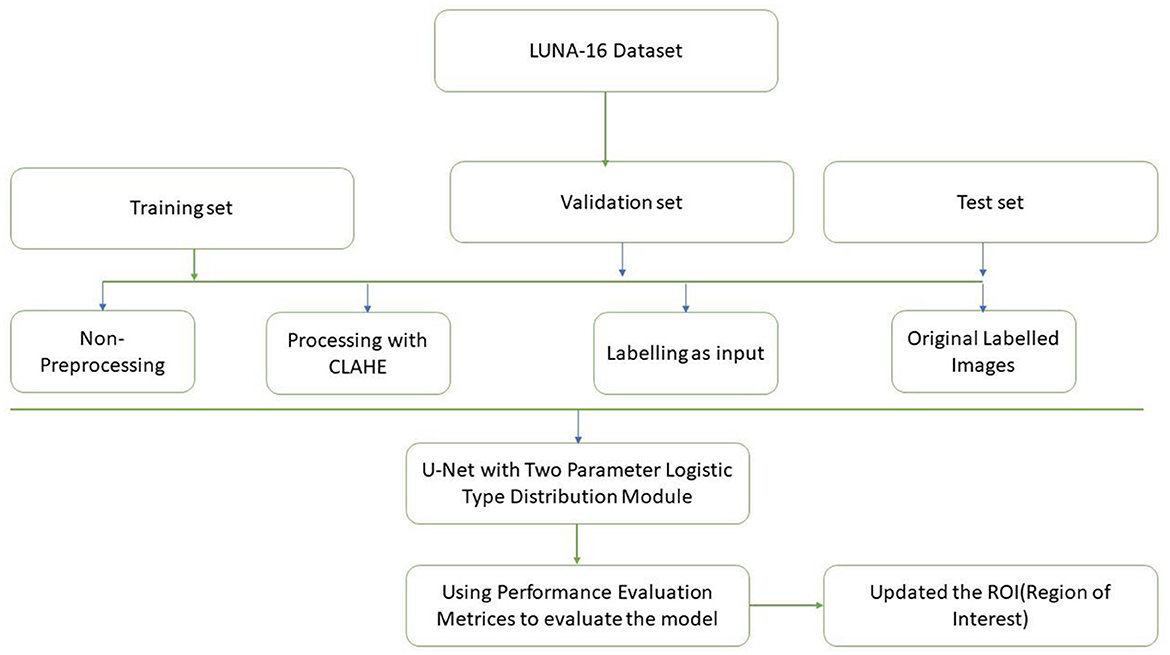
Figure 3. Methodology design.
4 Model parameters and discussions 4.1 LUNA-16 datasetA total of 5,000 CT scans were obtained from LUNA-16. Four expert radiologists annotated the images in the LIDC/IDRI database for 2 years (20–22). Each radiologist diagnosed the nodules as non-nodules, nodules with a diameter of ≤ 3 mm, or nodules with a diameter of ≥3 mm (23). This article examines the annotation process in detail. Three of every four nodules larger than 3 mm in diameter must be identified by radiologists (24). Non-standard findings have not been noted before (non-nodules, nodules < 3 mm, and nodules annotated by only one or two radiologists). Table 2 shows various illustrations of nodules in the LUNA-16 dataset.
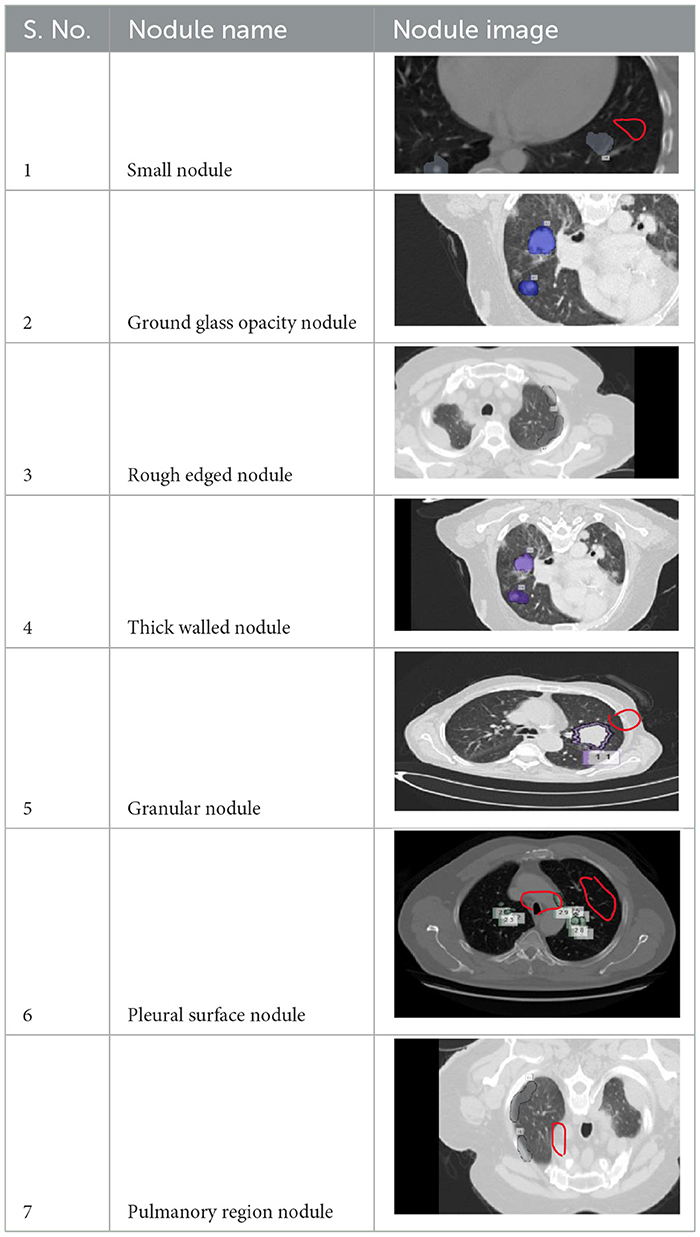
Table 2. Various benigna and malignant nodules present in the LUNA-16 dataset.
Table 3 presents various feature extraction values obtained from the LUNA16 database. A node, which refers to a specific structure, has a wide range of characteristics, with malignancy being used as an example to illustrate this. The estimation of the node's outline coordinates is utilized, whereas the surrounding area of the nodule is often underestimated. Lobulation refers to the configuration and attributes of a nodule. The measurement of a nodule in millimeters determines its diameter, which in turn determines its length. The
留言 (0)