
記住我


Hypertension affects >100 million American adults, which is nearly half of individuals aged ≥20 years []. Hypertension is also one of the most important cardiovascular disease risk factors, and when uncontrolled, it can cause adverse health outcomes such as myocardial infarction, stroke, heart failure, and chronic kidney disease [-]. Despite the importance of maintaining adequate blood pressure (BP) control, the American Heart Association has reported that only approximately 21.6% of those with hypertension have their BP controlled within age-adjusted criteria. Furthermore, 38.8% are unaware of their condition []. Hypertension-related health inequities are abundant in Black communities. Compared to White individuals, Black individuals have a greater prevalence of hypertension, hypertension-associated disease severity, and younger age of onset, making uncontrolled hypertension a significant problem in this population []. Moreover, Black individuals are more likely to use the emergency department (ED) for chronic disease–related ambulatory care, which is strongly linked to lower BP control, diminished awareness of hypertension, and adverse cardiovascular events [-].
Although uncontrolled hypertension is linked to a host of adverse outcomes, BP can typically be well controlled through lifestyle and behavior changes. Recommendations for managing hypertension have been consistent for decades and center on positive health behaviors such as maintaining a healthy weight, reducing daily sodium intake, increasing physical activity, and adhering to prescribed antihypertensive therapies []; however, engaging in these behaviors is difficult for many individuals, and this is especially true in Black individuals, who are less likely than White individuals to report adherence to preventive behaviors []. With the increasing national conversation focused on health inequities and social determinants of health [], population-specific interventions are needed to intervene in communities where the burden of hypertension is disproportionately high.
ObjectivesMobile health (mHealth) for chronic disease self-management is increasing in use, and based on this, as well as on the high penetration of smartphone ownership among Black individuals (currently approximately 83%) [], we sought to develop and test an mHealth intervention (MI-BP). The MI-BP intervention was developed with the intention of educating and supporting self-monitoring of multiple health behaviors to reduce BP among Black individuals with uncontrolled hypertension recruited from urban EDs and community-based settings. Our goal was to determine the effect of MI-BP on the primary outcome of BP and secondary outcomes of physical activity, sodium intake, medication adherence, and BP control compared to enhanced usual care in a 1-year randomized controlled trial (RCT). We hypothesized that (1) mean systolic BP (SBP) would be significantly lower in the MI-BP arm than in the control group after 1 year (hypothesis 1) and (2) measures of physical activity, sodium intake, medication adherence, and BP control would be significantly better in the MI-BP arm than in the control arm after 1 year (hypothesis 2).
This study was a 1-year, 2-group RCT of the MI-BP intervention compared to enhanced usual care. The study was overseen by our Data and Safety Monitoring Board (DSMB). Details on the full study protocol have been previously published [], but a summary of those procedures follows.
Clinical Setting and RecruitmentAll recruitment occurred in Detroit, Michigan, and was primarily conducted at the Detroit Medical Center in the EDs of Detroit Receiving Hospital and Sinai-Grace Hospital. Potentially eligible participants were screened by trained volunteers or by study staff members. Once a potentially eligible participant was identified according to clinical criteria, a research staff member spoke with the treating physician to determine whether they were a good candidate for participation. If so, individuals were informed of the study, screened further, and then consented and enrolled if they were interested and met the eligibility criteria. Additional recruitment occurred at community events where BP screening was conducted, such as mobile health unit visits, health fairs, and other health-related community events. Procedures for these potential participants were the same except for not checking with treating physicians to determine whether our staff should proceed with screening and enrollment.
Eligibility Screening and ConsentInclusion CriteriaTo be eligible to participate in this trial, individuals were required to be Black, between the ages of 25 and 70 years, previously diagnosed with hypertension, have a smartphone compatible with the MI-BP intervention, and have uncontrolled BP (SBP >135 mm Hg) at triage and on repeat measurement using a BpTRU BPM-200 device (Smiths Medical PM, Inc) or Omron HEM 907XL IntelliSense (Omron Healthcare, Inc) at least 1 hour after triage vitals were taken.
Exclusion CriteriaIndividuals were excluded from this trial if they were pregnant; had serious existing medical conditions that may make BP control difficult or necessitate frequent hospitalization (ie, previous diagnosis of resistant hypertension, steroid-dependent asthma or emphysema, cirrhosis or hepatic failure, stage-C or stage-D chronic heart failure, stage-IV or stage-V chronic kidney disease, and terminal cancer or ongoing active chemotherapy or radiation therapy); had a history of other serious medical conditions (eg, stroke, dementia, myocardial infarction, or known coronary artery disease); or had a history of alcohol or drug abuse as determined using the Cut down, Annoyed, Guilty, and Eye-opener Adapted to Include Drugs questionnaire (excluded if score was ≥2).
Study ProceduresBaseline Data Collection VisitAfter consent and enrollment, participants were scheduled for a return visit 1 to 2 weeks later for baseline data collection at a nearby university building. Transportation to all study visits via taxi or ride-sharing service was offered to anyone requiring transportation assistance. At the baseline visit, a secondary BP screening was conducted to ensure that we were only retaining participants with persistent uncontrolled hypertension in the study. At this time, participants who had an SBP of <130 mm Hg were deemed ineligible and excluded from the study. Next, baseline data were collected. To control response fatigue in the baseline data collection survey, we created 6 different permutations, each with a different order of instruments, which were also balanced within blocks. At this time, participants were also given a prescription for antihypertensive therapy. If needed, referrals to primary care were made by study physicians. In the event that a participant was already taking antihypertensive medications prescribed through a preexisting relationship with a primary care provider (PCP), we contacted their PCP to inform them of our algorithm-based approach to antihypertensive therapy and coordinated with them when medication adjustments were indicated.
Medication Titration and Randomization VisitAt 2 weeks after the baseline visit, participants were assessed for medication titration, the process of adjusting antihypertensive medication dosages to ensure appropriate and optimal treatment. At this time, participants were randomized into 1 of the 2 study arms in the trial. In total, it took approximately 4 weeks for an enrolled participant to be randomized into the study. This month-long de facto washout period was designed to ensure that we were truly reaching individuals with uncontrolled hypertension and who were not just temporarily presenting with elevated BP in the ED. Moreover, our previous experiences conducting work in this setting demonstrated high levels of attrition between ED recruitment and initial follow-up. Delaying randomization also helped ensure identification of individuals who did not intend to fully participate at the outset, increasing the likelihood of randomized participant retention. Trial randomization was stratified by sex in blocks of equal size. Study staff responsible for arm allocation were blinded to block size to prevent contamination. After randomization, all study materials, including any equipment, were distributed to the participants according to the treatment arm. A second titration visit was conducted 6 weeks after randomization, and the need for titration was assessed at each subsequent follow-up visit.
Quarterly Follow-Up VisitsData collection assessments were conducted at weeks 0, 13, 26, 39, and 52 using a consistent set of study measures. In addition to survey measures, patients were instructed to bring their hypertension medications with them so pill counts could be conducted. As electronic health record data were not available to our study team, all medication data, including prescribed medication names and doses, were self-reported or captured from pill bottles. We also monitored for any potentially harmful renal or metabolic issues at baseline and weeks 26 and 52 and adjusted medications accordingly. To measure sodium intake (a secondary outcome measure of interest), at weeks 0, 26, and 52, participants were given supplies to collect 24-hour urine for sodium measurement. Study staff collected these specimens directly from the participants at their home to improve adherence. All medication titration and study follow-up visits were free; however, participants were responsible for the cost of medications, PCP visits, or copays, as applicable.
Impact of COVID-19 on Study ProceduresIn March 2020, the MI-BP trial was closed to new enrollments and in-person data collection due to the COVID-19 pandemic. This necessitated protocol changes in the following weeks and months in an effort to maximize data collection from participants who were enrolled in the study before the pandemic. To summarize these changes, we pivoted to remote data collection for follow-up assessments via phone or videoconference. This meant that home-monitored BP measurements using study-issued cuffs served as the final outcome measures for participants completing their trial participation between March 2020 and April 2021. In addition, as all in-person participant interaction had been suspended, all laboratory measures were discontinued during the COVID-19 pandemic, and survey-based assessments were conducted verbally by phone or videoconference out of concern for literacy levels among participants. We also removed several instruments from interim follow-up assessments in weeks 13 and 39. Finally, anthropometric assessments, including weight, height, and waist circumference measurements, were self-reported by participants using their own home scales and tape measures. Given the increased reliance on home-based, self-reported data, the chance of missing data from follow-up assessments was greater.
Trial ArmsParticipants in this trial were randomized equally to 1 of the 2 treatment arms, which included an enhanced usual care control arm and the MI-BP intervention arm.
Enhanced Usual Care (Control Arm)Participants in the enhanced usual care group were given a prescription for antihypertensive medications, printed educational materials on hypertension, and a BP monitor for daily use. Participants assigned to the enhanced usual care control group received no further intervention; however, they were asked to take part in all study-specific follow-up visits. The decision to provide home BP cuffs to control participants, above and beyond true usual care, was made to reflect the fact that home BP monitoring is widely accepted as a guideline-based standard of care for individuals being treated for hypertension [], making it appropriate to include in the usual care arm. We acknowledge that this active control represents a departure from true usual care; however, it does represent an ideal usual care scenario based on current hypertension management guidelines.
MI-BP (Treatment Arm)Participants randomized to receive the MI-BP intervention were given a prescription for antihypertensive medication, a Bluetooth-enabled pedometer (Fitbit Zip), a BP cuff, and access to the MI-BP mobile app. Participants were asked to use the MI-BP mobile app and related peripheral devices for 12 months.
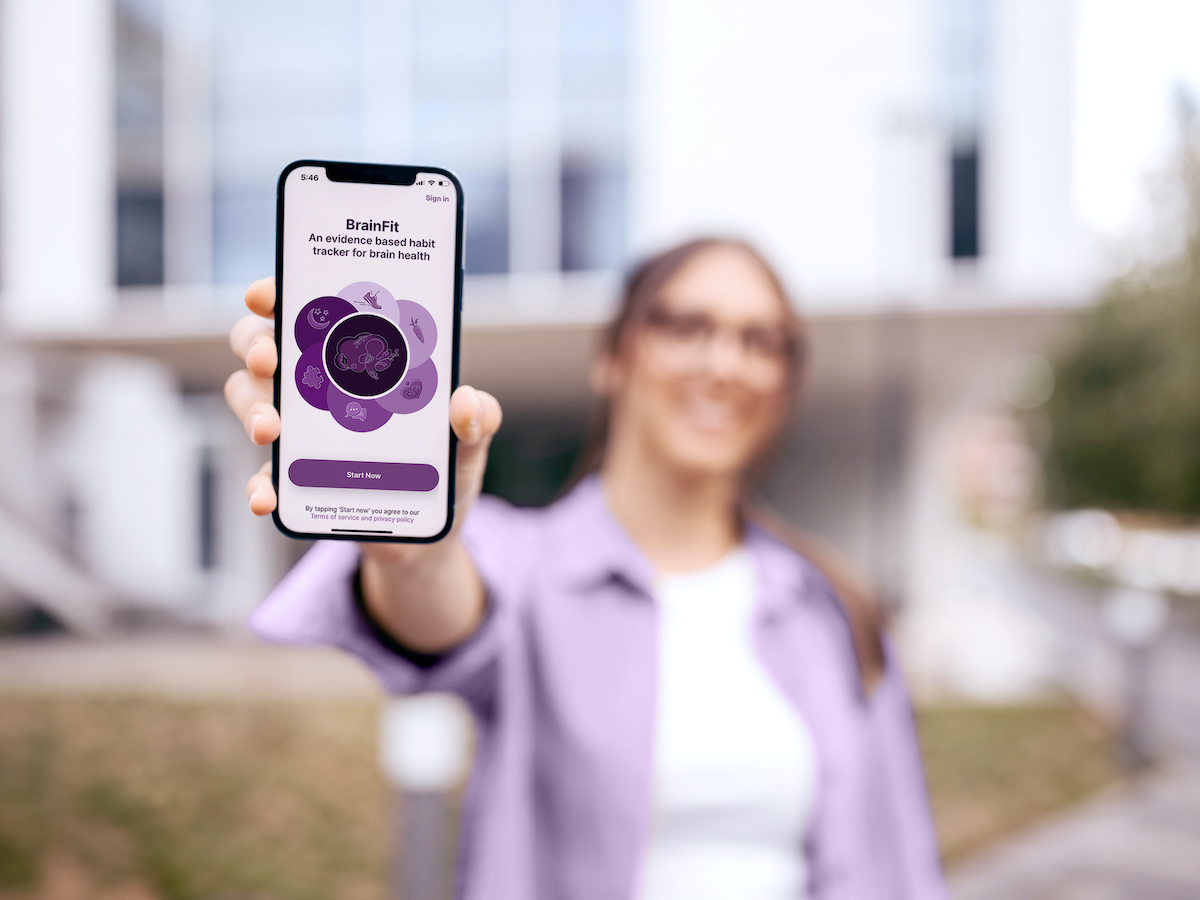
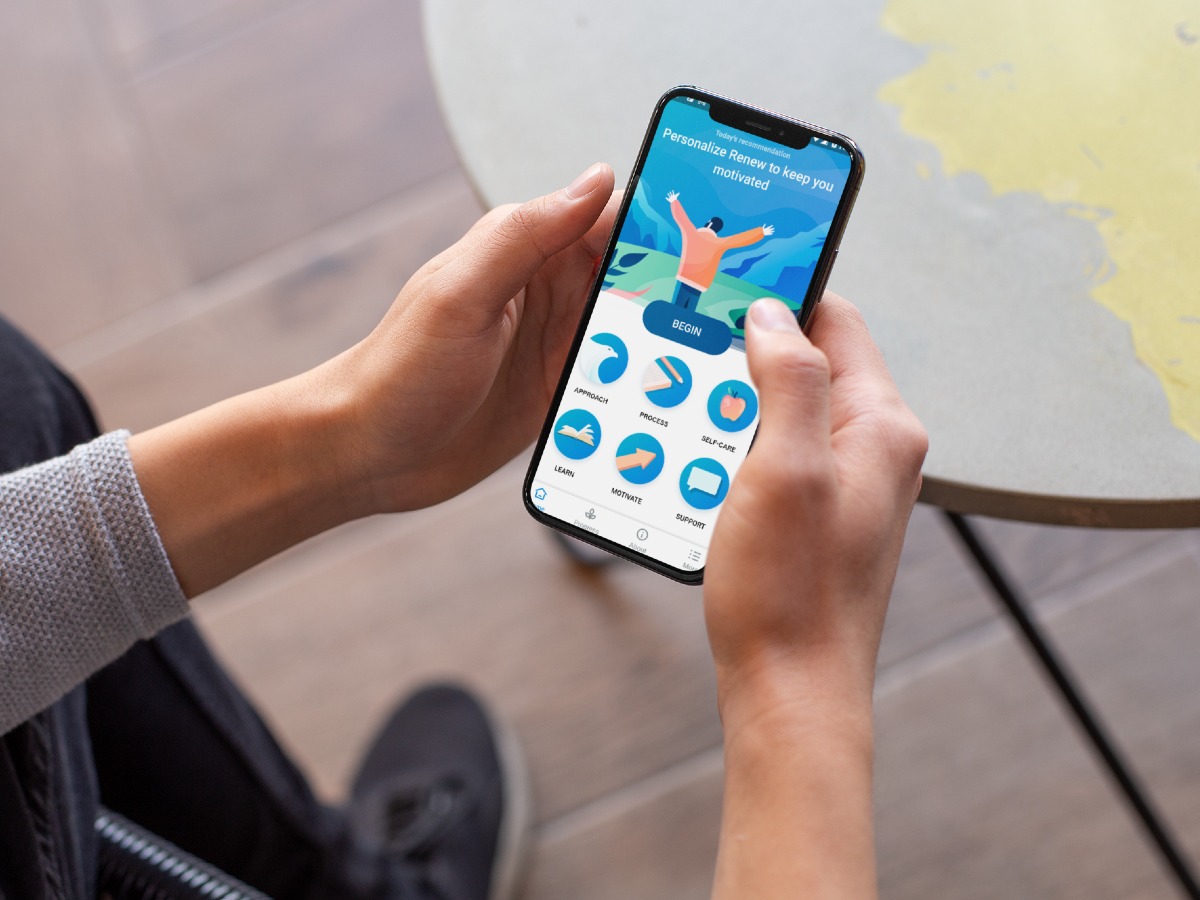
MI-BP InterventionOverviewMI-BP is a comprehensive, multicomponent intervention that targets multiple behaviors for managing hypertension via smartphone app, including BP self-monitoring, physical activity tracking, sodium intake tracking, goal setting, educational and motivational messaging, and medication adherence reminders. The MI-BP app was developed by Vibrent Health, a digital health company. Vibrent Health designed the app, study staff web-based portal, and server platforms necessary to support this trial. The MI-BP app was previously described in detail but is summarized in this section [].
BP MonitoringTo support BP self-monitoring, participants who could use a standard BP cuff (suitable for an arm circumference between 23 and 45 cm) were provided with a Bluetooth-enabled BP cuff (A&D UA-651BLE) that could sync to the MI-BP app. The MI-BP app showed different visualizations of BP over time, including both graph and log form. In the event that a participant required a larger cuff size (between 42 and 60 cm), we provided an extra-large arm monitor (A&D LifeSource UA-789), which was not Bluetooth enabled and required manual data entry. Participants were instructed to measure and sync (or manually enter) their BP to the MI-BP app at home using a commonly accepted home BP-monitoring protocol for a minimum of 3 days per week; however, daily self-monitoring and syncing were encouraged. If participants self-monitored an SBP reading of >180 or <100 mm Hg or a diastolic BP (DBP) reading of >110 mm Hg, they were instructed by the study staff at baseline, as well as by automated notifications within the app at the time of the elevated reading, to check their BP again. If it was still elevated after 3 days, participants were instructed to call the study staff. Participants were also instructed to report to the ED and follow up afterward with a call to the research staff if they were experiencing symptoms of dizziness, chest pain, severe headache, vision changes, or numbness or weakness in the face or extremities.
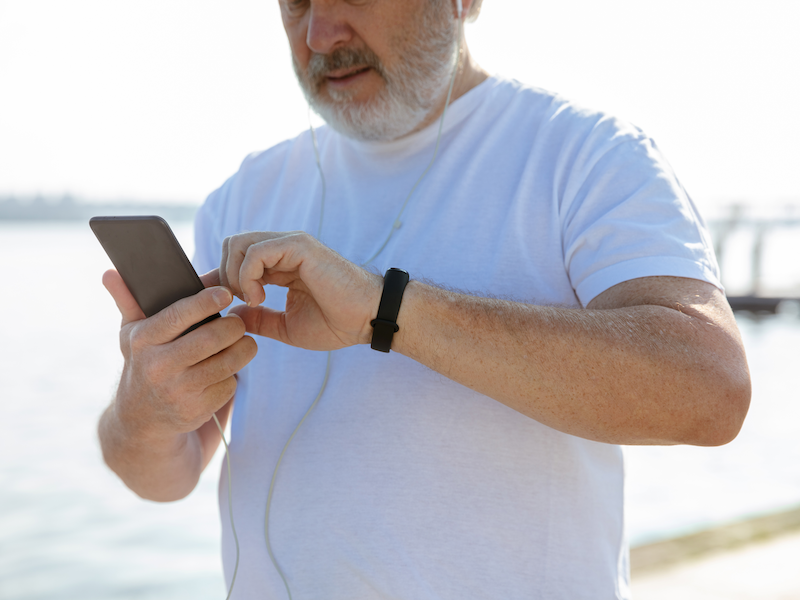
Physical Activity Monitoring and TrackingTo support physical activity self-monitoring, participants were provided with a Fitbit Zip pedometer that could sync to the MI-BP app, which showed different visualizations (graph and log form) of physical activity data over time. Participants were instructed to wear their Fitbit daily and sync the device at least once per week.
Sodium Intake Monitoring and TrackingTo support sodium intake monitoring, the MI-BP app used a logging approach that encouraged participants to identify their intake of high-sodium foods using a checklist-type log available within the MI-BP app. The checklist comprised 7 categories with 3 to 8 items per category and represented the most common types of high-sodium foods that contribute to high-sodium diets. Although we encouraged users to track their intake of high-sodium foods daily, users were instructed to engage at a minimum in highly focused, 3-day consecutive bouts of logging that were prompted within the MI-BP app.
Goal SettingParticipants received weekly step count goals that were displayed in the MI-BP app and were also delivered via push notifications. On the basis of previous work from our team [-], step count goals were gradually incremented and were based on an average of 7 consecutive days of data, during which at least 5 of the days needed to be considered valid. A valid day was defined as >200 steps per day. As we gradually incremented weekly goals, calculated goals never exceeded 600 additional steps over the previous goal. This gradual increment in weekly step count goals was made in an effort to reduce potential adverse events (AEs).
Goal setting for sodium intake was also conducted every 2 to 4 weeks after an intensive 1-week baseline self-monitoring period that was used to calculate the initial goal for each participant. Sodium intake goals were displayed within the app and were also sent via push notifications. Participants were instructed to log their intake of high-sodium foods for a 3-day period approximately 2 weeks after receiving their initial sodium intake goal that limited the number of high-sodium foods to be consumed. When sodium goals were met during a logging period, a new lower sodium intake goal was issued, and participants were asked to log their intake of high-sodium foods 4 weeks later. If the goal was not met, participants were asked to try again in 2 weeks. Additional details on our sodium logging and goal-setting protocols have been published previously [].
MessagingMI-BP provided users with 4 different types of messages, which were sent via push notifications and in-app messaging. These included educational messaging focused on hypertension, physical activity, sodium intake, and tips for behavior change and overcoming barriers to behavior change; motivational messaging; tailored messaging, including tips for overcoming specific self-reported barriers to behavior change and daily medication reminders as well as tailored feedback responsive to whether participants were meeting their set goals; and customizable daily medication reminders. In addition to the customizable daily medication reminders, MI-BP sent approximately 7 messages per week. Message content, frequency, and timing were varied and tailored wherever possible to maximize user engagement.
MeasuresWe collected a variety of measures throughout this study. Full details of our study measures have been published previously []; however, those discussed in this paper are described in this section. Data were collected at baseline; medication titration visits at weeks 2 and 8; and planned follow-up assessments at weeks 13, 26, 39, and 52. Although most measures were collected at all time points, some were collected less frequently due to participant burden and cost of administration. The primary outcome measure of BP was collected at the clinic (or at home with study issued BP cuffs during the COVID-19 pandemic) and was assessed at every study visit by a trained study staff member using a BpTRU BPM-200 or Omron HEM 907XL IntelliSense BP-monitoring device. Secondary outcome measures included the following: physical activity as measured using the International Physical Activity Questionnaire–Short Form (IPAQ-SF) []; sodium intake as measured using the Block Sodium Screener (BSS) [] as well as a 24-hour urine sodium test; self-reported medication adherence using the Adherence to Refills and Medication Scale (ARMS-14) []; and self-efficacy for changing targeted behaviors, including physical activity via the Self-Efficacy for Exercise Behaviors (SEEB) scale [] and medication adherence via the Medication Adherence Self-Efficacy Scale (MASES) [], as well as diet using an investigator-developed 11-item instrument assessing confidence in reducing sodium consumption, avoiding high-fat foods, avoiding sugar-sweetened beverages, and improving vegetable and legume intake. Additional measures included hypertension knowledge measured by the Hypertension Evaluation of Lifestyle and Management (HELM) scale []; health literacy measured by the Rapid Assessment of Adult Literacy in Medicine–Short Form (REALM-SF) []; patient activation measured by the Patient Activation Measure (PAM) [], and health-related quality of life measured by the Short Form–12 (SF-12) []. In addition to instruments assessing physical activity, sodium intake, and clinic-measured BP, we analyzed related study data from MI-BP treatment arm participants collected in the app.
Statistical AnalysisSample SizeAs stated in our study protocol [], our sample size was initially developed with 2 co–primary outcomes: SBP measured continuously and SBP control (defined dichotomously as either above or below the SBP target of 130 mm Hg), which is a more conservative measure. After experiencing sustained challenges with recruitment, the more conservative dichotomous BP control measure was dropped as a co–primary outcome. This necessitated a recalculation in sample size based solely on continuously measured SBP []. Due to a lack of similar studies available at the time, we estimated a drop of 10 and 17 mm Hg points in SBP in the usual care and MI-BP arms, respectively, at the end of the trial, based on estimates derived from our own previous work []. A constant between-subject SD of 10 mm Hg was assumed, along with an intrasubject correlation of 0.5 []. With 121 participants per arm, these estimates would allow us to detect a group-by-time interaction with power of >95% at a 5% level of significance. Allowing for 20% attrition, we sought to recruit 152 participants per study arm for a total of 304 participants.
Analysis PlanDescriptive statistics were calculated for demographic variables and baseline measures. To ensure balance across study arms, these measures were compared using 2-tailed t tests, Wilcoxon rank sum tests, or chi-square tests, as appropriate. Linear mixed models were used to investigate differences in change in the outcomes between study arms, with time, study arm, and their interaction as primary covariates. For all outcomes, time was entered as a categorical covariate. The models were further adjusted for age and sex. For the BP outcomes (SBP and DBP), a second set of models was explored, where time was entered as a linear term to capture the rate of change in the outcomes. All models included a random intercept to account for intrasubject correlation. Square root transformations were used for the IPAQ-SF and BSS, and a log transformation was applied to the ARMS-14 before running the linear mixed models to better meet model assumptions.
To investigate whether dropout was associated with any covariates, a time-to-dropout analysis was carried out using a Cox regression model. As this study was partially conducted during the COVID-19 pandemic, we wanted to consider the impact of COVID-19 on dropout. To that end, we defined a new variable, COVID group, for each individual at each time point. If the event time (eg, week 13) of individual assessments was before 3 PM on March 16, 2020, we considered these records as Before COVID-19. Otherwise, we considered the records as During COVID-19. Thus, the COVID-19 group was modeled as a time-dependent covariate in the Cox model. All statistical analyses were carried out in SAS (version 9.4; SAS Institute).
Ethical ConsiderationsThe methods for this study were approved by the institutional review boards (IRBs) at both Wayne State University (WSU; IRB 040416M1F) and the University of Michigan (HUM00114202). All participants provided written informed consent before enrollment. Participants received financial incentives to take part in this study, with each visit individually incentivized, and could earn up to US $275 over the course of 1 year. To protect the privacy and confidentiality of participants, all data are reported in the aggregate and no identifiable information is presented here.
In total, we prescreened 12,451 individuals, predominantly in ED settings (n=12,089, 97.09% in EDs; n=169, 1.36% from community events; and n=193, 1.55% from mobile health units), of whom 1195 (9.6%) were preliminarily eligible for participation. Of those 1195 participants, 869 (72.72%) were consented and enrolled in this study. Most enrolled participants were excluded after enrollment (before randomization) for failing the secondary screening in the ED, not meeting the inclusion criteria at baseline, or not meeting the primary inclusion criteria after consent (243/869, 28%); lost to follow-up before randomization (416/869, 47.9%); or scheduled for baseline or randomization visits that were halted due to the COVID-19 pandemic (48/869, 5.5%). shows the CONSORT (Consolidated Standards of Reporting Trials) diagram of participant flow through the trial. Due to the COVID-19 pandemic, in March 2020, ED recruitment for the trial was suspended precluding new enrollments from the ED. While we were able to eventually transition to community-based recruitment using mobile health units under an IRB-approved protocol amendment within 9 months of this, screening was severely reduced, and no new randomizations occurred. These considerations, combined with the challenge of keeping participants engaged using remote follow-up, prompted a decision by the study team, made in conjunction with our DSMB, to end recruitment for this study in January 2022. Ultimately, we randomized 162 participants to the MI-BP trial.
 Figure 1. CONSORT (Consolidated Standards of Reporting Trials) diagram showing participant recruitment and retention. **Reflects secondary blood pressure (BP) criteria in the previous protocol. AMA: against medical advice; CAGE: Cut down, Annoyed, Guilty, and Eye-opener; ED: emergency department; LTFU: lost to follow-up; mHealth: mobile health; SBP: systolic blood pressure. Participant Characteristics
The 162 participants randomized to this trial (n=79, 48.8% to usual care and n=83, 51.2% to the MI-BP intervention) were predominantly female (n=97, 59.9%) and were, on average, aged 48.3 (SD 9.3; range 29-68) years. As race was an inclusion criterion, 100% (162/162) of our participants were Black individuals. Participants were characterized by being single (86/162, 53.1%) and employed (97/162, 59.9%) and having a high school education or lower (90/162, 55.6%) and an average household income of <US $25,000 (73/162, 45.1%). shows participant characteristics as well as summary baseline measures stratified by study arm.
Table 1. Participant characteristics and baseline measures by study arm (N=162).Participant characteristics and baseline measuresOverallIntervention (n=83)Control (n=79)P valueaSite, n (%).45aDescriptive statistics were calculated for demographic variables and baseline measures and compared across the study arms using 2-tailed t tests, Wilcoxon rank sum tests, or chi-square tests, as appropriate.
bCOM: community-based recruitment.
cDRH: Detroit Receiving Hospital.
dSGH: Sinai-Grace Hospital.
eREALM-SF: The Rapid Estimate of Adult Literacy in Medicine–Short Form.
fHELM: Hypertension Evaluation of Lifestyle and Management Knowledge Scale.
gPAM: Patient Activation Measure.
hSF-12: Short Form–12 Health Survey.
iPCS: Physical Component Summary.
jMCS: Mental Component Summary.
Effect of MI-BP on OutcomesBP OutcomeFor our primary outcome of SBP, sex- and age-adjusted average baseline SBP was comparable between the groups (MI-BP group mean 153.92 mm Hg, SD 2.10; enhanced usual care group mean 153.96 mm Hg, SD 2.15; P=.99). Both groups saw a mostly steady and similar decline in SBP over the 12-month intervention (unadjusted means shown in A). shows a model-based assessment of pairwise differences in adjusted mean SBP for each study arm. At week 52, compared to baseline, the MI-BP group exhibited a 22.5 mm Hg decrease (SE 3.35 mm Hg; P<.001), and the control group exhibited a 24.12 mm Hg decrease (SE 3.25 mm Hg; P<.001) in average estimated SBP adjusted for age and sex. The average declines were not significantly different between the groups (time-by-arm interaction: P=.99). A regression model with a linear time term estimated the rate of decline in the MI-BP group to be 0.3 mm Hg per week (SE 0.05 mm Hg/wk; P<.001) and 0.34 mm Hg per week (SE 0.05 mm Hg/wk; P<.001) in the control group adjusted for age and sex. Again, these rates were not significantly different between the groups (interaction: P=.60; Table S1 in ). At week 52, overall 58% (19/33) of participants in the intervention group had controlled BP (secondary outcome, defined as SBP <130 mm Hg), whereas 53% (18/34) of participants in the nonintervention group achieved BP control. This difference was not statistically significant (P=.89).
 Figure 2. Unadjusted mean trajectories (with 95% confidence interval) for (A) systolic blood pressure (SBP) and (B) diastolic blood pressure (DBP) by study arm. Table 2. Estimated pairwise mean differences and SEs across time for systolic blood pressure by study arm.ComparisonInterventionControl
DBP exhibited a very similar pattern to that of SBP (B), with the MI-BP and control arms experiencing significant reductions in DBP from baseline to 52 weeks with a 10.20 mm Hg (SE 1.82 mm Hg; P<.001) and 11.44 mm Hg (SE 1.75 mm Hg; P<.001) estimated average decrease, respectively (). However, no significant differences were found between the groups (time-by-arm interaction: P=.79). Model-based rates of decline were observed in the MI-BP (estimate=0.13 mm Hg/wk; SE 0.03 mm Hg/wk; P<.001) and control (estimate=0.17 mm Hg/wk; SE 0.03 mm Hg/wk; P<.001; Table S1 in ) groups. Again, none of these changes were statistically significantly different between the groups (P=.21).
Table 3. Estimated pairwise mean differences and SEs across time for diastolic blood pressure by study arm.ComparisonInterventionControlSlight improvements in physical activity over the course of the trial were found for both the MI-BP and enhanced usual care groups as measured using the iPAQ-SF, although the improvements were not statistically significant in general. In the MI-BP group, the age- and sex-adjusted average IPAQ-SF score (after square root transformation) increased by 10.25 metabolic equivalent of task (MET) minutes per week (SE 6.37 MET min/wk; P=.11) at 52 weeks, whereas the increase was 10.57 MET minutes per week in the control group (SE 5.87 MET min/wk; P=.07; Table S2 in ). Both groups exhibited fluctuations in the change pattern, where the up-and-down behavior was more prominent in the MI-BP arm (Figure S1 in ). However, there were no significant differences in the change pattern across the groups (time-by-group interaction: P=.93).
Sodium IntakeFigure S2 in shows that mean sodium intake measured using the BSS declined fairly steadily in the MI-BP arm, whereas in the enhanced usual care group, there was a fluctuating pattern in the mean trajectories. However, both arms experienced significant improvements when comparing the baseline with the 52-week values. In the MI-BP group, the average decrease in the adjusted (square root–transformed) BSS score was 0.36 (SE 0.19; P=.06), whereas the average decrease in the control arm was 0.60 (SE 0.18; P=.001; Table S3 in ). No significant time-by-group interaction was observed (P=.19). We successfully obtained 24-hour urine sodium samples from 136 participants at baseline and 32 participants at 52-week follow-up. In contrast to BSS results, no differential improvements in sodium concentration in 24-hour urine sodium samples were found across arms (time-by-group interaction, P=.56).
Medication AdherenceBoth treatment groups experienced significant improvements in medication adherence as measured using the ARMS-14 over 1 year (Figure S3 in ). The average estimated decrease at 52 weeks compared to the baseline in the log-transformed ARMS-14 score in the MI-BP group was 0.20 (SE 0.04; P<.001), whereas the corresponding decrease in the control arm was 0.15 (SE 0.04; P<.001; Table S4 in ). No significant difference in the pattern of change was observed (time-by-group interaction: P=.30).
Self-EfficacySelf-efficacies were measured in 4 different ways related to attitude and habits of exercise, medication adherence, and eating habits. Figures S4A and S4B in show that the trajectories of exercise self-efficacy as measured using 2 subscales of the Self-Efficacy for Exercise Behaviors scale (Sticking to It and Making Time for Exercise) were similar in both study arms. However, in neither arm did the average scores change significantly. In the MI-BP arm, the average estimated decrease in the Sticking to It subscale score at week 52 from the baseline was 0.11 (SE 0.20; P=.59), whereas the corresponding decrease in the control arm was 0.01 (SE 0.18; P=.94). For the Making Time for Exercise subscale score, the adjusted mean decrease was 0.09 (SE 0.22; P=.69) in the MI-BP arm and 0.11 (SE 0.20; P=.58) in the control arm (Tables S5 and S6 in ). As with other outcomes, no significant time-by-group interactions were found (P=.88 and P=.94 for Sticking to It and Making Time for Exercise, respectively).
For medication adherence self-efficacy (MASES), statistically significant improvements were observed in both arms as the trajectories seemed to follow similar patterns (Figure S4C ). The increase in the estimated average MASES score in the MI-BP arm was 0.38 (SE 0.16; P=.02), and the corresponding increase in the control arm was 0.37 (SE 0.15; P=.02; Table S7 in ). No significant time-by-arm interaction was observed, suggesting no differences in the pattern of change between the groups (overall time-by-group interaction: P=.47).
Self-efficacy for eating behaviors showed worse values compared to the baseline (estimated mean 43.95) in the intervention group at week 52 as the estimated mean decreased from a baseline value of 43.95 to 40.04 at week 52 (estimated mean reduction 3.91; SE 1.47; P=.008). In contrast, in the control arm, the score increased slightly from baseline (mean 41.64) to week 52 (mean 43.69), although this improvement was not statistically significant (estimated mean improvement 2.05; SE 1.4; P=.14; Table S8 in ; Figure S4D in ). This was the only outcome for which a significant time-by-group interaction was observed (P=.04), albeit in the unintended direction.
Trial RetentionOver the course of the 12-month RCT, we saw steady rates of participant dropout, and only 67 participants (n=33, 49% in the intervention group and n=34, 51% in the control group) remained at the end of the 1-year study (retention rate=67/162, 41.4%). The greatest dropout rates were observed early in the trial between the week 2 and week 8 visits, followed by the periods later in the trial between the week 26 and week 39 visits and between the week 39 and week 52 visits.
Dropout Analysis and Effect of COVID-19Steady dropout was observed in both treatment arms over the study period, amounting to 60% (50/83) and 57% (45/79) dropout in the MI-BP and control arms, respectively, at the end of study. These dropout patterns were very similar in both study arms (). In the time-to-dropout analysis, marital status and COVID-19 group turned out to be statistically significant at the 5% level, with the post–COVID-19 phase showing a strong propensity () for dropout (hazard ratio=2.12; SE 0.23; P=.001).
 Figure 3. Dropout history over the course of the trial by study arm. Table 4. Time-to-dropout results based on Cox regression model.VariableHazard ratio (95% CI)P valueCOVID-19 group (reference: before COVID-19)2.120 (1.353-3.322).001Age0.983 (0.959-1.008).18Marital status (reference: divorced, widowed, or separated)
AEs for this trial were all determined to be cardiovascular in nature. A total of 15 AEs of SBP>180 were reported. All were determined to be unrelated to the study, and all were reported to both the WSU IRB and the study DSMB. In addition,
留言 (0)