
記住我


An 83-year-old Korean man with a previous history of hypertension treated with anti-hypertensive medication, who was referred to the Cardiology Clinic because of a six-month history of dyspnea (New York Heart Association functional class III) and peripheral edema. Upon examination, his blood pressure and heart rate were 108/70 mmHg and 75 bpm, respectively. Additionally, mild pretibial pitting edema was observed.
Electrocardiography revealed normal sinus rhythm with low QRS voltage and Q waves in V2–V4, indicating a pseudo-infarct pattern (Fig. 1A). Suspecting heart failure owing to long-standing hypertension with cardiomegaly and pleural effusion on chest radiography (Fig. 1B), transthoracic echocardiography (TTE) was performed. It revealed an LV end-diastolic diameter of 51 mm and a thickened LV wall of 15 mm with an LV ejection fraction of 48%. In addition, it showed a granular sparkling texture of the myocardium and minimal pericardial effusion (Fig. 2A). The longitudinal strain showed globally reduced strain values in the bull’s eye plot with relative apical sparing (Fig. 2B). Transmitral flow evaluation revealed a restrictive pattern with a high mitral inflow velocity of 100 cm/s and an E/e’ ratio of 29 (Fig. 2C, D). Given the clinical presentation with the aforementioned electrocardiographic and echocardiographic findings, cardiac amyloidosis was suspected.
Fig. 1
A Electrocardiography shows normal sinus rhythm with low QRS voltage and Q waves in V2–V4. B Cardiomegaly and pleural effusion are noted on the chest radiograph
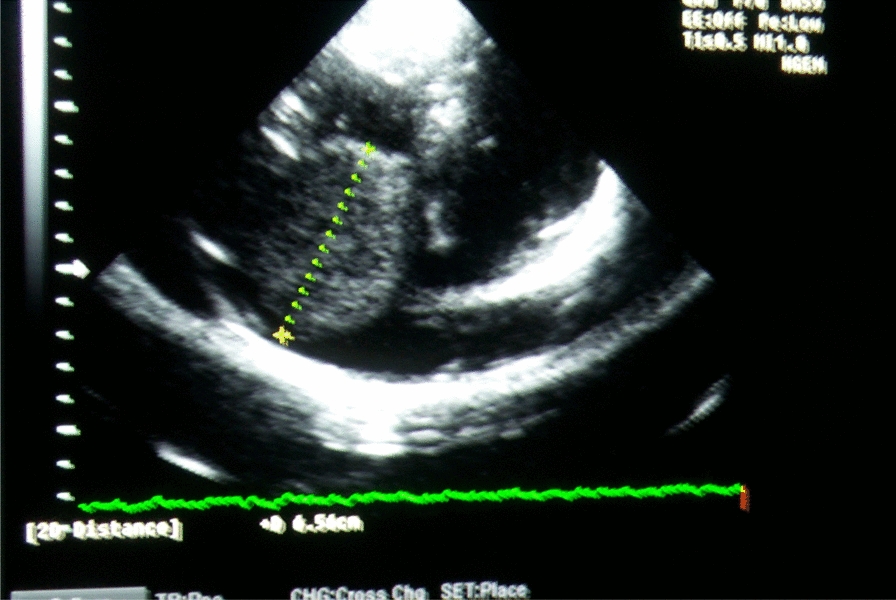
Fig. 2
A Transthoracic echocardiography (TTE) reveals enlargement of the left ventricle and left atrium (white asterisk), increased LV diameter and a thickened LV wall with a granular sparkling texture of the myocardium (white arrowhead), and pericardial effusion. B The longitudinal strain is globally reduced on the bull’s eye plot with relative apical sparing. C Transmitral flow evaluation reveals a restrictive pattern with a high mitral inflow velocity of 100 cm/s and D an E/e′ ratio of 29
To relieve symptoms and volume overload, the patient was prescribed a combination of heart failure medications, including an angiotensin-converting enzyme inhibitor (ACEI, perindopril 2.5 mg QD), diuretic agent (furosemide 20 mg QD), and mineralocorticoid receptor antagonist (MRA, spironolactone 25 mg QD). Over the one-month follow-up period, the patient’s cardiac symptoms gradually improved. Furthermore, as his blood pressure decreased to 90/60 mmHg at the one-month follow-up visit, perindopril was discontinued and switched to an angiotensin receptor blocker (ARB, valsartan 40 mg QD), expecting patient’s better tolerability with ARB.
To confirm and classify the type of cardiac amyloidosis, the patient underwent advanced imaging evaluations, including cardiac magnetic resonance (CMR) and Technetium pyrophosphate (99mTc-PYP) scintigraphy.
CMR images showed concentric LV hypertrophy and atrial dilatation (Fig. 3A). Late gadolinium enhancement was detected in the subendocardium of the LV and atrial walls (Fig. 3B). The lack of myocardial signal suppression at various TI times suggested amyloid deposition in the LV on T1 (Fig. 3C) and T2 mapping (Fig. 3D). CMR findings were consistent with cardiac amyloidosis.
Fig. 3
A Cardiac magnetic resonance (CMR) images show concentric left ventricular (LV) hypertrophy (white arrowhead) and atrial dilatation (white asterisk) on the axial plane view. B Late gadolinium enhancement is present in the subendocardium of the LV (black arrowheads) and atrial walls (white arrowheads) on the horizontal long-axis. C The lack of myocardial signal suppression at various TI times suggests amyloid deposition in the LV on T1 and D T2 mapping
99mTc-PYP scintigraphy findings supported the diagnosis of ATTR cardiac amyloidosis. Marked myocardial uptake (Perugini grade 3) of 99mTc-PYP, greater than that in bones, was found with attenuated skeletal uptake on whole-body images (Fig. 4A). Single-photon emission computed tomography images of the heart in the axial, coronal, and sagittal planes showed increased myocardial uptake (Fig. 4B).
Fig. 4
A Technetium pyrophosphate (99mTc-PYP) scintigraphy reveals marked myocardial uptake (Perugini grade 3) of 99mTc-PYP with low skeletal uptake on the whole-body images of the anterior and posterior sides. B Single-photon emission computed tomography-computed tomography images of the heart in the axial, coronal, and sagittal planes show increased myocardial uptake
Laboratory tests revealed no evidence of monoclonal gammopathy (Table 1). Genetic testing revealed no TTR gene mutations; therefore, the patient was diagnosed with ATTRwt amyloidosis. The patient exhibited no clinical signs of autonomic or peripheral neuropathy. Further evaluation, including endomyocardial biopsy, was recommended; however, the patient and his family declined and only wanted symptom control because of his advanced age. Tafamidis, a TTR stabilizer, was recommended for disease management and better prognosis. However, because of its high cost, the patient declined the treatment.
Table 1 Initial blood laboratory test resultsAt the 1-year follow-up visit, AF was detected, with a heart rate of 107 bpm (Fig. 5A). A beta-blocker (carvedilol 3.125 mg bid) was added to the regimen for heart rate control. However, the patient visited the Cardiology Clinic within a month owing to worsening dyspnea and peripheral edema. Follow-up chest radiography revealed aggravated blunting of the bilateral costophrenic angle, indicating increased volumes of pleural effusion bilaterally (Fig. 5B). Carvedilol was discontinued immediately, and the diuretic dosage was increased (Furosemide 40 mg QD and spironolactone 25 mg QD).
Fig. 5
A Follow-up electrocardiogram shows atrial fibrillation (AF) with a heart rate of 107 bpm. B Follow-up chest X-ray reveals pleural effusion bilaterally
At the next visit, follow-up electrocardiography revealed persistent AF, and a direct oral anticoagulant (DOAC), edoxaban 30 mg QD, was added to reduce the risk of thromboembolism associated with AF (CHA2DS2-VASc score, 4). However, the patient developed bloody stools within 2 weeks, and the gastrointestinal bleeding caused severe anemia, with a hemoglobin level of 6.4 g/dL (reference range, 13.5–17.5 g/dL). A digital rectal examination revealed internal hemorrhoids (Grade 2). The patient received two pints of packed red blood cell transfusion, and DOAC was discontinued
Follow-up TTE at one year showed deteriorated LV contractility of ejection fraction 31% and right ventricular dysfunction (RV S’ 6 cm/s). The patient was prescribed diuretics only to relieve symptoms and volume overload. The schedule of the medical treatment is summarized in Fig. 6.
Fig. 6
Treatment schedule of administered drugs and major complications
留言 (0)