
記住我


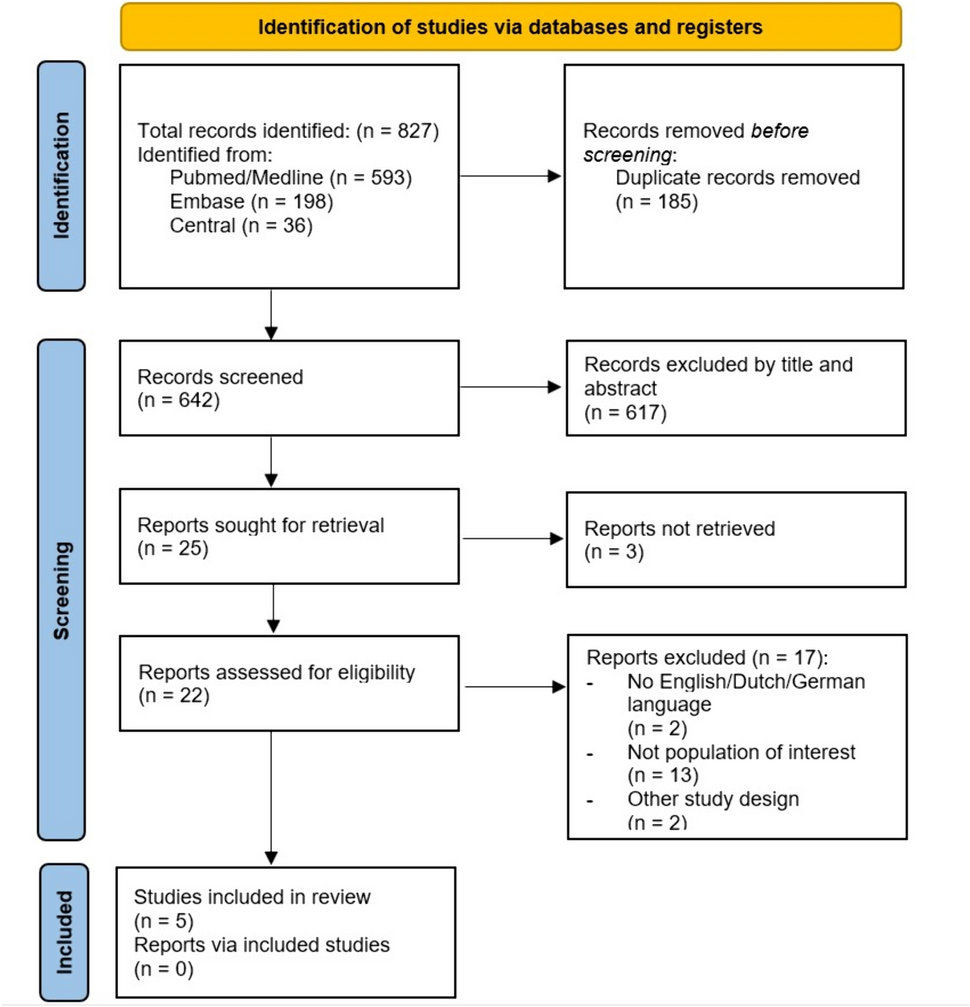


There were 18, 472 patients identified in the trauma registry between 2009 and 2021, patients not underdoing craniotomy or craniectomy were excluded (n = 18,358). There were 114 potentially eligible craniotomy and craniectomy patients identified. Patients were excluded if they received ICP monitoring alone (n = 8), chronic hematoma evacuation (n = 2), initial conservative management without an immediate operation or had a repeat CT scan prior to OR (n = 21). Duplicate entries for operations on the same patient were excluded (n = 4). The final study sample included 78 patients (Fig. 1).
Fig. 1
Median age was 35 (IQR 22–56), 58 (74%) were male, ISS was 25 (25–41) and AIS head, 5 (4–5). GCS on scene was 8 (3.25-14) and decreased to 3 (3–7) by the time patients had arrived in ED for the whole cohort. Patient undergoing pre-hospital intubated had a median GCS of 7 (3–12) which decreased to 3 (3–3) by ED presentation. Those not underdoing pre-hospital intubation had a median pre-hospital GCS of 13 (4–15) which had decreased to 10 (3–14) on arrival to ED. Forty-six (59%) patients were intubated prior to arrival in ED. CT reports showed that 26 (34%) had a pattern of herniation present, 12 (16%) had a depressed skull fracture, 28 (36%) had an extradural hematoma (EDH), 33 (42%) had a subdural hematoma (SDH), the remaining 17 (22%) suffered from a mixed hemorrhage type (Table 1 and Fig. 2).
Table 1 Baseline demographicsFig. 2
The median duration between ambulance arrival to the scene and arrival to an emergency department was 1.23 (0.89–2.15) hours. The pre-trauma center time was 1.83 (1.30–4.02) hours. The median injury to operation time was 4.88 (3.63–6.80) hours, injury to CT was 3.08 (2.23–3.71) hours and CT to OR was 1.46 (0.70–3.44) hours.
The median length of stay in ICU was 7 (2–12) days while median total length of stay was 14 (5–43) days. The overall mortality rate was 27% (n = 21) (Table 2).
Table 2 Timing data (hours)Injury to operating room time was significantly shorter for direct admissions than it was for patients referred from a peripheral hospital (4.37 versus 8.12 h, p < 0.001). ED arrival to OR time was shorter in those who had been referred from a peripheral hospital (0.97 h) versus direct admissions (2.64 h), p < 0.001. CT head to OR time was shorter for direct admissions (1.09 h) as compared to referred patients (5.01 h), p < 0.001.
Injury to operating room for those who died versus those survived was not statistically different (4.07 (3.23–5.28) hours on average versus 5.22 (4.00-7.15) respectively, p = 0.21). Injury to operating room times were longer for those with a favourable neurological outcome as compared to those with a poor outcome. (5.78 (4.42–7.28) hours versus 3.87 (3.02–5.38) hours, p = 0.03) (Table 3).
Table 3 Durations and LOS, outcomesLongitudinal resultsLinear regression results showed that time from injury to operating room increased on average over the study period for direct admissions (slope of trend line = 0.24 [0.01–0.47], p = 0.04) (Fig. 3; Table 4). The slope of the trend line can be interpreted as a 14.4 [0.6–28.2] minute increase per year, on average, in direct admissions over the study period. Over the same period for direct admissions, injury to ambulance arrival, pre-hospital (scene time), ambulance to ED and injury to CT time all increased significantly for this subgroup.
Table 4 Longitudinal regression statistics over timeFig. 3
Injury to OR (Direct admissions versus referred patients)
Injury to OR times for referrals from peripheral hospitals, polytrauma and isolated head injuries were similarly plotted against time. The time from injury to OR was unchanged over the study period (Table 4 and Fig. 4).
Fig. 4
Injury to OR (Isolated head injury versus polytrauma)
Linear regression of total time spent in ED, ED arrival to CT head, ED to OR time and CT to OR time for the whole cohort and for all subgroups was not statistically significant (Table 5).
Table 5 Linear regression statistics for key points in ED timing dataOne outlier, identified via ROUT analysis with Q = 0.5%, was removed as a sensitivity analysis to see if it would affect the slope of our regression analysis. Removing the outlier did not have a significant effect on the results.
Duration of operation was similar across all groups. Mortality was lower in the secondarily referred group compared to the patients who were admitted directly, 2 (8.00%) versus 19 (35.85%), p < 0.001. Mortality was not different statistically between isolated head injury and polytrauma. Mortality over time did not show a statistically significant difference (Fig. 5; Table 4). Median GOS Score on discharge was lower in direct admissions compared to all other groups, p < 0.001. GOS score at follow up was higher in direct admissions (median 4) and those referred from peripheral hospitals (median 5), p < 0.001. Median GOS on discharge and follow up was unchanged for the total cohort and for isolated head injury and polytrauma patients. There was no change in average GOS on discharge (slope = 0.01, p = 0.89) or follow up (slope = 0.02 (-0.18 to 0.22). p = 0.82) over the study period (Table 4).
Fig. 5
留言 (0)