
記住我


As a specialized cohort within the medical field, radiologists encounter distinctive occupational health hazards in the unique work setting of radiology. Their responsibilities entail prolonged exposure to computer terminals for image processing and analysis, as well as extensive involvement in ultrasound examinations, which necessitate prolonged and repetitive utilization of a singular upper limb, potentially leading to the development of “Transducer User Syndrome” (1). Furthermore, interventional radiologists operating in angiography suites face specific musculoskeletal challenges (2). Recent years have witnessed significant transformations in radiology, characterized by heightened case complexities and rapid technological advancements that impose greater demands on radiologists. The formulation of treatment plans has become increasingly intricate and time-consuming, while augmented administrative and documentation requirements contribute additional stressors (3). Within this context, radiologists contend with stringent turnaround expectations and enduring work pressures, predisposing them to an increased prevalence of repetitive musculoskeletal stress injuries, persistent ocular fatigue, and physical ailments, alongside psychological well-being issues including occupational stress (4–6).
Occupational stress refers to the reaction experienced by employees in specific professions when facing job demands that exceed their physical and environmental adaptability (7, 8). This stress not only stems from the characteristics of the job itself and environmental requirements but also closely correlates with multiple factors such as organizational structure, atmosphere, information flow, role clarity, workplace relationships, perception of career development, as well as external commitments and responsibilities (9). It is worth noting that the harmful effects of occupational stress cannot be ignored. It often accompanies significant psychological and physiological distress, and may even lead to burnout, posing a serious threat to the overall well-being of employees (8). Furthermore, prolonged occupational stress can also result in employee turnover, thereby impacting the stability and operational efficiency of organizations (9). Therefore, conducting in-depth research on occupational stress and seeking effective coping strategies is of paramount importance for safeguarding employee health and enhancing organizational performance.
Job satisfaction is defined as the cognitive aspect of happiness experienced by employees in their work. According to the Job-Demands Resources (JD-R) model (10), the level of job satisfaction is determined by the available resources (11). For radiologic technologists, their job satisfaction may stem from their perception of the job’s societal importance, including their perception of the work environment, occupational prestige, job achievements, and self-realization potential. Previous studies have shown that employees who are satisfied with their work tend to perform their duties more efficiently (12, 13). Furthermore, the JD-R model suggests that the level of job satisfaction is highly correlated with the level of occupational stress, a viewpoint supported by previous research (14).
In previous studies, the exploration of the relationship between occupational stress and job satisfaction often focused on causal analysis, such as investigating through statistical methods like linear regression or logistic regression (11, 13, 15–17). However, in reality, the relationship between occupational stress and job satisfaction is not unidirectional but rather mutually influential. Occupational stress may have a negative impact on job satisfaction, while an increase in job satisfaction can help alleviate occupational stress. To comprehensively reveal this complex interactive mechanism, this study employed the latest statistical method—network analysis (18). Network analysis is a data-driven research approach that does not rely on preconceived assumptions about causal relationships between variables (19, 20). Instead, it showcases the relationships between variables by generating a network structure with spatial order. In the network, key variables occupy central positions, while variables with fewer connections are located at the network periphery. Through network analysis, we can gain insights into the degree of connectivity among variables within the same structure and how interactions and enhancements occur between different structures.
In this study, we collected multiple indicators influencing occupational stress and job satisfaction among radiologic technologists and applied network analysis to process these data. Through this approach, we aim to gain a deeper understanding of the complex interplay between occupational stress and job satisfaction, thereby providing more targeted recommendations for enhancing the work environment and occupational health of radiologic technologists.
Method Participant and procedureThe data utilized in this study were gathered from a cross-sectional survey conducted in Nantong City, Jiangsu Province, between October 28 and November 7, 2022. Participants were sourced from the Nantong Imaging Professional Physicians Association. Imaging physicians meeting the following inclusion criteria were included: (1) membership in the Nantong Imaging Professional Physicians Association, (2) ability to comprehend the questionnaire’s content, (3) willingness to participate and provide informed consent, (4) absence of any diagnosed mental illnesses, and (5) current employment in the hospital’s imaging department. The study protocol underwent thorough review and approval by the Ethics Review Committee of Nantong People’s Hospital and obtained further endorsement from the Ethics Committee of Nantong People’s Hospital in China.
Participant recruitment employed a convenience sampling method, with individual information collected through a self-designed questionnaire administered via wenjuanxing software, China’s largest online survey platform. Prior to the survey, researchers underwent comprehensive training and provided a detailed explanation of the study’s objectives. The questionnaire link was distributed through the Nantong Imaging Professional Physicians Association, highlighting the importance of privacy and independence in questionnaire completion. Participants were assured of support and the right to withdraw from the study. Out of the 330 members invited, only 312 successfully completed the questionnaire, resulting in a response rate of 94.5%.
Measurement Socio-demographic variablesThe study assessed socio-demographic characteristics such as age, sex, education level, marital status, annual income, and years of work experience.
Job satisfactionThe Minnesota Job Satisfaction Questionnaire Revised Short Version (MJSQ-RSV) to evaluate job satisfaction among participants (21). This questionnaire comprises 20 items, with 12 items focusing on intrinsic satisfaction and 8 items on extrinsic satisfaction. Respondents rated each item on a 5-point Likert scale ranging from 1 (strongly unsatisfied) to 5 (strongly satisfied). Intrinsic satisfaction measures one’s content-related job satisfaction, while extrinsic satisfaction assesses satisfaction with job rewards, promotions, and leadership style. Higher ratings indicate higher job satisfaction levels. The MJSQ-RSV scale has shown strong reliability and validity when used in the Chinese population (15, 22, 23). In this study, the Cronbach’s α was 0.95.
Occupational stressThe Occupational Stress Scale, developed by Chen (24), consists of 38 items divided into seven dimensions: Organizational Management (8 items), Occupational Interests (8 items), Workload (6 items), Career Development (7 items), Interpersonal Relationships (3 items), External Environment (3 items), and Doctor-Patient Relations (3 items). Participants rate each item on a scale from “Strongly Disagree” to “Strongly Agree,” with scores ranging from 1 to 4 points. Higher scores reflect increased levels of stress. In this study, the Cronbach’s α was 0.90.
Statistical analysisIn the research, socio-demographic features were presented as Mean ± SD for continuous parameters and N (%) for categorical variables.
Network analysisWe used a Graphical Gaussian Model (GGM) to estimate the network, where edges denote conditional independence relationships among nodes (25). These edges can be interpreted as partial correlations, illustrating the relationship between two nodes while accounting for all other network connections. GGMs involve estimating numerous parameters (e.g., 16 nodes necessitate 136 parameter estimations: 16 threshold parameters and 120 pairwise association parameters) that may introduce false positives. To address this, GGMs are commonly regularized using graphical lasso (glasso) (26), a technique that shrinks edges and removes small ones to create a sparse, explanatory network with minimal edges. We estimated GGMs using glasso regularization along with extended Bayesian Information Criterion (EBIC) model selection for our analysis (27). Initially, 100 diverse network models with varying levels of sparsity were evaluated. The model with the lowest EBIC, determined by a specific γ hyperparameter value balancing false positives and true negatives, was selected. We set the initial γ value to 0.5 following recommendations. For visual representation, edge thickness signifies the strength of association. Node positioning relied on the Fruchterman-Reingold algorithm, placing nodes with stronger average associations closer to the graph center. Various metrics of node centrality were computed to determine the key symptoms within the network structure. Strength, which represents the total sum of edge weights linked to a node, along with closeness, indicating the average distance from a node to all other nodes in the network, and betweenness, quantifying the frequency of a node lying on the shortest path between two other nodes, were determined for each node.
To assess the precision and consistency of the combined estimated network, accuracy and stability were specifically examined. Accuracy was gauged by evaluating the confidence intervals (CIs) through bootstrapping (1,000 iterations) to determine the accuracy of the edge weights, where smaller CIs indicate enhanced precision. Stability of the node centrality and bridge centrality indices was investigated via case-dropping subset bootstrap methodology for the combined estimated network (28). This method involves evaluating the correlation between the original centrality indices and those obtained from reduced subsets with up to 75% of participants removed. Correlation stability coefficients (CS-coefficients) were computed to quantify how many cases could be dropped while still maintaining a correlation of 0.70 or higher with the original centrality indices, providing 95% confidence. Ideally, a CS-coefficient exceeding 0.25 indicates stability, with values surpassing 0.50 preferred (28).
We investigated two network characteristics that might vary between admission and discharge: the global network strength (referring to alterations in the total sum of all edges between admission and discharge) and network structure (such as shifts where highly connected nodes at admission become less connected at discharge, and vice versa, indicating significant structural changes). To assess changes in global network strength, we employed a permutation test known as the Network Comparison Test (NCT) (29).
We used R, version 4.3.1 to perform the network analysis. Visualization and computation of networks were conducted utilizing the R package qgraph. Additionally, network stability was assessed using bootnet package, and NetworkComparisonTest package was utilized to test network replicability in split samples as well as in men and women.
Result Participant characteristicsA total of 312 radiologists were included in the statistical analysis. Table 1 presents the baseline socio-demographic characteristics of the participants. The mean age was 38.33 ± 10.11 years, with the majority falling within the 44–49 age group, accounting for 31.7% of the cohort. There were 172 male participants, representing 55.1% of the sample. Among them, 39 individuals (12.5%) held a bachelor’s degree or higher. A significant portion of the participants were married, with 239 individuals (76.6%) reflecting this marital status. Regarding annual income, most participants reported earnings in the range of 100,001 to 150,000 RMB, comprising 41.0% of the sample with 128 individuals falling into this category. In terms of work experience, the majority had practiced for 20–29 years, constituting 24.4% of the respondents.
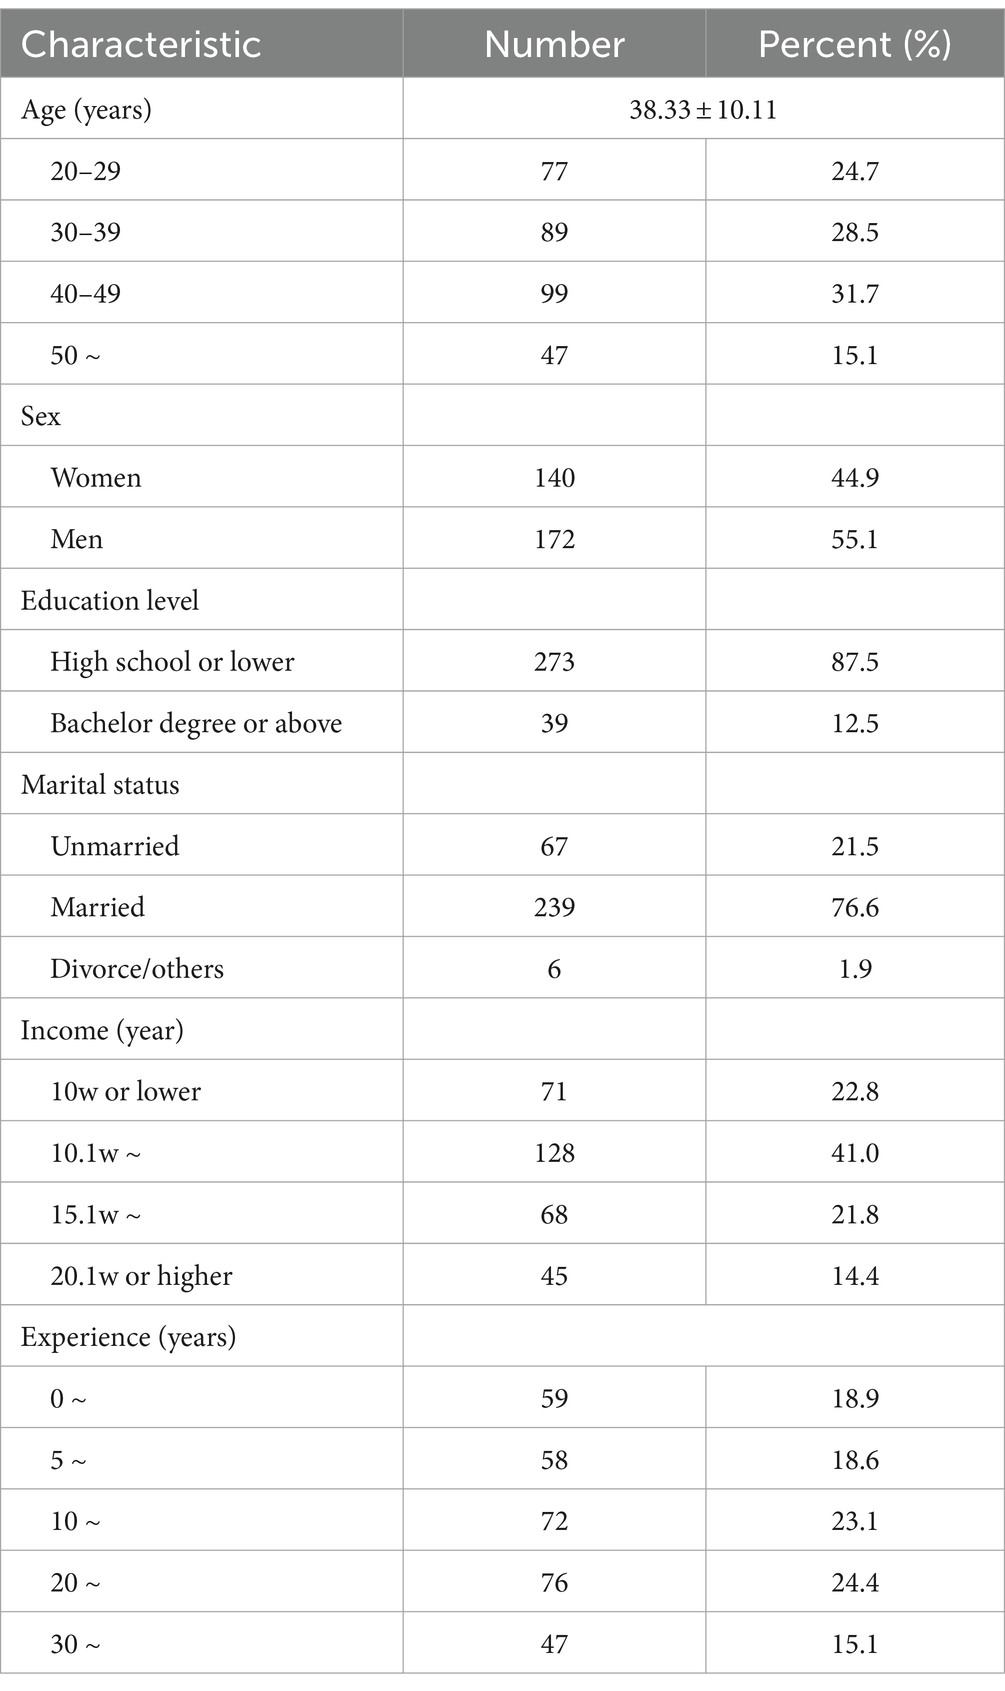
Table 1. Socio-demographic characteristics of participants (N = 312).
Network analysisIn the visualizations of the estimated partial correlation networks shown in Figure 1, nodes representative of occupational stress and job satisfaction exhibit densely interconnected patterns. Approximately 22% of all network edges were nullified. Specifically, within the entire network, organizational management (MS1) – occupational interests (MS2) displays the strongest association with a marginal weight of 0.588. Within the occupational stress group, the strongest connection is observed between career development (OS4) and interpersonal relationships (OS5), with a marginal weight of 0.471, closely followed by the relationship between career development (OS4) and intrinsic satisfaction (OS1) at a marginal weight of 0.371. Additionally, in terms of negative correlations, the most pronounced connection is between extrinsic satisfaction (MS2) and intrinsic satisfaction (OS1), with a marginal weight of −0.274, while the next significant negative correlation is between organizational management (MS1) and occupational interests (OS2) with a marginal weight of −0.233.
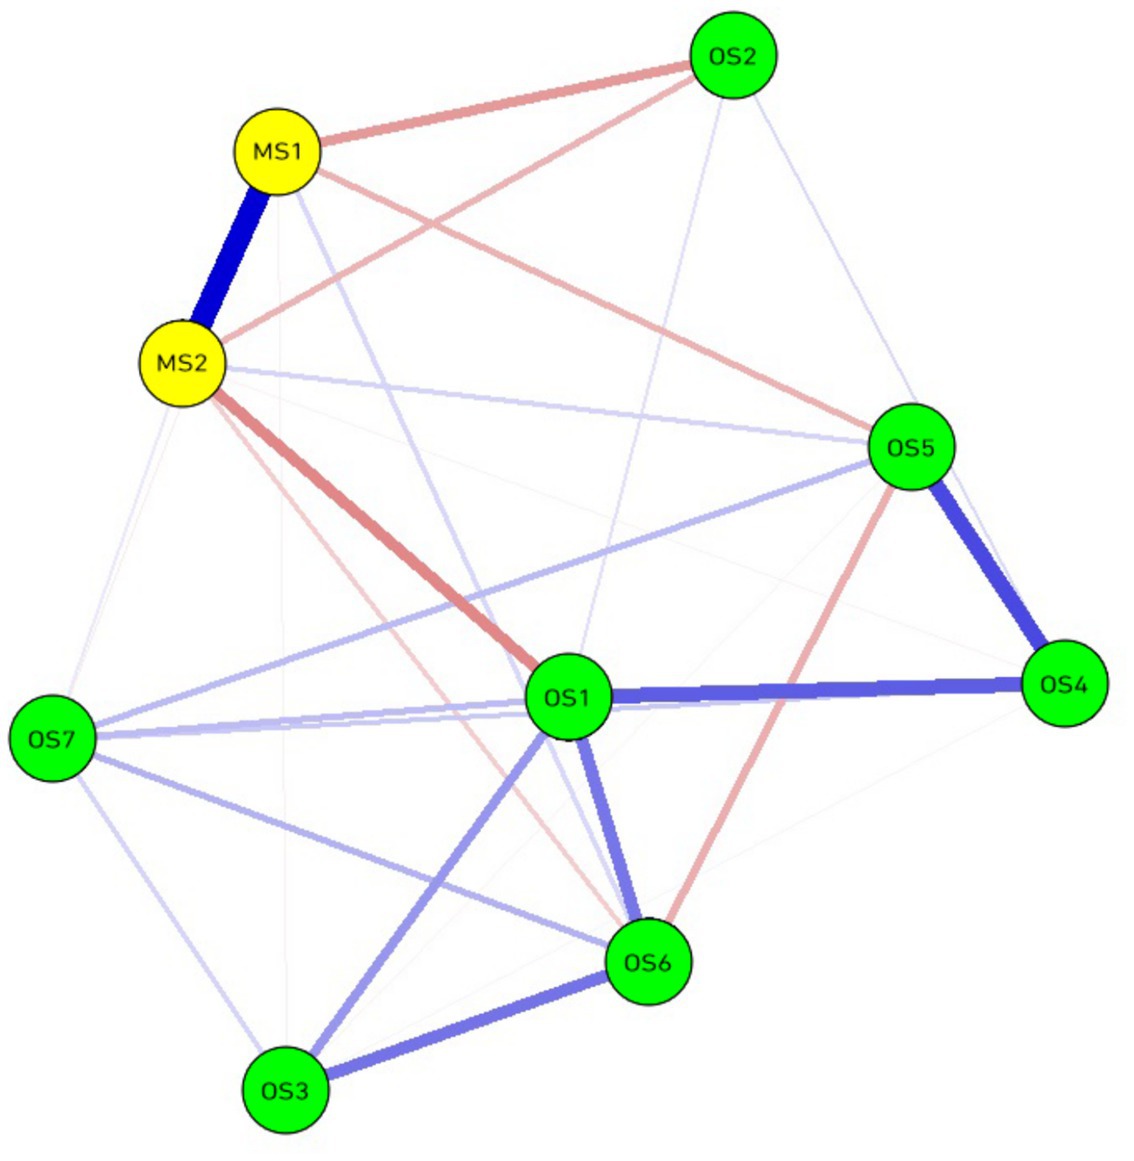
Figure 1. Estimated partial correlation networks of work stressors and job satisfaction.
To assess the centrality of individual nodes within the integrated network, metrics such as node strength, node closeness, and node betweenness were calculated. Figures depicting these three standardized centrality indices for the amalgamated partial correlation network can be found in Figure 2. Intrinsic satisfaction (OS1) emerges as a crucial was the most central symptom across all centrality indices, followed by the extrinsic satisfaction (MS2).
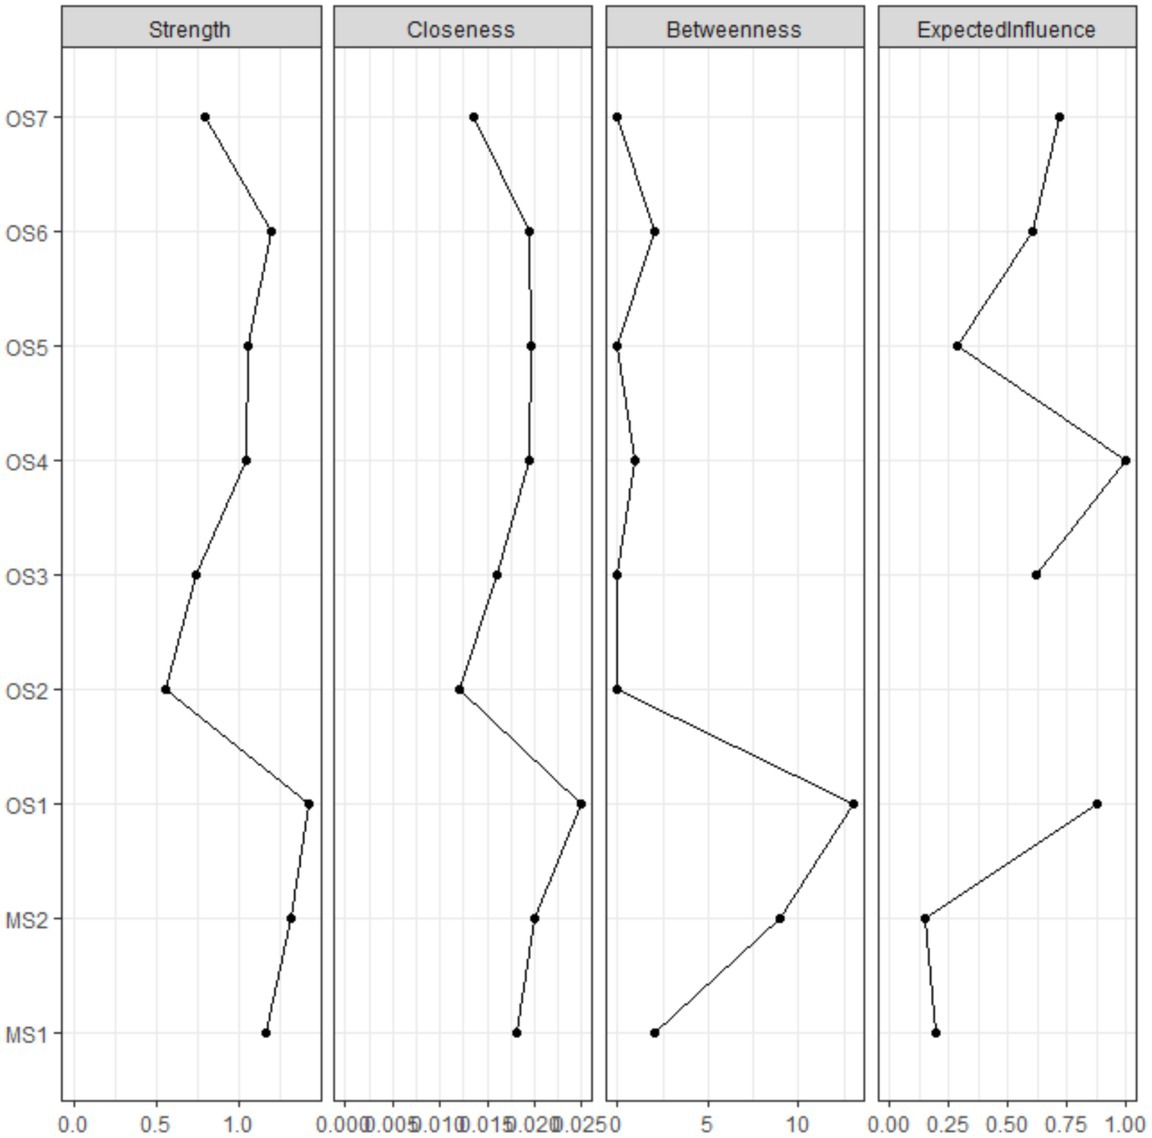
Figure 2. Centrality indices of node strength, closeness and betweenness, expected influence of the estimated network. All indices are shown as standardized z-scores.
An edge weight bootstrap procedure was conducted on the 95% confidence intervals surrounding the edge weights to evaluate the accuracy of the combined estimated network. Figures 3, 4 illustrates the visualization of the edge weight bootstrap procedure for assessing network accuracy. The results indicate relatively small bootstrapped confidence intervals around most estimated edge weights, suggesting high accuracy. Larger bootstrapped confidence intervals imply that caution should be exercised when interpreting the order of these edges in the network. To assess the stability of the combined estimated network, a case-dropping subset bootstrap procedure was conducted to derive the network model based on data subsets. A visualization of the case-dropping bootstrap process for bridge strength and expected bridge influence is depicted in Figure 4. Quantifying network stability through CS coefficients, findings from the case-dropping bootstrap suggest that node strength stands out as the most consistent centrality metric [CS(cor = 0.7) = 0.593].
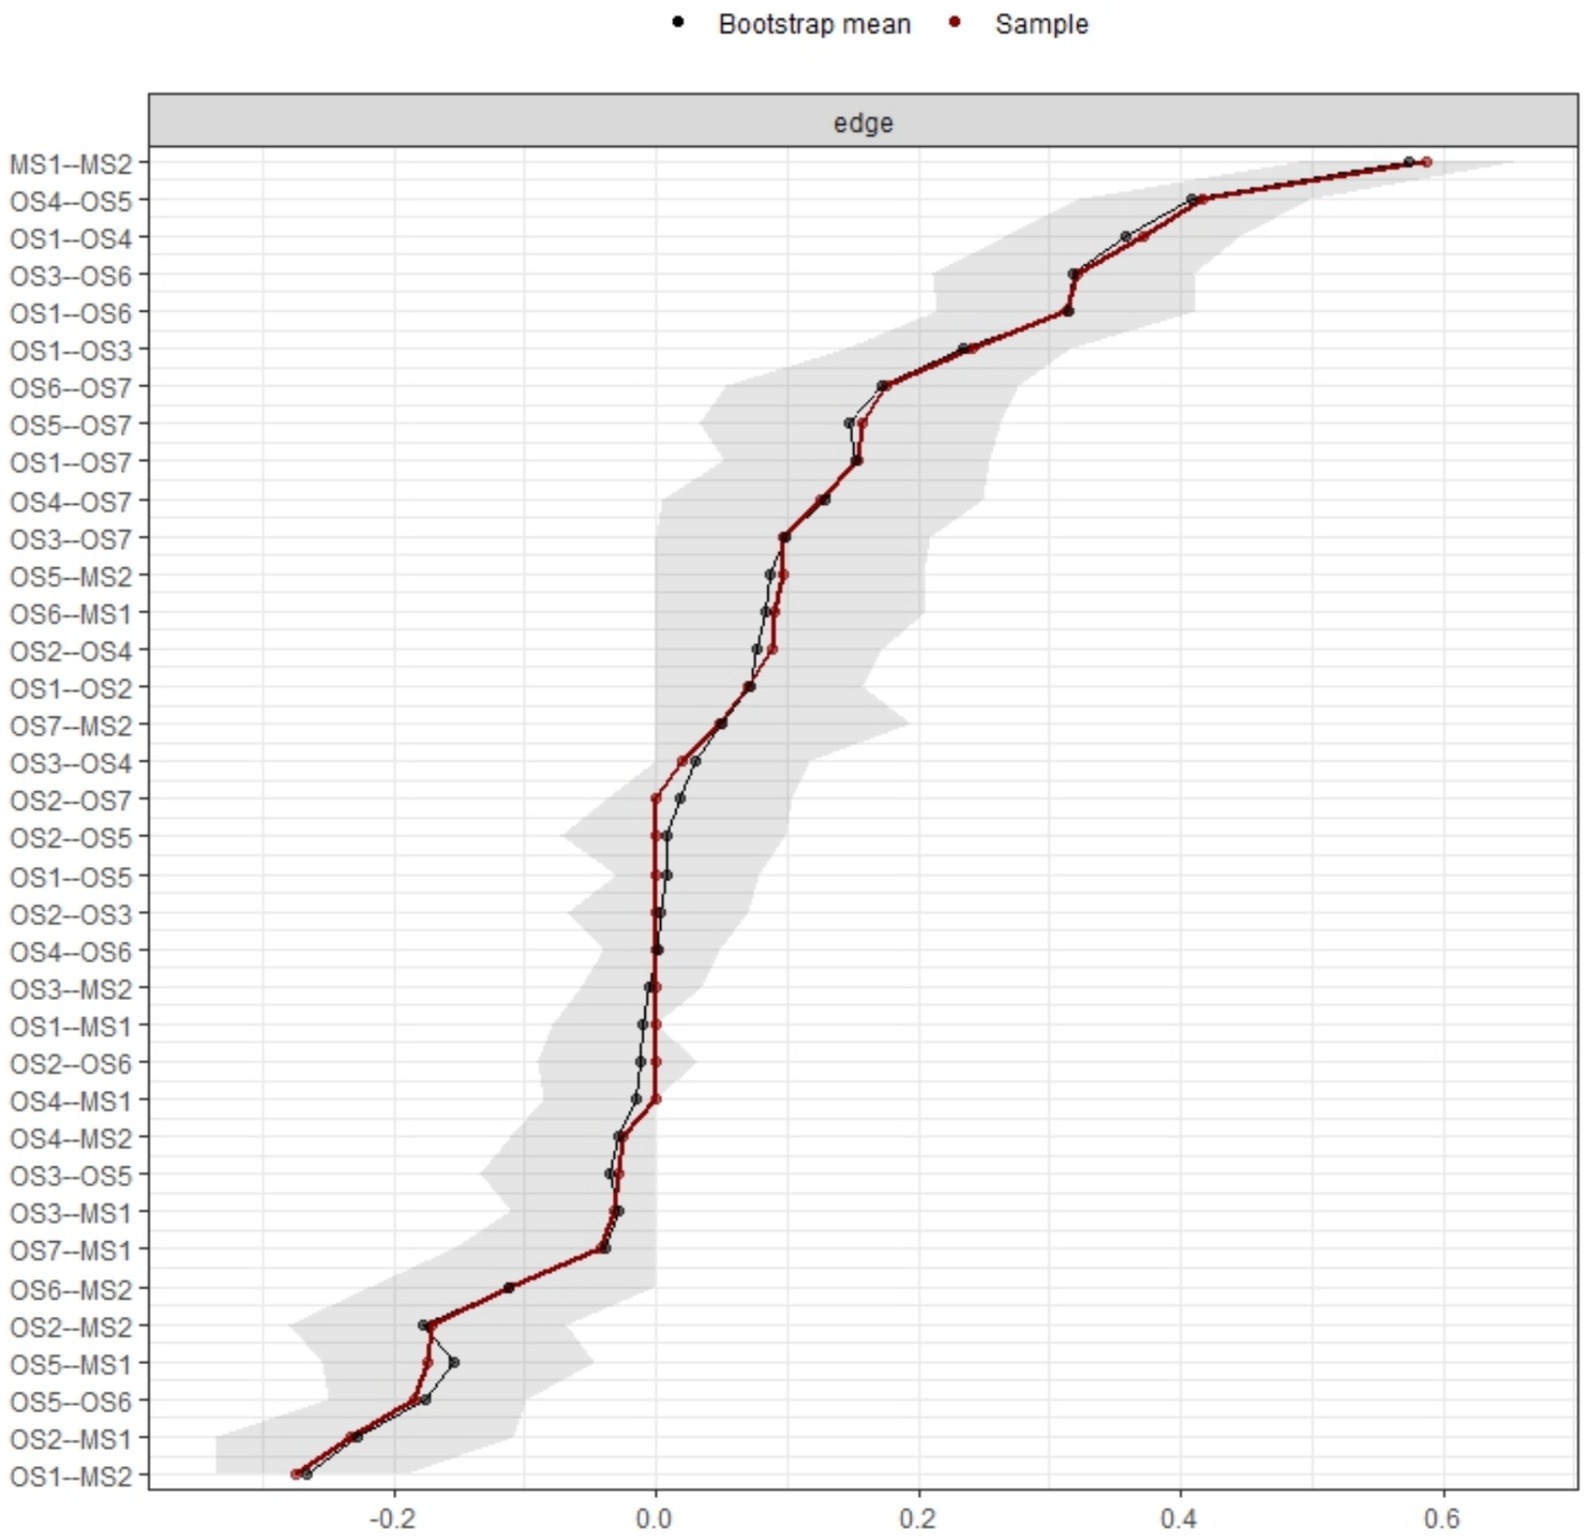
Figure 3. Bootstrapped confidence intervals of estimated edge-weights (top panel).
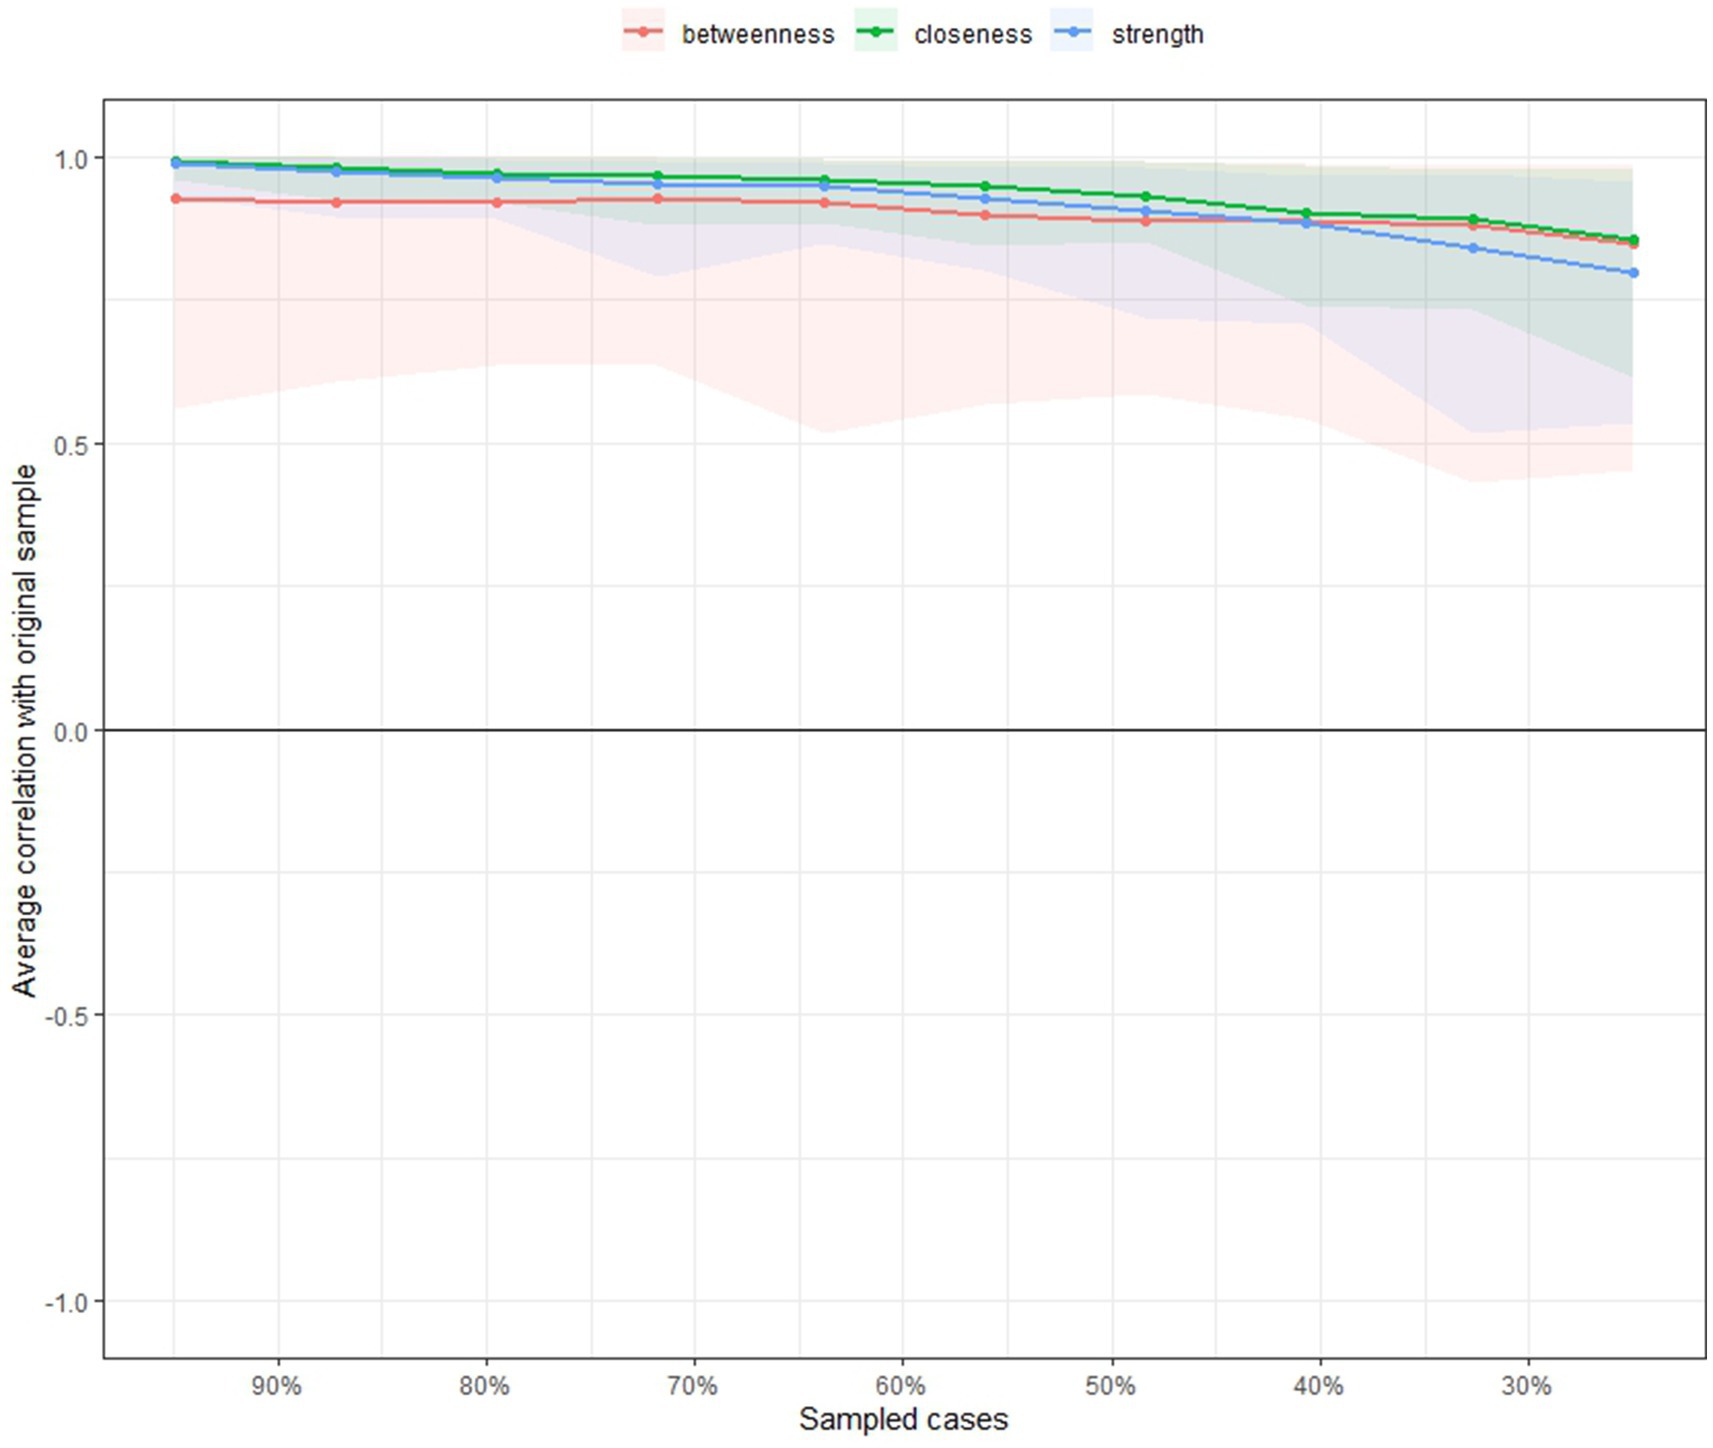
Figure 4. Stability of the network model.
There were no significant differences found between the LASSO networks for male and female participants in terms of global strength (Test statistic S: 0.655; p = 0.209) and structural invariance (Test statistic M: 0.219; p = 0.364) based on Network Comparison Test permutation tests.
DiscussionThis study presents a pioneering analysis of occupational stress and job satisfaction symptom networks within a sample of radiologists. The findings indicate variations in the strength of associations among different symptoms, highlighting that certain symptoms may have more significant connections than others. Additionally, individual factors contributing to occupational stress and job satisfaction are not uniformly crucial within the network. Notably, connections between symptoms within each domain were generally stronger than those between different domains. The stability of both network edges and the strength centrality metric lends confidence to the conclusions drawn from these cross-sectional networks. Overall, this study contributes valuable insights into the intricate relationships among occupational stress and job satisfaction symptoms among radiologists, shedding light on potential areas for intervention and support strategies.
It’s noteworthy that the strongest positive correlation is observed between organizational management and occupational interests, with a marginal weight of 0.588. This finding suggests that effective organizational management is closely intertwined with individual occupational interests in the work environment of radiologists. When doctors perceive the management of their organization to be efficient and supportive (30), they are more likely to find alignment between their daily work and personal interests, thereby enhancing job satisfaction and engagement (31, 32). Within the occupational stress group, another prominent finding is the strong connection between career development and interpersonal relationships (marginal weight of 0.471). This indicates that radiologists place a high value on maintaining positive relationships with colleagues and superiors while pursuing career advancement. Opportunities for career development and smooth interpersonal relationships may work together to alleviate doctors’ occupational stress and increase their job satisfaction. Therefore, organizations should strive to create a work environment that fosters both personal growth and team collaboration.
The exploration of centrality indices within the integrated network yields valuable insights into the key symptoms impacting both occupational stress and job satisfaction among radiologists. In particular, intrinsic satisfaction (OS1) emerges as a crucial node across all three centrality metrics, highlighting its foundational significance in shaping the work experience of radiologists. High levels of intrinsic satisfaction are linked to greater fulfillment and engagement at work, which can positively affect overall job satisfaction and help alleviate occupational stress (33, 34). The strong centrality of intrinsic satisfaction suggests that improving this aspect of work life could have far-reaching impacts on job satisfaction and well-being among radiologists. Similarly, extrinsic satisfaction (MS2) holds a prominent position in the network, closely following intrinsic satisfaction in terms of centrality. While extrinsic factors like salary and benefits are crucial drivers of job satisfaction, their impact may be secondary to the intrinsic rewards of the work itself (35). Nonetheless, the significant centrality of extrinsic satisfaction underscores its importance in the overall job satisfaction landscape, particularly concerning the core needs and expectations of radiologists in their professional domains.
This study faces several noteworthy limitations. Firstly, its cross-sectional design constrains result extrapolation and the ability to infer causality. Further longitudinal research is vital for a deeper understanding of the intricate relationship between occupational stress and job satisfaction symptoms. Secondly, participant recruitment via convenient sampling from a single location in China potentially limits the generalizability of findings to a broader, nationally representative sample. Thirdly, inherent reporting and recall biases may persist, underscoring the necessity for caution in result interpretation. In this study, we acknowledge a significant limitation, which is the absence of an international perspective on the same study cohort. Due to the scope of the research and resource constraints, we were unable to explore the international aspect in depth. In future research, we aim to broaden our perspective, including more international participation, to offer a more comprehensive and diverse analysis.
ConclusionIn conclusion, this study sheds light on the intricate relationships between occupational stress and job satisfaction among radiologists, emphasizing the importance of effective organizational management, interpersonal relationships, and opportunities for career development in mitigating stress and enhancing job satisfaction. Addressing the identified limitations through longitudinal research and diverse sampling methods is crucial for advancing our understanding in this area and for developing tailored interventions to support radiologists’ well-being and professional fulfillment.
Data availability statementThe original contributions presented in the study are included in the article/supplementary material, further inquiries can be directed to the corresponding author.
Ethics statementThe studies involving humans were approved by Approval for this study was obtained from the Ethics Committee of Nantong First People's Hospital with the identification number 2022KT262. The participants provided their informed consent. The studies were conducted in accordance with the local legislation and institutional requirements. The participants provided their written informed consent to participate in this study.
Author contributionsJJ: Writing – original draft, Writing – review & editing. BH: Writing – original draft, Writing – review & editing, Funding acquisition. SG: Writing – original draft. MS: Writing – original draft. XR: Writing – original draft.
FundingThe author(s) declare that financial support was received for the research, authorship, and/or publication of this article. Construction of translational medicine platform in prefecture-level cities (ZD2021059).
AcknowledgmentsThe authors thank all the participating radiologists and investigators in this study for their generous contribution.
Conflict of interestThe authors declare that the research was conducted in the absence of any commercial or financial relationships that could be construed as a potential conflict of interest.
Publisher’s noteAll claims expressed in this article are solely those of the authors and do not necessarily represent those of their affiliated organizations, or those of the publisher, the editors and the reviewers. Any product that may be evaluated in this article, or claim that may be made by its manufacturer, is not guaranteed or endorsed by the publisher.
References1. Kawthalkar, AS, Sequeira, RA, Arya, S, and Baheti, AD. Non-radiation occupational hazards and health issues faced by radiologists - a cross-sectional study of Indian radiologists. Indian J Radiol Imaging. (2019) 29:61–6. doi: 10.4103/ijri.IJRI_403_18
PubMed Abstract | Crossref Full Text | Google Scholar
2. Benjamin, JL, and Meisinger, QC. Ergonomics in the development and prevention of musculoskeletal injury in interventional radiologists. Tech Vasc Interv Radiol. (2018) 21:16–20. doi: 10.1053/j.tvir.2017.12.004
PubMed Abstract | Crossref Full Text | Google Scholar
3. Leung, J, Rioseco, P, and Munro, P. Stress, satisfaction and burnout amongst Australian and New Zealand radiation oncologists. J Med Imaging Radiat Oncol. (2015) 59:115–24. doi: 10.1111/1754-9485.12217
PubMed Abstract | Crossref Full Text | Google Scholar
4. Halpenny, D, O'Driscoll, D, and Torreggiani, WC. Ocular health among radiologists in the age of PACS: is it time for our profession to open its eyes to this issue in light of existing European legislation? Br J Radiol. (2012) 85:e1309–11. doi: 10.1259/bjr/27200799
PubMed Abstract | Crossref Full Text | Google Scholar
6. Sipos, D, Jenei, T, Kövesdi, OL, Novák, P, Freihat, O, Tollár, J, et al. Burnout and occupational stress among Hungarian radiographers working in emergency and non-emergency departments during COVID-19 pandemic. Radiography. (2023) 29:466–72. doi: 10.1016/j.radi.2023.02.013
Crossref Full Text | Google Scholar
7. Ugwu, AC, Erondu, OF, and Umeano, U. Psychosocial stress and its predictors among radiographers in South-Eastern Nigeria: peer reviewed original article (2011) 49:11–5.
8. Schaufeli, WB, and MJWB, Salanova. Burnout, boredom and engagement at the workplace. Wiley Blackwell (2014) 1:13–24.
9. Lai, Y, Saridakis, G, and Blackburn, R. Job stress in the United Kingdom: are small and medium-sized enterprises and large enterprises different? Stress Health. (2015) 31:222–35. doi: 10.1002/smi.2549
PubMed Abstract | Crossref Full Text | Google Scholar
10. Bakker, AB, and de Vries, JD. Job demands-resources theory and self-regulation: new explanations and remedies for job burnout. Anxiety Stress Coping. (2021) 34:1–21. doi: 10.1080/10615806.2020.1797695
PubMed Abstract | Crossref Full Text | Google Scholar
11. Scanlan, JN, and Still, M. Relationships between burnout, turnover intention, job satisfaction, job demands and job resources for mental health personnel in an Australian mental health service. BMC Health Serv Res. (2019) 19:62. doi: 10.1186/s12913-018-3841-z
PubMed Abstract | Crossref Full Text | Google Scholar
12. Kessler, SR, Lucianetti, L, Pindek, S, Zhu, Z, and PEJJOASP, S. Job satisfaction and firm performance: can employees' job satisfaction change the trajectory of a firm's performance? J Appl Soc Psychol. (2020) 50:563–72. doi: 10.1111/jasp.12695
Crossref Full Text | Google Scholar
13. Yu, X, Zheng, M, Cheng, X, Xu, B, Tao, Z, Ding, J, et al. Job satisfaction among Doctors from Jiangsu Province in China. Med Sci Monitor. (2018) 24:7162–9. doi: 10.12659/MSM.912712
PubMed Abstract | Crossref Full Text | Google Scholar
14. N, A. Health E. Job satisfaction and perceived stress among radiology technicians: a questionnaire survey in relation to sociodemographic and occupational risk factors. Int Arch Occup Environ Health. 94:1617–26. doi: 10.1007/s00420-021-01667-1
Crossref Full Text | Google Scholar
15. Yao, H, Wang, P, Tang, YL, Liu, Y, Liu, T, Liu, H, et al. Burnout and job satisfaction of psychiatrists in China: a nationwide survey. BMC Psychiatry. (2021) 21:593. doi: 10.1186/s12888-021-03568-6
PubMed Abstract | Crossref Full Text | Google Scholar
16. Sipos, D, Kövesdi, O, Raposa, B, Ferkai, L, Deutsch, K, Pandur, A, et al. Occupational stress levels among radiologists and radiographers in Hungary during the COVID-19 era. Healthcare. (2024) 12:160. doi: 10.3390/healthcare12020160
Crossref Full Text | Google Scholar
17. Sipos, D, Biro, AA, Busa, F, Freihat, O, Tollár, J, Pandur, AA, et al. Reduced burnout in medical and health science students during the pandemic COVID-19 - a follow-up study of a single institution in Hungary. BMC Med Educ. (2023) 23:893. doi: 10.1186/s12909-023-04867-0
PubMed Abstract | Crossref Full Text | Google Scholar
18. Borsboom, D. Cramer AOJJSSEP, Network Analysis: An Integrative Approach to the Structure of Psychopathology. Annu Rev Clin Psycho. (2013) 9:91–121. doi: 10.1146/annurev-clinpsy-050212-185608
Crossref Full Text | Google Scholar
19. Beard, C, Millner, AJ, Forgeard, MJ, Fried, EI, Hsu, KJ, Treadway, MT, et al. Network analysis of depression and anxiety symptom relationships in a psychiatric sample. Psychol Med. (2016) 46:3359–69. doi: 10.1017/S0033291716002300
PubMed Abstract | Crossref Full Text | Google Scholar
20. Costantini, G, Epskamp, S, Borsboom, D, Perugini, M, Mttus, R, Waldorp, LJ, et al. State of the aRt personality research: A tutorial on network analysis of personality data in R. J Res Person. (2015) 54:13–29. doi: 10.1016/j.jrp.2014.07.003
Crossref Full Text | Google Scholar
21. Weiss, D, Dawis, RV, and England, GW. Manual for the minnesota satisfaction questionnaire. Minnesota Studies in Vocational Rehabilitation. (1967) 63:122–129.
22. Liu, W, Zhao, S, Shi, L, Zhang, Z, Liu, X, Li, L, et al. Workplace violence, job satisfaction, burnout, perceived organisational support and their effects on turnover intention among Chinese nurses in tertiary hospitals: a cross-sectional study. BMJ Open. (2018) 8:e019525. doi: 10.1136/bmjopen-2017-019525
PubMed Abstract | Crossref Full Text | Google Scholar
23. Yan, L, Jing-Xiang, MA, Wen-Qiong, C, Min, LI, Li-Ying, WU, Li-Yan, YE, et al. Relationship between Perception of Job Characteristics and Job Satisfaction of Pediatric Nurses. Journal of Nursing. (2013) 72:12–24.
24. Chen, J. The development and application of the clinical Physicians' sources of work stress scale. Shanghai Normal University (2009).
25. Lauritzen, SL. Graphical models. International Encyclopedia of Education (1996).
27. Foygel, R, and Drton, M. Extended bayesian information criteria for gaussian graphical models. Adv Neural Inform Process Syst. (2010) 23:604–12.
28. Epskamp, S, Borsboom, D, and Fried, EI. Estimating psychological networks and their accuracy: a tutorial paper. Behav Res Methods. (2018) 50:195–212. doi: 10.3758/s13428-017-0862-1
PubMed Abstract | Crossref Full Text | Google Scholar
29. van Borkulo, CD, van Bork, R, Boschloo, L, Kossakowski, JJ, Tio, P, Schoevers, RA, et al. Comparing network structures on three aspects: a permutation test. Psychol Methods. (2017) 28:1273–85. doi: 10.1037/met0000476
Crossref Full Text | Google Scholar
30. Adams, A, and Bond, S. Hospital nurses' job satisfaction, individual and organizational characteristics. J Adv Nurs. (2000) 32:536–43. doi: 10.1046/j.1365-2648.2000.01513.x
Crossref Full Text | Google Scholar
31. Fu, J, Sun, W, Wang, Y, Yang, X, and Wang, L. Improving job satisfaction of Chinese doctors: the positive effects of perceived organizational support and psychological capital. Public Health. (2013) 127:946–51. doi: 10.1016/j.puhe.2012.12.017
PubMed Abstract | Crossref Full Text | Google Scholar
32. Hashimoto, S, Motozawa, Y, and Mano, T. Effect of the Japanese medical office system on job satisfaction, loyalty, engagement, and organizational commitment of medical practitioners: a survey of cardiologists in the acute care setting. BMC Health Serv Res. (2024) 24:139. doi: 10.1186/s12913-023-10507-6
PubMed Abstract | Crossref Full Text | Google Scholar
33. Prasad, KDV, Vaidya, R, and Rani, R. Remote working and occupational stress: effects on IT-enabled industry employees in Hyderabad metro. India Front Psychol. (2023) 14:1069402. doi: 10.3389/fpsyg.2023.1069402
PubMed Abstract | Crossref Full Text | Google Scholar
34. Benitez, M, Orgambídez, A, Cantero-Sánchez, FJ, and León-Pérez, JM. Harmonious passion at work: personal resource for coping with the negative relationship between burnout and intrinsic job satisfaction in service employees. Int J Environ Res Public Health. (2023) 20:1010. doi: 10.3390/ijerph20021010
PubMed Abstract | Crossref Full Text | Google Scholar
35. Goetz, K, Campbell, SM, Broge, B, Dörfer, CE, Brodowski, M, and Szecsenyi, J. The impact of intrinsic and extrinsic factors on the job satisfaction of dentists. Commun Dent Oral Epidemiol. (2012) 40:474–80. doi: 10.1111/j.1600-0528.2012.00693.x
留言 (0)