
記住我


Hypertension is an independent risk factor for cardiovascular disease; it can lead to a variety of diseases, including stroke, coronary artery disease, aortic aneurysm, renal failure, heart failure, and death. A large screening study based on 17 million adults in China found the prevalence of hypertension to be 37.2% (1). Therefore, it is particularly important to identify predictors of hypertension and to develop policies to prevent the development of cardiovascular disease.
Serum albumin is a unique multifunctional protein that is synthesized by liver parenchymal cells. As the most abundant protein in plasma, serum albumin accounts for approximately 50% of total plasma protein (2). Serum albumin maintains normal permeability of the microvascular wall, reduces blood viscosity, and inhibits platelet aggregation (3, 4). A longitudinal study by Schalk showed that older adults with decreased serum albumin concentrations, even within the normal range, may be at increased risk for cardiovascular disease (5). In addition, a study of 354 patients with essential hypertension showed an inverse correlation between worsening circadian blood pressure and the serum albumin concentration (6). A 4-year longitudinal study in Japan found that a reduced serum albumin concentration was an important predictor of hypertension (7). A cross-sectional study conducted in Norway reported that serum albumin concentrations were positively associated with systolic and diastolic blood pressure in healthy subjects (8). Based on the above findings, it is reasonable to assume that long-term changes in serum albumin concentrations have a differential effect on the development of hypertension. In this study, adults aged 30–60 years who underwent physical examinations at Xiaotangshan Hospital in Beijing from 2009 to 2016 were enrolled to investigate the correlation between trajectories of changes in serum albumin concentrations and hypertension.
2 Methods 2.1 Study populationThis cohort included adults aged 30–60 years who underwent a comprehensive health examination at Beijing Xiaotangshan Hospital between 2009 and 2016 based on ≥3 health examinations and excluded participants with hypertension, cancer, stroke, coronary artery disease, myocardial infarction, renal disease, and liver disease at baseline, with the final 11,946 participants (6,644 males and 5,302 females) constituting the longitudinal cohort of this study.
The study was approved by the Ethics Committee of Beijing Xiaotangshan Hospital (No. 202006), and the study procedures were conducted in accordance with the 1964 Declaration of Helsinki. The requirement for informed consent was waived because only routine health screening data were used for the analysis.
2.2 Data collectionData on the subjects' demographic characteristics (age, sex), medical history and medications were collected by standardized face-to-face questionnaires, while anthropometric, clinical and biochemical parameters were collected by trained physicians and nurses.
Smoking status (current and/or at least 100 cigarettes in lifetime) and alcohol consumption (Drinking alcohol 12 or more times at different times last year, ≥25 g/day for men and ≥15 g/day for women) were recorded. Trained physicians and nurses measured participants' height, weight, resting heart rate, systolic blood pressure and diastolic blood pressure. The subjects' height and weight were measured while they were dressed casually and without shoes. Body mass index was calculated by dividing body weight (kg) by height squared (m2). After at least 5 min of rest, the systolic and diastolic blood pressures of the participants' arms were measured three times with an electronic sphygmomanometer (HEM-770AFuzzy, Omron, Japan) in a seated position, with a 2-min interval between each blood pressure measurement.
Venous blood samples were collected after an overnight fast of at least 8 h. Serum albumin was measured using the bromophenol green contrast method (9). Serum uric acid, white blood cell count creatinine (WBC), total cholesterol, triglyceride, high-density lipoprotein cholesterol (HDL-C), and low-density lipoprotein cholesterol (LDL-C) concentrations were measured using an automated biochemistry analyzer (Model 7600; Hitachi, Tokyo, Japan). Fasting plasma glucose was measured by the glucose dehydrogenase method (Merck, Darmstadt, Germany). Alanine aminotransferase (ALT), aspartate aminotransferase (AST) and blood urea nitrogen concentrations were measured with an automated analyzer.
2.3 DefinitionsHypertension was defined by any of the following criteria: (1) self-reported physician diagnosis of hypertension, (2) the use of antihypertension medication within the past 2 weeks, or (3) systolic blood pressure ≥140 mm Hg and/or diastolic blood pressure <90 mm Hg (10).
Prehypertension was defined as subjects with systolic blood pressure ≥120 mmHg and <139 mmHg and/or diastolic blood pressure ≥80 mmHg and <89 mmHg (11).
2.4 Statistical analysisData management and analysis were performed using StataS/E version 15 (StataCorp, TX) R software version 4.0.5 (www.r-project.org). A P-value of 0.05 was considered statistically significant.
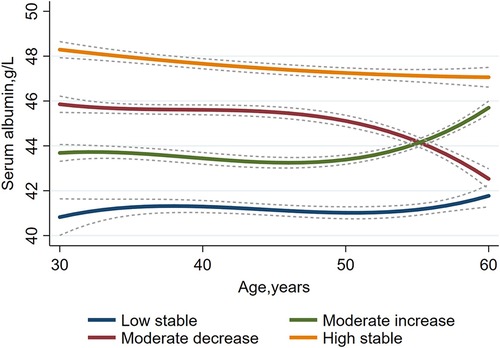
We used group-based trajectory modeling (GBTM) with age as the time scale to explore joint longitudinal changes in serum albumin. The trajectories of study subjects were modeled and grouped using Stata's Proc Traj program (12), a semiparametric mixture model that allows for joint modeling of trajectories for multiple outcomes, which assumes that each participant belongs to only one group and that each group has a different trajectory. Various GBTM models were run before selecting the best model regarding the number of groups and trajectory shapes (constant, linear, quadratic, cubic). First, to determine the optimal number of different groups to describe the heterogeneity in the longitudinal development of serum albumin, various models using 1–7 different groups were fitted, and the model with the least Bayesian information criterion (BIC) (13), mean posterior probability not less than 0.7 and sufficient sample size in each multitrajectory group (>5% of the samples) was selected as the best model, resulting in 4 groups of serum albumin trajectories. Figure 1 shows the four different trajectories of the serum albumin concentration.
Figure 1. A group-based trajectory model to investigate serum albumin trajectories in a Chinese population aged 30–60 years (n = 11,946).
Subsequent data analysis was performed using R software, and continuous variables that did not follow a normal distribution were described by the median [interquartile range (IQR)] and analyzed using the Mann‒Whitney U-test. Categorical variables were expressed as counts (%) and analyzed using the χ2 test or Fisher's exact test. Student's t-test was used to compare continuous variables across trajectories, and the Kruskal‒Wallis test or χ2 test was used to compare the incidence of hypertension across trajectory groups. The time to follow-up was defined as the date from first entry into the cohort to confirmation of follow-up or hypertension diagnosis. Odds ratios (ORs) and 95% confidence intervals (CIs) for hypertension were estimated using multivariate logistic regression models with low stability as the reference group to determine differences in the risk of hypertension across trajectory groups.
The covariates included all baseline variables, and three logistic regression models were fitted: Model 1 (unadjusted), Model 2 (adjusted for age, sex, and follow-up time), and Model 3 (further adjusted for smoking, alcohol consumption, diabetes, obesity, body mass index, resting heart rate, systolic and diastolic blood pressure, fasting plasma glucose, triglycerides, total cholesterol, uric acid, blood urea nitrogen, creatinine, LDL-C, HDL-C, WBC, ALT, and AST). In addition, we performed sensitivity analyses excluding subjects who were prehypertension at baseline and excluding subjects diagnosed with hypertension two years before follow-up to assess the robustness of the logistic regression results. We also performed stratified analyses by age, sex, and weight status (normal vs. overweight).
Cumulative average, standard deviation, baseline and end-stage serum albumin concentrations during 2009–2016 were ranked from smallest to largest and divided into five equal quintiles (Q1–Q5). Baseline-stage serum albumin: <42.00, 42.00 to <44.00, 44.00 to <45.10, 45.10 to <47.00, and ≥47.00. Standard deviation serum albumin: <1.516, 1.516 to <2.050, 2.050 to <2.417, 2.417 to <3.000, and ≥3.000. Cumulative average serum albumin: <42.737, 42.737 to <44.033, 44.033 to <44.975, 44.975 to <46.267, and ≥46.267. End-stage serum albumin: <43.00, 43.00 to <45.00, 45.00 to <46.00, 46.00 to <47.00, and ≥47.00. We added details to the study by examining serum albumin concentrations at baseline, cumulative average serum albumin concentrations (cumulative serum albumin concentration from baseline to the last year of follow-up divided by the number of years of follow-up), end-stage serum albumin concentrations in the last year of follow-up, and standard deviations (all available serum albumin concentrations from 2009 to 2016).
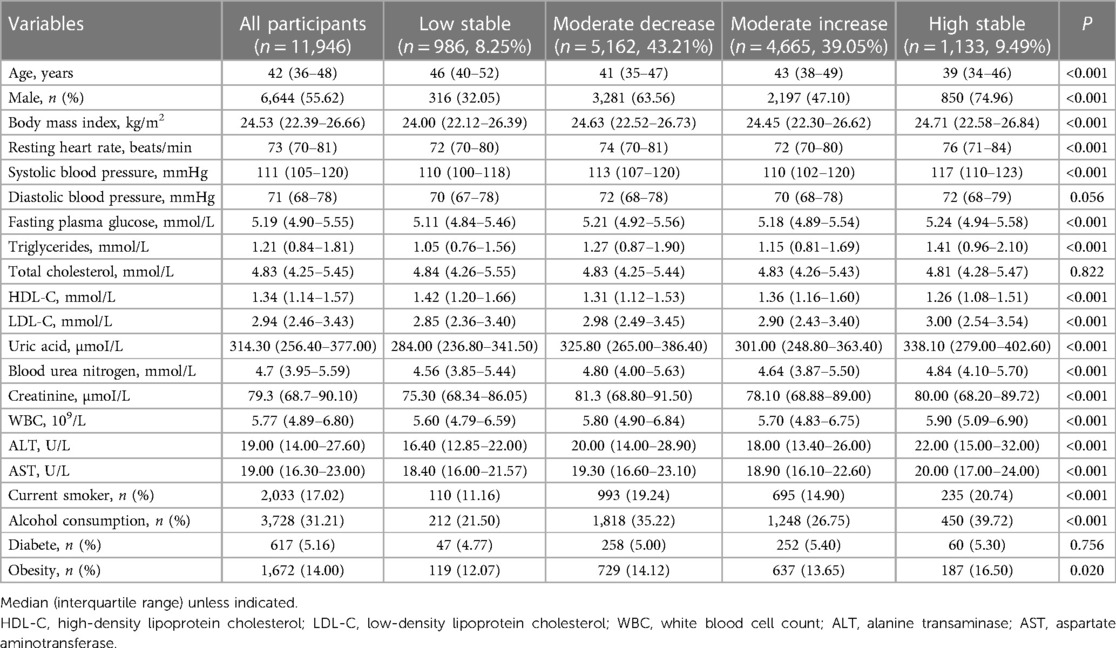
3 Results 3.1 Baseline characteristics of the trajectory groupsThe study cohort included 11,946 subjects without hypertension at baseline, aged 42 years (IQR, 36.00–48.00 years), 55.62% of whom were male. A total of 1,537 (12.87%) hypertension events occurred during a mean follow-up period of 4.30 years. Table 1 summarizes the baseline characteristics of subjects in the 4 serum albumin change trajectory groups, including sex, age, smoking, alcohol consumption, obesity rate, body mass index, resting heart rate, systolic blood pressure, fasting plasma glucose, triglycerides, uric acid, blood urea nitrogen, creatinine, LDL-C, HDL-C, WBC, ALT, and AST (ptrend <0.05). Diastolic blood pressure, total cholesterol, and prevalence of diabetes did not differ between the 4 trajectory groups. Supplementary Table S1 demonstrates the baseline characteristics grouped by the occurrence of hypertension events. Age, male proportion, smoking, alcohol consumption, prevalence of diabetes, obesity rate, body mass index, resting heart rate, systolic and diastolic blood pressure, fasting plasma glucose, triglycerides, total cholesterol, uric acid, blood urea nitrogen, creatinine, LDL-C, WBC, ALT, and AST were higher in hypertension patients than in nonhypertension patients (ptrend <0.01), whereas HDL-C concentrations in hypertension patients were significantly lower than those in nonhypertension patients (ptrend <0.001).
Table 1. Baseline characteristics of study variables by different trajectories of serum albumin.
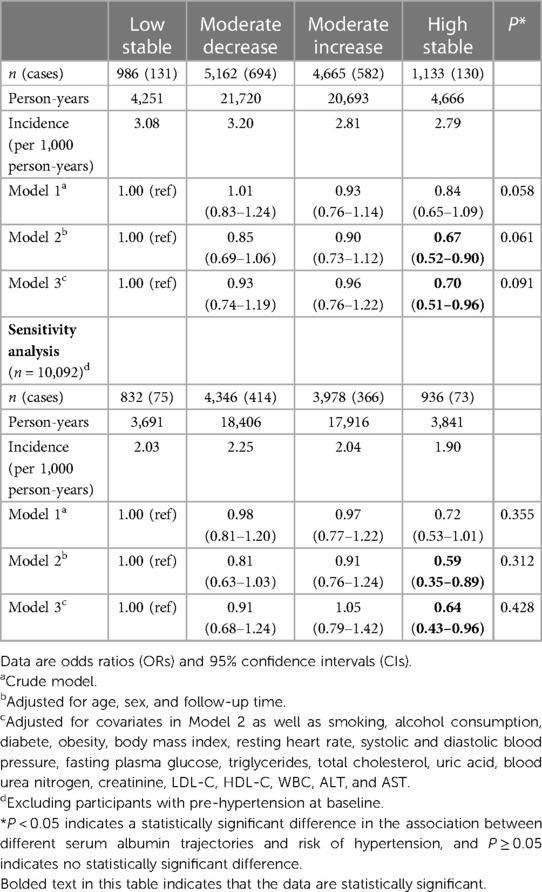
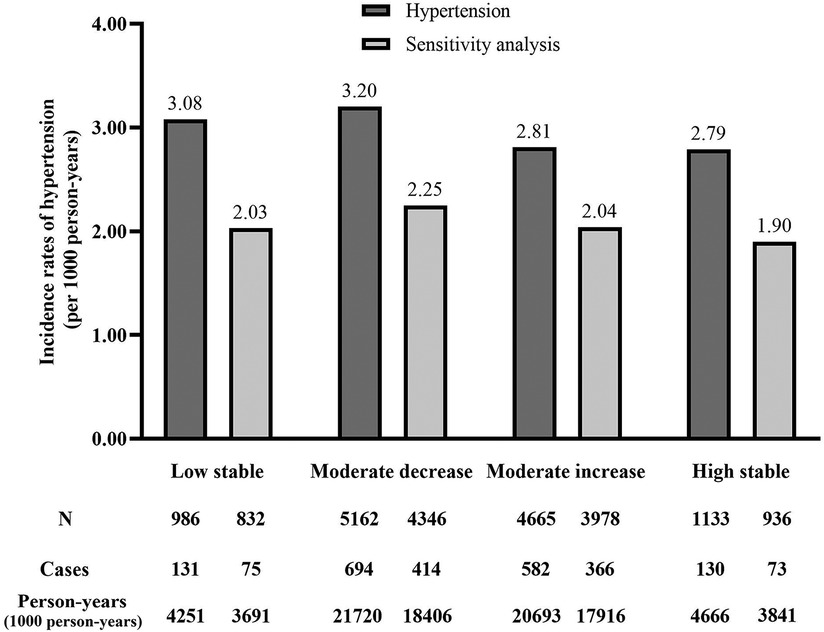
3.2 Association between the trajectory of change in serum albumin concentrations and the risk of hypertensionLogistic regression models were used to estimate the association between the 4 serum albumin trajectory groups and the risk of hypertension (Models 1–3; Table 2). In the crude model, the risk of hypertension decreased with a high baseline. High serum albumin levels reduced the risk of hypertension with a low stable trajectory as a control, moderate decrease trajectory (OR, 1.01, 95% CI, 0.83–1.24), moderate increase trajectory (OR, 0.93, 95% CI, 0.76–1.14), and high stable trajectory (OR, 0.84, 95% CI, 0.65–1.09) (P = 0.058) (Table 2). After adjusting the model for age and sex (Model 2), the serum albumin high stable trajectory was significantly associated with a reduction in the incidence of hypertension (OR, 0.67, 95% CI, 0.52–0.90). Further adjustment for smoking, alcohol consumption, diabetes, obesity, body mass index, resting heart rate, systolic and diastolic blood pressure, fasting plasma glucose, triglycerides, total cholesterol, uric acid, blood urea nitrogen, creatinine, LDL-C, HDL-C, WBC, ALT, and AST (Model 3) only slightly weakened the association but did not affect the significant association between the serum albumin high stable trajectory and the incidence of hypertension (OR, 0.70, 95% CI, 0.51–0.96) (P < 0.001). In the sensitivity analysis, after excluding subjects with prehypertension at baseline, the association between a high stable trajectory of serum albumin concentrations and the risk of hypertension remained statistically significant in the fully adjusted model (OR, 0.66, 95% CI, 0.44–0.98) but was not significant in the moderate decrease and moderate increase trajectories. Figure 2 depicts the person-year incidence of hypertension before and after the sensitivity analysis was performed.
Table 2. Association between serum albumin change trajectory and risk of hypertension.
Figure 2. Incidence rates of hypertension in different serum albumin category groups (per 1,000 person-years). Hypertension indicates the annual incidence of hypertension in person-years. Sensitivity analysis indicates the annual incidence of hypertension in person-years after performing sensitivity analysis.
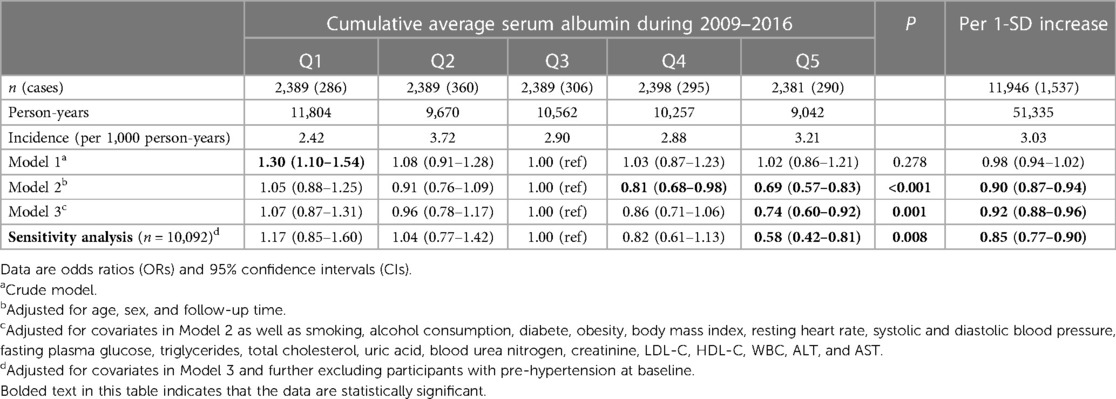
3.3 Association between the cumulative average serum albumin during 2009–2016 and the risk of hypertensionIn the crude model, the risk of hypertension decreased with an increase in cumulative mean serum albumin. High serum albumin levels reduced the risk of hypertension, using Q3 as a control, Q1 (OR, 1.30, 95% CI, 1.10–1.54), Q2 (OR, 1.08, 95% CI, 0.91–1.28), Q4 (OR, 1.03, 95% CI, 0.87–1.23) and Q5 (OR, 1.02, 95% CI, 0.86–1.21) (ptrend = 0.278) (Table 3). After adjusting the model for age and sex (Model 2), high cumulative mean serum albumin levels remained significantly associated with a reduction in the incidence of hypertension. Further adjustment for smoking, alcohol consumption, diabetes, obesity, body mass index, resting heart rate, systolic and diastolic blood pressure, fasting plasma glucose, triglycerides, total cholesterol, uric acid, blood urea nitrogen, creatinine, LDL-C, HDL-C, WBC, ALT, and AST (Model 3) only slightly weakened the association but did not affect the significant association between cumulative mean serum albumin. Significant associations between cumulative mean serum albumin and the occurrence of hypertension were Q1 (OR, 1.07, 95% CI, 0.87–1.31), Q2 (OR, 0.96, 95% CI, 0.78–1.17), Q4 (OR, 0.86, 95% CI, 0.71–1.06) and Q5 (OR, 0.74, 95% CI, 0.60–0.92) (ptrend = 0.001). With each 1-SD increase in cumulative mean serum albumin, the risk of hypertension decreased by 8% (OR, 0.92, 95% CI, 0.88–0.96). In the sensitivity analysis, after excluding subjects with prehypertension at baseline, the association between the cumulative mean serum albumin concentration and the risk of hypertension remained significant in the fully adjusted Model Q5 (OR, 0.58, 95% CI, 0.42–0.81) (ptrend = 0.008), with each 1-SD increase in cumulative mean serum albumin associated with a 15% reduction in the risk of hypertension (OR, 0.85, 95% CI, 0.77–0.90).
Table 3. Association between cumulative average serum albumin during 2009–2016 and risk of hypertension.
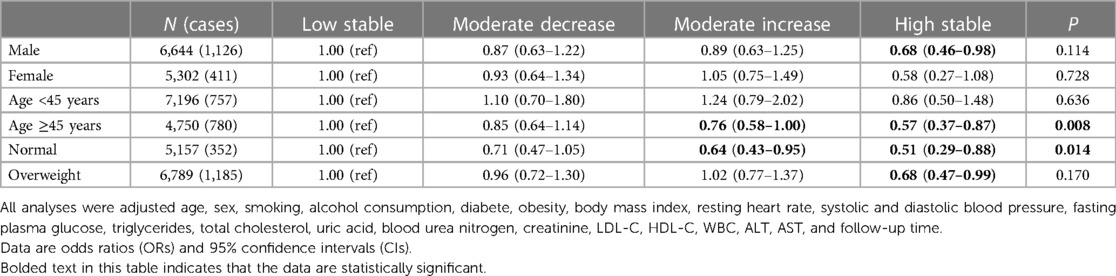
3.4 Stratified analysisStratified analyses were performed by sex, age, and whether or not subjects were overweight. After full adjustment of the model, subjects with normal weight and those ≥45 years of age had a significantly lower risk of hypertension at moderate increase (P = 0.053 or 0.026) and high stable trajectories (P = 0.011 or 0.016). In males and overweight subjects, the risk of hypertension was significantly lower in the high stable trajectory group (P = 0.038 or 0.044), using a low stable trajectory as a reference. Females and age <45 years did not significantly reduce the occurrence of hypertension in any of the trajectory groups (Table 4). The incidence of hypertension was significantly higher in males, subjects aged ≥45 years, and overweight subjects than in females, subjects aged <45 years, and normal weight subjects (Supplementary Table S2).
Table 4. Association between serum albumin change trajectory and risk of hypertensive stratified by sex, age and BMI.
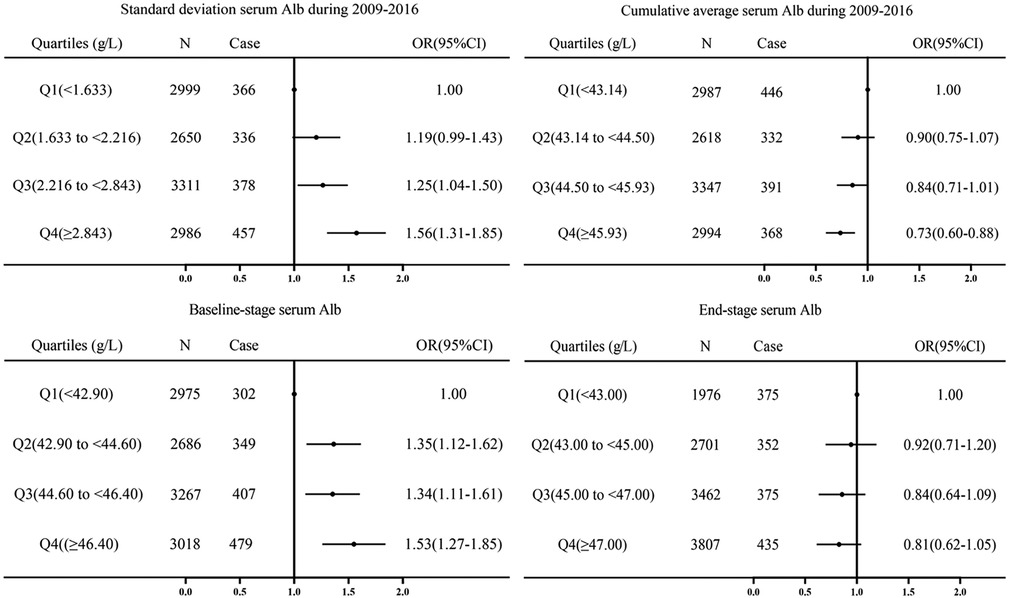
Cumulative average, standard deviation, baseline and end-stage serum albumin concentrations during 2009–2016 were ranked from smallest to largest and divided into five equal quintiles (Q1-Q5), with Q3 as the control. After full adjustment using the model, cumulative average serum albumin values were associated with increased hypertension prevalence during 2009–2016 for Q5 (OR, 0.74, 95% CI, 0.60–0.92). With serum albumin standard deviation Q5 (OR, 1.26, 95% CI, 1.04–1.54) (P < 0.001). Q1 of serum albumin at baseline was associated with an decreased incidence of hypertension (OR, 0.76, 95% CI, 0.61–0.95) (P < 0.001). There was no significant relationship between the end-stage serum albumin concentration and the prevalence of hypertension (Figure 3). Cumulative average, standard deviations, baseline-stage and end-stage serum albumin concentrations were then stratified by sex, age and body mass index (Supplementary Table S3).
Figure 3. Cumulative average, standard deviation, baseline-stage and end-stage of serum albumin from 2009 to 2016 were divided into quintiles, with Q3 as the control group, and logistic regression adjusted for sex, age, smoking, alcohol consumption, diabete, obesity, body mass index, resting heart rate, systolic and diastolic blood pressure, fasting plasma glucose, triglycerides, total cholesterol, uric acid, blood urea nitrogen, creatinine, LDL-C, HDL-C, WBC, ALT, AST, and follow-up time after posterior odds ratios (ORs) and 95% CIs.
The maximum, minimum, baseline-stage, end-stage, cumulative average and standard deviations of serum albumin concentrations from 2009 to 2016 were described as the median (IQR) according to the different trajectory groups. As shown in Supplementary Table S4, there were statistically significant differences (P < 0.001) in the maximum, minimum, baseline-stage, end-stage, cumulative average and standard deviations of serum albumin levels in the different trajectory groups.
4 DiscussionTo our knowledge, this is the first study to examine the trajectories of serum albumin concentrations and the risk of hypertension in China. In this study, we identified different trajectories of serum albumin concentrations in adults by a group-based trajectory modeling approach. The traditional study approach of dividing participants into subgroups based on various characteristics, while usually ignoring population heterogeneity, may lead to inability to accurately identify internal relationships. There may be unusually large individual differences in serum albumin concentration levels and dynamics over time, and therefore dynamic trajectories of serum albumin concentrations may more accurately predict the risk of hypertension.
Overall, in this retrospective cohort study from 2009 to 2016 at Beijing Xiaotangshan Hospital, four different trajectories of serum albumin concentrations were observed in normal adults. Notably, the risk of developing hypertension was significantly lower in the high stable trajectory groups compared to the low stable group. This association was independent of sex, age, and whether overweight, and remained significant in male, age ≥45 years, normal weight, and overweight subjects. Sensitivity analyses revealed an association between high stable trajectory and prehypertension after full adjustment for covariates, with increases in the standard deviation of serum albumin concentrations and baseline serum albumin concentrations significantly associated with an increased probability of developing hypertension and increases in the cumulative mean of serum albumin concentrations significantly associated with a decreased probability of developing hypertension.
The cumulative incidence of hypertension in the study subjects was 12.87%, similar to the 9.77% observed in Liaoning, China, over a period of 4–6 years (14). The results of this study suggest that the incidence of hypertension is lower when serum albumin is in the high stability group. Previous cross-sectional studies have described the association between serum albumin and the risk of hypertension, and it has been suggested that serum albumin concentrations have been identified as protective factors against cardiovascular disease and are involved in several biologically active processes, such as maintenance of blood colloid permeation, transport and binding of various metabolites in vivo, and extracellular oxidative defense (2, 15). It has been suggested that serum albumin may influence blood pressure through a positive correlation mechanism with potassium concentration, which leads to a negative correlation between serum albumin and aldosterone (16). A positive relationship between albumin and potassium may inhibit the renin–angiotensin–aldosterone system, thus preventing hypertension development (17). There are also studies suggesting that the association between serum albumin and blood pressure may be linked to the binding of serum albumin to tryptophan, which has been shown to lower blood pressure (18–22), but tryptophan has not been shown to have a significant effect on blood pressure in other studies (23). It has also been suggested that serum albumin concentrations may affect intravascular osmotic pressure, which in turn affects blood pressure (24). At the same time, previous longitudinal studies have described an association between serum albumin trajectories and risk of hypertension. A five-year retrospective follow-up study in Japan found a positive association between serum albumin and serum potassium and a negative association with the development of hypertension (16). In a longitudinal cohort study in Korea, hypoalbuminemia was an important predictor of early hypertension progression (25).
In this study, our analysis of sex differences showed that the relationship between the four serum albumin concentration trajectories and hypertension varies by sex. Specifically, male subjects were significantly more likely to have hypertension than female subjects, and the incidence of hypertension was significantly lower in the high stable trajectory group, using the low stable trajectory as a reference group. Although hypertension occurs in both males and females, it tends to be significantly higher in males than in females in the same age group (26, 27). A longitudinal study of 3,872 participants in Japan found that for every standard deviation increase in the serum albumin concentration, the risk of hypertension decreased in both males and females (7). Our study showed that the trajectory of serum albumin concentrations was only associated with the incidence of hypertension in males. We found a higher prevalence of hypertension in subjects ≥45 years of age and a stronger association between moderate increase and high stable trajectories and hypertension risk in subjects ≥45 years of age, indicating a significant decrease in hypertension prevalence. In humans, serum albumin levels in both males and females peak at age 20 and begin to decline with age, according to a cross-sectional study in the UK (28), the difference between males and females may be hormonal. The results of this study showed that in normal weight subjects, there was a difference between moderate increase and high stable serum albumin level trajectories and a low incidence of hypertension, while among overweight subjects, there was a difference between a high stable trajectory and a low incidence of hypertension. People who are classified as overweight are more likely to have high blood pressure than those who are not. From 2009 to 2016, the cumulative mean and annual increases in serum albumin concentrations increased, and these increases were associated with the incidence of hypertension. A trend study conducted in Japan between 1980 and 2010 showed a 1.5-fold increase in the effect of being overweight on high blood pressure compared to normal weight people (29). In a study of 131,395 Asian adults, overweight was associated with high blood pressure in all age groups (30), which is consistent with the results of the current study. Overweight and obesity have been linked to several diseases, including chronic inflammation (31). In addition, inflammation may be a major cause of the decrease in serum albumin concentrations (32). Since inflammation is one of the known pathophysiological mechanisms of hypertension, one theory is that low serum albumin is associated with hypertension.
Although the underlying mechanisms linking serum albumin trajectories to the development of hypertension have not been fully elucidated, this finding provides some evidence that the optimal state of serum albumin may be a pattern of high stability within the normal range. Hypertension, as the most important risk factor for cardiovascular disease, causes great physical discomfort to patients and imposes a huge economic burden on patients and their families. Therefore, it is extremely important to propose early interventions for preventive measures against risk factors.
The most important advantage of our study is the large sample size and longitudinal retrospective cohort study design. There are limitations to the study that should be noted. First, the number of patients with hypertension was relatively small during the study period (7 years). Further studies are needed to investigate changes in serum albumin concentrations over time. Second, because the data came from highly educated employees and the proportion of males was high, the study was generally not representative. Therefore, more research is needed in the future to validate our findings.
5 ConclusionIn summary, our population-based trajectory modeling approach identified four different trajectories of serum albumin concentrations in Chinese adults. We found that a moderate increase in serum albumin concentrations and a high stable trajectory were significantly associated with a reduced hypertension risk in subjects ≥45 years of age and of normal weight. A high stable trajectory of serum albumin concentrations was significantly associated with a reduced risk of hypertension in both males and overweight subjects.
Data availability statementThe original contributions presented in the study are included in the article/Supplementary Material, further inquiries can be directed to the corresponding authors.
Ethics statementThe studies involving humans were approved by Department of Health Management, Beijing Xiaotangshan Hospital, Beijing, China. The studies were conducted in accordance with the local legislation and institutional requirements. The participants provided their written informed consent to participate in this study. Written informed consent was obtained from the individual(s) for the publication of any potentially identifiable images or data included in this article.
Author contributionsYL: Conceptualization, Software, Writing – original draft, Writing – review & editing. SX: Methodology, Project administration, Writing – review & editing. HC: Writing – review & editing. SD: Writing – review & editing. JH: Writing – review & editing. XC: Writing – review & editing. JZ: Writing – review & editing. SL: Writing – review & editing. JL: Writing – review & editing. FH: Writing – review & editing. YL: Writing – review & editing. CW: Writing – review & editing.
FundingThe authors declare financial support was received for the research, authorship, and/or publication of this article.
Supported by the Nanshan Medical Key Discipline Construction Funding (Noninfectious Chronic Disease); Nanshan Regional Discipline Alliance Construction Project (Geriatrics and Osteoporosis Control); Nanshan Health Science and Technology Plan (NS2021051, NS2022052, NS2023121, NS2023110, NS2023111, NS2023122); Shenzhen science and technology project (JCYJ20210324125810024) and Natural Science Foundation of Guangdong Province (2022A1515011273).
AcknowledgmentsWe thank the colleagues in the Beijing Xiaotangshan Hospital for the data collection.
Conflict of interestThe authors declare that the research was conducted in the absence of any commercial or financial relationships that could be construed as a potential conflict of interest.
Publisher's noteAll claims expressed in this article are solely those of the authors and do not necessarily represent those of their affiliated organizations, or those of the publisher, the editors and the reviewers. Any product that may be evaluated in this article, or claim that may be made by its manufacturer, is not guaranteed or endorsed by the publisher.
Supplementary materialThe Supplementary Material for this article can be found online at: https://www.frontiersin.org/articles/10.3389/fcvm.2024.1325899/full#supplementary-material
References1. Lu J, Lu Y, Wang X, Li X, Linderman GC, Wu C, et al. Prevalence, awareness, treatment, and control of hypertension in China: data from 1·7 million adults in a population-based screening study (China PEACE million persons project). Lancet. (2017) 390(10112):2549–58. doi: 10.1016/S0140-6736(17)32478-9
PubMed Abstract | Crossref Full Text | Google Scholar
2. Moman RN, Gupta N, Varacallo M. Physiology, albumin. In: StatPearls. Treasure Island (FL): StatPearls Publishing (2022). PMID: 29083605
3. Aldecoa C, Llau JV, Nuvials X, Artigas A. Role of albumin in the preservation of endothelial glycocalyx integrity and the microcirculation: a review. Ann Intensive Care. (2020) 10(1):85. doi: 10.1186/s13613-020-00697-1
PubMed Abstract | Crossref Full Text | Google Scholar
4. Belinskaia DA, Voronina PA, Shmurak VI, Jenkins RO, Goncharov NV. Serum albumin in health and disease: esterase, antioxidant, transporting and signaling properties. Int J Mol Sci. (2021) 22(19):10318. doi: 10.3390/ijms221910318
PubMed Abstract | Crossref Full Text | Google Scholar
5. Schalk BW, Visser M, Bremmer MA, Penninx BW, Bouter LM, Deeg DJ. Change of serum albumin and risk of cardiovascular disease and all-cause mortality: longitudinal aging study Amsterdam. Am J Epidemiol. (2006) 164(10):969–77. doi: 10.1093/aje/kwj312
PubMed Abstract | Crossref Full Text | Google Scholar
6. Ahbap E, Sakaci T, Kara E, Sahutoglu T, Koc Y, Basturk T, et al. The relationship between serum albumin levels and 24-h ambulatory blood pressure monitoring recordings in non-diabetic essential hypertensive patients. Clinics. (2016) 71(5):257–63. doi: 10.6061/clinics/2016(05)03
PubMed Abstract | Crossref Full Text | Google Scholar
8. Høstmark AT, Tomten SE, Berg JE. Serum albumin and blood pressure: a population-based, cross-sectional study. J Hypertens. (2005) 23(4):725–30. doi: 10.1097/01.hjh.0000163139.44094.1d
Crossref Full Text | Google Scholar
10. China Revision Committee for the Guidelines for the Prevention and Treatment of Hypertension HAC, Association CBoCM, Association HPCoCMD. 2018 Chinese guidelines for the management of hypertension. Chin J Cardiovasc Med. (2019) 24(1):24–56. doi: 10.3969/j.issn.1007-5410.2019.01.002
Crossref Full Text | Google Scholar
11. Lenfant C, Chobanian AV, Jones DW, Roccella EJ. Seventh report of the joint national committee on the prevention, detection, evaluation, and treatment of high blood pressure (JNC 7): resetting the hypertension sails. Hypertension. (2003) 41(6):1178–9. doi: 10.1161/01.HYP.0000075790.33892.AE
PubMed Abstract | Crossref Full Text | Google Scholar
14. Sun Z, Zheng L, Zhang X, Li J, Hu D, Sun Y. Ethnic differences in the incidence of hypertension among rural Chinese adults: results from Liaoning Province. PLoS ONE. (2014) 9(1):e86867. doi: 10.1371/journal.pone.0086867
PubMed Abstract | Crossref Full Text | Google Scholar
16. Oda E. Serum albumin is positively correlated with serum potassium and inversely associated with incident hypertension in a health screening population. Ningen Dock Int. (2016) 3(1):13–9. doi: 10.11320/ningendockitn.3.1_13
Crossref Full Text | Google Scholar
18. Huc T, Konop M, Onyszkiewicz M, Podsadni P, Szczepańska A, Turło J, et al. Colonic indole, gut bacteria metabolite of tryptophan, increases portal blood pressure in rats. Am J Physiol Regul Integr Comp Physiol. (2018) 315(4):R646–55. doi: 10.1152/ajpregu.00111.2018
PubMed Abstract | Crossref Full Text | Google Scholar
19. Martin M, Hagemann D, Nguyen TT, Schwarz L, Khedr S, Moskopp ML, et al. Plasma concentrations and ACE-inhibitory effects of tryptophan-containing peptides from whey protein hydrolysate in healthy volunteers. Eur J Nutr. (2020) 59(3):1135–47. doi: 10.1007/s00394-019-01974-x
PubMed Abstract | Crossref Full Text | Google Scholar
20. Patterson LK, Mazière JC, Bartels DM, Hug GL, Santus R, Morlière P. Evidence for a slow and oxygen-insensitive intra-molecular long range electron transfer from tyrosine residues to the semi-oxidized tryptophan 214 in human serum albumin: its inhibition by bound copper (II). Amino Acids. (2012) 42(4):1269–75. doi: 10.1007/s00726-010-0819-5
PubMed Abstract | Crossref Full Text | Google Scholar
21. Louca P, Mompeo O, Leeming ER, Berry SE, Mangino M, Spector TD, et al. Dietary influence on systolic and diastolic blood pressure in the TwinsUK cohort. Nutrients. (2020) 12(7):2130. doi: 10.3390/nu12072130
PubMed Abstract | Crossref Full Text | Google Scholar
22. Li M, Kwok MK, Fong SSM, Schooling CM. Effects of tryptophan, serotonin, and kynurenine on ischemic heart diseases and its risk factors: a Mendelian randomization study. Eur J Clin Nutr. (2020) 74(4):613–21. doi: 10.1038/s41430-020-0588-5
PubMed Abstract | Crossref Full Text | Google Scholar
23. Teymoori F, Asghari G, Mirmiran P, Azizi F. High dietary intake of aromatic amino acids increases risk of hypertension. J Am Soc Hypertens. (2018) 12(1):25–33. doi: 10.1016/j.jash.2017.11.004
PubMed Abstract | Crossref Full Text | Google Scholar
24. Naldi M, Baldassarre M, Domenicali M, Bartolini M, Caraceni P. Structural and functional integrity of human serum albumin: analytical approaches and clinical relevance in patients with liver cirrhosis. J Pharm Biomed Anal. (2017) 144:138–53. doi: 10.1016/j.jpba.2017.04.023
PubMed Abstract | Crossref Full Text | Google Scholar
25. Choi JW, Park JS, Lee CH. Genetically determined hypoalbuminemia as a risk factor for hypertension: instrumental variable analysis. Sci Rep. (2021) 11(1):11290. doi: 10.1038/s41598-021-89775-3
PubMed Abstract | Crossref Full Text | Google Scholar
27. Yoon SS, Gu Q, Nwankwo T, Wright JD, Hong Y, Burt V. Trends in blood pressure among adults with hypertension: United States, 2003–2012. Hypertension. (2015) 65(1):54–61. doi: 10.1161/HYPERTENSIONAHA.114.04012
PubMed Abstract | Crossref Full Text | Google Scholar
28. Weaving G, Batstone GF, Jones RG. Age and sex variation in serum albumin concentration: an observational study. Ann Clin Biochem. (2016) 53(Pt 1):106–11. doi: 10.1177/0004563215593561
PubMed Abstract | Crossref Full Text | Google Scholar
29. Nagai M, Ohkubo T, Murakami Y, Takashima N, Kadota A, Miyagawa N, et al. Secular trends of the impact of overweight and obesity on hypertension in Japan, 1980–2010. Hypertens Res. (2015) 38(11):790–5. doi: 10.1038/hr.2015.81
PubMed Abstract | Crossref Full Text | Google Scholar
30. Kotruchin P, Hoshide S, Kanegae H, Pongchaiyakul C, Kario K. Disparities in the impact of overweight on hypertension among asians: a Japanese and Thai population-based study. J Hum Hypertens. (2019) 33(2):123–30. doi: 10.1038/s41371-018-0118-2
PubMed Abstract | Crossref Full Text | Google Scholar
31. Lai KY, Wu TH, Liu CS, Lin CH, Lin CC, Lai MM, et al. Body mass index and albumin levels are prognostic factors for long-term survival in elders with limited performance status. Aging. (2020) 12(2):1104–13. doi: 10.18632/aging.102642
PubMed Abstract | Crossref Full Text | Google Scholar
32. Eckart A, Struja T, Kutz A, Baumgartner A, Baumgartner T, Zurfluh S, et al. Relationship of nutritional status, inflammation, and serum albumin levels during acute illness: a prospective study. Am J Med. (2020) 133(6):713–722.e717. doi: 10.1016/j.amjmed.2019.10.031
留言 (0)