
記住我

Livestock semen cryopreservation holds significant importance in livestock production. During semen cryopreservation, sperm are subjected to cold shock, ice crystal formation, oxidative stress, and other molecular alterations. These factors contribute to the freezing-induced damage, affecting sperm motility, vitality, and structural integrity (Peris-Frau et al., 2020). In the course of freezing livestock semen, aside from the inherent factors associated with the freezing methodology and the technology used to improve sperm quality post-thawing, there are notable variations in semen cryopreservation outcomes among different species due to varying sperm tolerance to low temperatures. Studies have shown that bovine frozen semen typically exhibits approximately 50% sperm motility and viability after thawing (Khalil et al., 2017). Compared with that of cattle, frozen-thawed semen of pigs typically demonstrates approximately 40% sperm motility (Roca et al., 2006). Furthermore, compared with that of cattle and pigs, frozen-thawed semen of sheep displays lower sperm motility and survival rates, at approximately 40% and 30%, respectively (García et al., 2017).
The study of sheep semen cryopreservation technology dates back to the 1950s (Emmens and Blackshaw, 1950). At present, the primary approach to mitigating sperm cryopreservation damage in sheep involves the addition of antioxidants, oligosaccharides, and natural or synthetic ice crystal inhibitor antifreeze protectants to the freezing diluent (Ma et al., 2019). There is limited research on improving semen cryopreservation outcomes through the supplementation of exogenous additives. Recent studies have revealed a close connection between gastric and intestinal flora and semen quality. An imbalance in gastric and intestinal flora can adversely impact spermatogenesis, leading to a reduction in semen quality and male fertility (Ding et al., 2020). Volatile fatty acids (VFAs) absorbed in the rumen play a vital role in providing energy to the animal body. Some VFAs produced during rumen fermentation are absorbed by the rumen epithelium, neutralized by saliva, or absorbed into the small intestine along with chyme (Bergman, 1990). An increase in VFA concentration can lead to a decrease in rumen fluid pH, potentially altering rumen microflora and the type of rumen fermentation if pH remains consistently low. In severe cases, it can lead to the disruption of rumen epithelial barrier function, which, in turn, affects the absorption of VFAs by the rumen epithelium (Aschenbach et al., 2011). Intestinal microbiota can significantly mitigate reproductive damage caused by busulfan, thereby enhancing spermatogenesis and semen quality. Alterations in the abundance of the intestinal Ruminococcaceae_NK4A214_group can result in decreased bile acid levels, ultimately impairing spermatogenesis and causing damage to spermatogenic cells (Zhang P. et al., 2021). Ding et al. (2020) found that a high-fat diet disrupts the intestinal flora, resulting in an elevated abundance of Bacteroides and Prevotella in the intestines of normal mice. This alteration reduces the number of spermatocytes and sperm in the seminiferous tubules of normal mice, resulting in decreased sperm quality (Zhang C. et al., 2021). Studies have demonstrated that dietary fiber supplementation can improve the intestinal flora of boars, stimulate the production of short-chain fatty acids, and improve spermatogenesis and semen quality (Lin et al., 2022).
Citrulline belongs to non-essential amino acids, research found that citrulline is not degraded by microorganisms in the rumen (Gilbreath et al., 2019, 2020). Citrulline can promoted vasodilation, muscle synthesis, lipid decomposition, mitochondrial biosynthesis and protein synthesis, citrulline is involved in the urea cycle in the liver, and citrulline-arginine-NO metabolism occurs in macrophages, which plays an important regulatory role in the body 's vasodilation (Allerton et al., 2018). Our previous study demonstrated that L-citrulline (L-Cit) supplementation significantly improves sperm motility and density, mitochondrial membrane potential, reproductive hormone levels, and the antioxidant capacity of the serum and seminal plasma in rams. Specifically, the supplementation of 12 g/d/ram exerted the most optimal effect (Zhao et al., 2022). Subsequently, our study revealed that L-Cit supplementation could regulate protein digestion and absorption pathways in rams, improve serum amino acid metabolism, modulate the expression of testis-related genes, elevate testicular glycolysis/gluconeogenesis pathways, reduce seminal plasma sugar content, and increase seminal plasma amino acid levels (Zhao et al., 2023). Can feeding rams with citrulline at the dose previously studied by our research group improve the semen quality of rams and the microbial structure in the gastrointestinal tract, thereby improving the antifreeze performance of semen? However, there is a lack of relevant research.
As a non-essential amino acid, L-Cit is finally decomposed into NO (Nitric Oxide, NO) and polyamines in the body through two major metabolic pathways of arginine and NO metabolism. Among them, the regulation of L-Cit on the reproductive performance of the body mainly depends on the NO cycle. Studies have confirmed that nitric oxide (NO) has multiple roles in organisms. On the one hand, it can effectively reduce the level of androstenedione; on the other hand, it can also regulate the production of testicular steroids (Lundberg and Govoni, 2004). NO not only has the ability to regulate the synthesis of luteinizing hormone releasing hormone (LHRH), but also induces the release and synthesis of prostaglandin E2 (PGE2) in the hypothalamus. As an important precursor of arginine, L-Cit can be synthesized in the intestine of adult animals, and then transported to the kidney to further convert to arginine to meet the body 's normal demand for arginine. The study found that adding 2.33 g/kg L-arginine (L-Arg) to the cock's diet can effectively promote the increase of cock 's testicular weight, sperm density, the number of straight-line sperm, and the concentration of testosterone in plasma (El-Hattab et al., 2012). However, there is no systematic study on the effect of supplementary feeding L-Cit on semen cryopreservation and intestinal flora of rams. Therefore, the purpose of this experiment was to analyze the correlation between semen antifreeze performance and gastrointestinal microorganisms of rams by L-Cit supplementation. The purpose of this study was to provide a theoretical basis for the application of L-Cit in sheep production.
2 Materials and methods 2.1 Ethic statementAll animal care and handing procedures in this study were conducted under the guidance of the Care and Use of Laboratory Animals in China and were approved by (protocol number: 2020022) the Animal Care Committee of Xinjiang Agricultural University (Urumqi, Xinjiang, China).
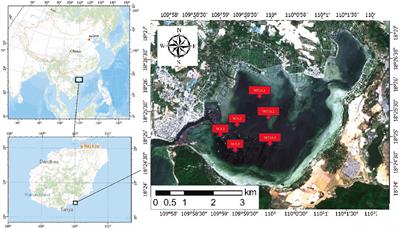
2.2 Study locationmThis study was conducted at Huishang Ecological Animal Husbandry Co., Ltd. in Toksun County, Turpan City, Xinjiang (located at coordinates 87°14′05“-89°11′08”E and 41°21′14“-43°18′11”N) over a 90-day period from September to December 2022. The average outdoor and indoor temperatures during this period were 14.2°C and 16.3°C, respectively.
2.3 Primary reagentsL-Cit (≥98.0% purity, reagent grade) was obtained from Shanghai Shenggong Bioengineering Technology Service Co., Ltd. for refeeding trials. Anhydrous glucose, anhydrous citric acid, and Tris were procured from Shanghai Sigma Company; Sodium penicillin, streptomycin sulfate, and glycerol were obtained from Amresco (USA) were used to prepare semen frozen diluent. Total antioxidant capacity (T-AOC), catalase (CAT), glutathione peroxidase (GSH-Px), and nitric oxide (NO) kits were obtained from Nanjing Jiancheng Bioengineering Institute; A Giemsa staining kit was purchased from Shanghai Sangon Bioengineering Technology Service Co., Ltd were used to determine the antioxidant index, sperm deformity rate and acrosome integrity rate in seminal plasma. Paraffin (melting points: 52°C−54°C, 56°C−60°C, and 60°C−62°C), eosin staining solution, hematoxylin staining solution, neutral gum, and xylene were provided by Tianjin Baishi Chemical Co., Ltd; Ethanol (75%, 80%, 90%, 95%, and 100%), xylene-anhydrous ethanol solution (1:1, v/v), 1% hydrochloric acid ethanol solution, 1% ammonia, and 4% paraformaldehyde were procured from Tianjin Baishi Chemical Co., Ltd.; Paraffin wax was obtained from Leica. Xylene was purchased from Tianjin Baishi Chemical Co., Ltd.; PBS (phosphate buffer saline) (10×), 30% hydrogen peroxide solution, and neutral gum were obtained from Biotopped. H&E (hematoxylin-eosin staining) staining reagents were obtained from Nanchang Yulu Experimental Equipment Co., Ltd. are used for staining and observation of testicular tissue.
2.4 Primary equipmentThe microplate reader (iMark) was obtained from Bio-Rad (USA) and the centrifuge 5,424 was procured from Eppendorf (Germany) was used to detect the antioxidant index in seminal plasma. The computer-assisted sperm analysis (CASA) system (2001532) was obtained from Auri and was used to detect routine sperm parameters. A semi-automatic rotary slicing machine (German Leica; RM2245) was purchased from Beijing Lebo Liantai Technology Co., Ltd.; A 37°C incubator (model LS-CO150) was purchased from Beijing Wuzhou Oriental Technology Development Co., Ltd.; A tissue embedding machine (model BMJ-1) was procured from Tianjin Tianli Aviation Electromechanical Co., Ltd.; A biological tissue staining machine (model RS-18II) was purchased from Hubei Xiaogan Kuohongye Medical Instrument Co., Ltd.; The German SLEE tissue dehydrator (model MTP) and German SLEE baking sheet machine (model Slidetec WATER/HETA) were purchased from Beijing Lybyshin Technology Development Co., Ltd.; An optical microscope (model L2800) was purchased from Shenzhen Xingming Optical Instrument Co., Ltd.; The Merck Millipore pure water meter and toasting machine were provided by Leica; We also obtained a pH meter (OHAUS®), a biological microscope (Nikon), Bouin's solution (Beijing Regen Biotechnology Co., Ltd.), and a water bath all used for tissue section preparation and observation.
2.5 Feed managementAll test rams were fed under the same feeding conditions, receiving meals at 09:30 and 17:30 daily via a TMR (Total Mixed Ration) feeding vehicle with unrestricted access to both food and water. The dietary composition and nutritional content of the rams are detailed in Table 1.
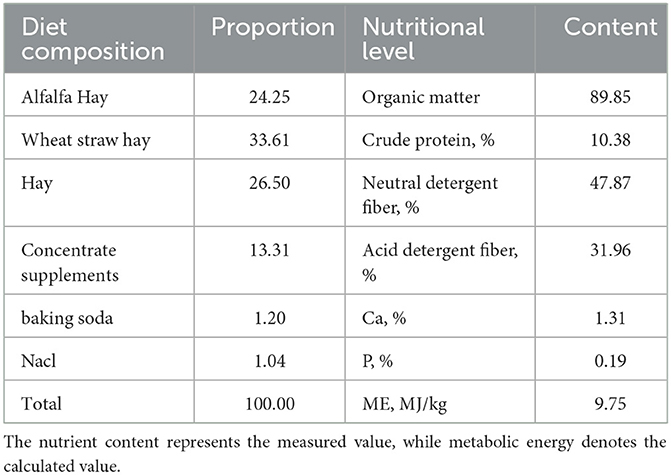
Table 1. TMR composition and nutritional levels (based on dry matter, %).
2.6 Study designTwenty-four Turpan black sheep rams, characterized by symmetrical body conditions, good semen quality, and an average body weight of 65.24 ± 5.41 kg, were selected for pseudovaginal sperm collection. Subsequently, 50 μL of fresh semen was obtained and diluted 60-fold with a diluent. A 5 μL aliquot was then placed on a slide, covered with a glass slide, and subjected to analysis using the CASA system. At least five fields and 1,000 sperm cells were examined. The fresh sperm motility rate exceeded 85%, and the semen samples with sperms exhibiting rapid linear motion of more than 70% were subjected to freezing.
The qualified semen was diluted to a concentration of 5.0 × 10⁷ sperm/mL at a room temperature of 25°C, and promptly sub-packed into 0.25 mL Kasu frozen semen tubes. Subsequently, the tubes were sealed, wrapped in 16 layers of gauze, and placed in a refrigerator at 4°C for a 3-h cooling and balancing period. Afterwards, the samples were evenly spaced on a freezing rack, fumigated with liquid nitrogen at a distance of 3.5 cm from the liquid nitrogen level for 8 min, and promptly transferred into liquid nitrogen and sub-packed into finger tubes for storage. On the third day post-freezing, the frozen semen was thawed in a 37°C water bath for 30 s. Based on post-thaw viability, 24 rams were sorted by descending sperm viability, with 12 rams exhibiting sperm viability exceeding 50% designated as the high antifreeze group (HF), while the remaining 12 rams with sperm viability below 50% were categorized as the low antifreeze group (LF). The 12 sheep in the HF group were randomly allocated into control (HFC) and experimental (HFT) subgroups, each consisting of 6 sheep. Similarly, the 12 sheep in the LF group were randomly assigned to the control (HFC) and experimental (HFT) subgroups, each comprising 6 sheep. During the experimental period, the rams in the control groups were fed a basal diet. Meanwhile, in the experimental groups, 12 g of L-Cit was measured daily at 9 a.m. and placed in a clean mineral water bottle. After completely dissolving the L-Cit in 100 mL of tap water, the rams were fixed, and the L-Cit solution was administered from the corner of their mouths to ensure complete swallowing.
Frozen diluent: 3.04 g Tris, 1.136 g anhydrous glucose, 1.554 g anhydrous citric acid, and 1,000 IU (International Unit) of antibiotics were dissolved in deionized water and subsequently diluted to a final volume of 100 mL. Following filtration through a 0.22-mm filter, 10% egg yolk and 6% glycerol were incorporated.
2.7 Semen collectionThe semen was collected using a pseudovagina every 5 days, with two collections occurring at an 8-min interval. Semen discharge took place once daily, preceding each semen collection. Semen samples from rams on both days 0 and 90 were collected for experimentation.
2.8 Collection of testicular samples, rumen fluid, and duodenal contentsOn the 90th day of the experiment, the abdominal cavities of the rams in both the HFC and HFT groups were promptly opened following slaughter. After removing the rumen, it was incised, and the intermediary contents were wrapped with five layers of gauze. The rumen fluid was squeezed and collected into cryopreservation tubes, which were subsequently stored in liquid nitrogen. Simultaneously, the midsection of the duodenum was obtained, and its contents were squeezed out into frozen tubes and stored in liquid nitrogen. Simultaneously, the left testicular tissue from each ram was collected and stored in 4% paraformaldehyde for histological analysis.
2.9 Detection of sperm routine parametersCASA was employed to assess sperm density, total motility (TM), progressive motility (PM), and motility rate. Fresh semen was diluted by a factor of 100 using a diluent (10 μL of semen + 990 μL of diluent). The ruby counting plate was positioned on the sperm analyzer's temperature-controlled stage, maintained at 37°C. After preheating, 10 μL of absorbed sperm droplets were placed onto the counting plate. Five fields of view were observed for each sample, and the system automatically quantified sperm density, TM, PM, as well as various motion parameters such as VCL (Velocity of cured line), VSL(Velocity of straight line), VAP (Velocity average path), and others.
The sperm deformity rate was assessed through Giemsa staining (Zhou et al., 2021). The sperm plasma membrane integrity rate was evaluated using the hypo-osmotic swelling test method (Zakošek et al., 2020). Sperm acrosome integrity rate was determined via Giemsa staining (Serafini et al., 2014). The measurement of sperm antioxidant indexes T-AOC, CAT, GSH-Px, and NO followed kit instructions and was performed using a microplate reader.
2.10 Protein quantificationThree rams from both the HFC and HFT groups were randomly selected and observed for a period of 90 days to assess the expression of HSP90 and hexokinase 1 (HK1) proteins in thawed semen (Zhang C. et al., 2021).
2.11 Testicular tissue structure analysisOn the 90th day of the experiment, the rams from both the HFC and HFT groups were euthanized, and their left testes were excised. After making an incision, a 2 × 2 cm section of testicular tissue from the same region was obtained and subsequently transformed into a tissue block measuring approximately 10 mm × 10 mm × 5 mm. These sections were stained, dried, sealed with a neutral gum sealing agent, and microscopically examined (Zhou et al., 2021).
2.12 Microflora sequencing and data analysis of rumen fluid and duodenal contents samples(I) Preparative genomic DNA extraction and PCR amplification. The genomic DNA of the samples was extracted by sodium dodecyl sulfonate (SDS) method. The diluted genomic DNA was used as template, 16S V3-V4 was selected as sequencing region, and PCR amplification was performed using specific primers and high fidelity enzymes.
(II) Library preparation and sequencing. The V3-V4 region of the 16S rRNA gene was amplified using the primers MPRK341F (59-ACTCCTACGGGAGGC AGCAG-39) and MPRK806R (59-GGACTACHVGGG TWTCTAAT-39) with barcoding. The PCRs (total, 30 mL) included 15 mL Phusion high-fidelity PCR master mix (New England Biolabs), 0.2 mM primers, and 10 ng DNA. The thermal cycle was carried out with an initial denaturation at 98°C, followed by 30 cycles of 98°C for 10 s, 50°C for 30 s, 72°C for 30 s, and a final extension at 72°C for 5 min. PCR products were purified using a GeneJet gel extraction kit (Thermo Scientific, USA). The sequencing libraries were constructed with NEBNext Ultra DNA library prep kit for Illumina (NEB, USA) following the manufacturer's instructions, and index codes were added. Then, the library was sequenced on the Illumina HiSeq 2500 platform, and 300-bp paired-end reads were generated at the Novo gene. The paired-end reads were merged using FLASH (v.1.2.71). The quality of the tags was controlled in QIIME (v.1.7.02); meanwhile, all chimeras were removed. The “core set” of the Greengenes database was used for classification, and sequences with 0.97% similarity were assigned to the same operational taxonomic units (OTUs).
(III) Analysis of sequencing data. Operational taxonomic unit abundance information was normalized using a standard sequence number corresponding to the sample with the least sequences. The alpha diversity index was calculated with QIIME (v.1.7.0). The UniFrac distance was obtained using QIIME (b1.7.0), and principal-coordinate analysis (PCA) was performed using R software (v.2.15.3). The linear discriminate analysis effect size (LEfSe) was performed to determine differences in abundance; the threshold LDA score was 4.0. GraphPad Prism9.0 software and origin software were used to make charts and correlation analysis (Yan et al., 2022).
2.13 Statistical analysisMicrosoft Excel was used to preliminarily sort out the data of semen parameters, spermatogenic cells and related proteins. Subsequently, SPSS 26.0 was used to perform independent sample t-test on the data of spermatogenic cells and related proteins. At the same time, the semen indexes were analyzed by one-way analysis of variance, and then Duncan's multiple comparison test was used to evaluate the differences between groups. Origin was used to analyze the correlation between semen parameters and gastric and intestinal flora, and Graph Pad Prism 9.0 and Figdraw were used for data visualization.
3 Results 3.1 Comparison of semen quality between the high antifreeze group and the low antifreeze group prior to L-Cit supplementationThe semen analysis results prior to freezing are shown in Figure 1. Before L-Cit feeding, the sperm curve movement rate in the HF group was significantly higher than that in the LH group (P < 0.05) (Figure 1H). Additionally, the levels of T-AOC (Figure 1J), GSH-Px (Figure 1L), and NO (Figure 1M) were significantly elevated in the HF group compared to the LF group (P < 0.01).
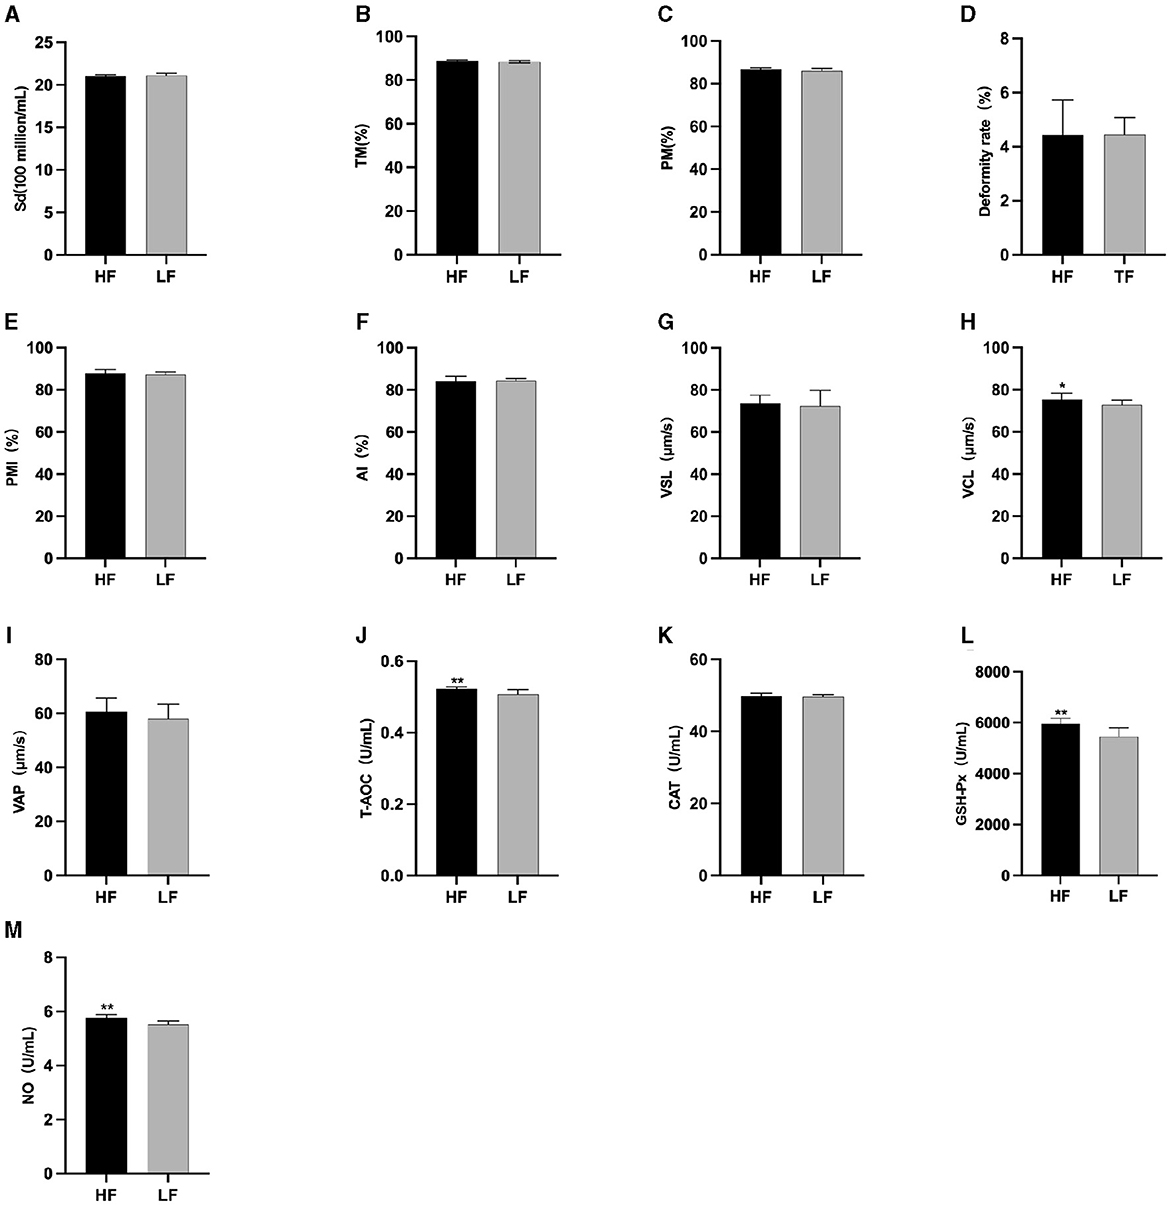
Figure 1. Parameter difference of fresh sperm before supplementation with L-Cit. (A) Sd, Sperm density; (B) TM, Total motility; (C) PM, Progressive motility; (D) Deformity rate; (E) PMI, Plasma membrane integrity, (F) AI, Acrosome integrity; (G) VSL, Velocity of straight line; (H) VCL, Velocity of cured line; (I) VAP, Velocity average path; (J) T-AOC; (K) CAT; (L) GSH-Px; (M) NO. Compared with the LF group, *P < 0.05; **P < 0.01. Same below.
The results of semen thawing are depicted in Figure 2. The TM (Figure 2A), PM (Figure 2B), VAP (Figure 2H), GSH-Px (Figure 2K), and NO (Figure 2L) in the HF group were significantly higher than those in the LF group (P < 0.01). Furthermore, the PMI in the HF group exhibited a significant increase compared to the LF group (P < 0.05) (Figure 2E). The LF group displayed a significantly higher sperm deformity rate (Figure 2C) than that in the HF group (P < 0.05).
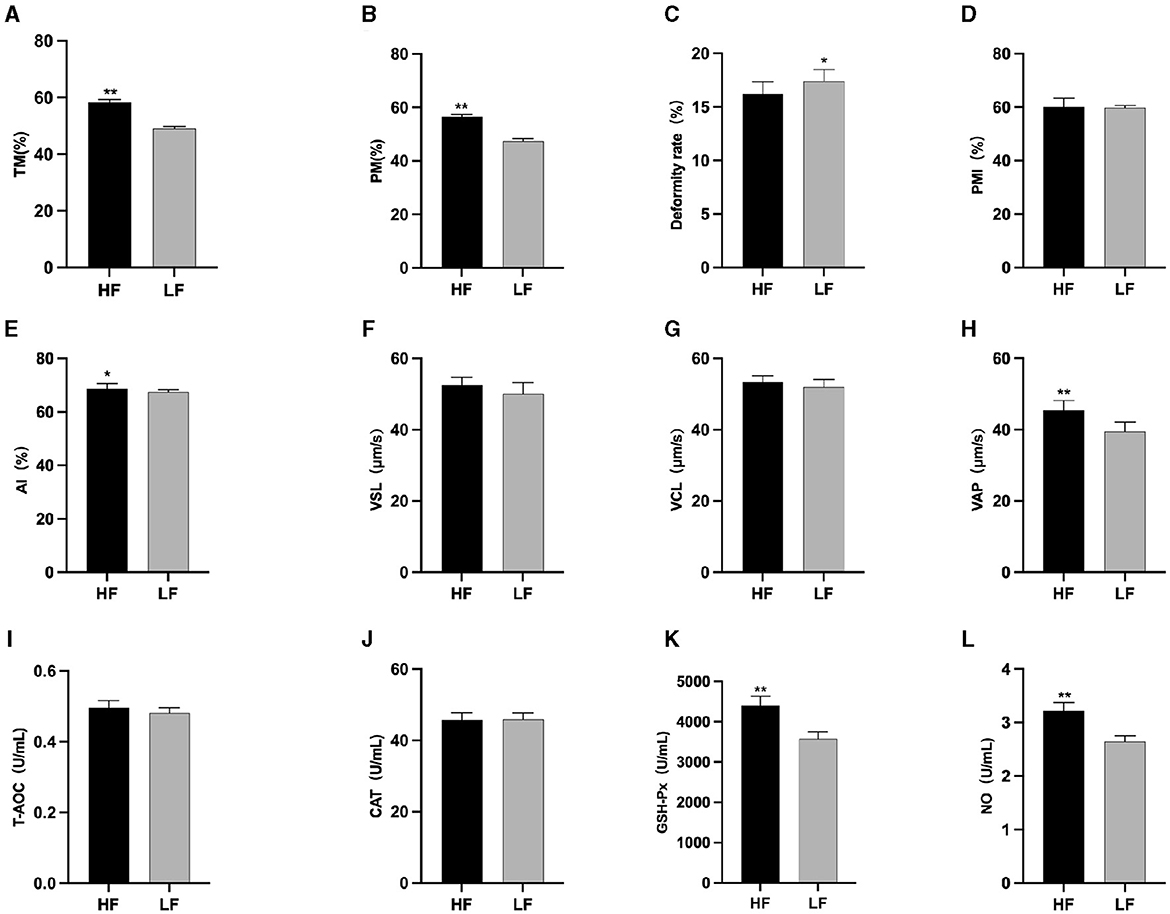
Figure 2. Differences in sperm parameters after thawing before supplementation with L-Cit. (A) TM, Total motility; (B) PM, Progressive motility; (C) Deformity rate; (D) PMI, Plasma membrane integrity; (E) AI, Acrosome integrity; (F) VSL, Velocity of straight line; (G) VCL, Velocity of cured line; (H) VAP, Velocity average path; (I) T-AOC; (J) CAT; (K) GSH-Px; (L) NO. Compared with the LF group, *P < 0.05; **P < 0.01.
3.2 Comparison of fresh and fine quality between the high antifreeze group and the low antifreeze group following L-Cit supplementary feedingThe results of semen analysis prior to freezing are shown in Figure 3. After L-Cit supplementation, semen density (Figure 3A) in the LFC group was significantly lower than that in the other three groups (P < 0.05). Additionally, sperm acrosome integrity (AI) (Figure 3F) in the LFC group was significantly lower than that of the HFT group (P < 0.05). The TM, PM, VSL (Figure 3G), VAP (Figure 3I), T-AOC (Figure 3J), GSH-Px (Figure 3K), and NO (Figure 3L) in the LFT group were significantly higher than those in the other three groups (P < 0.01). Furthermore, sperm density (Figure 3A), sperm plasma membrane integrity rate (Figure 3F), linear motion rate (Figure 3G), T-AOC (Figure 3J), GSH-Px (Figure 3K), and NO (Figure 3L) in the low antifreeze test group were significantly higher than those in the low antifreeze control group (P < 0.05).
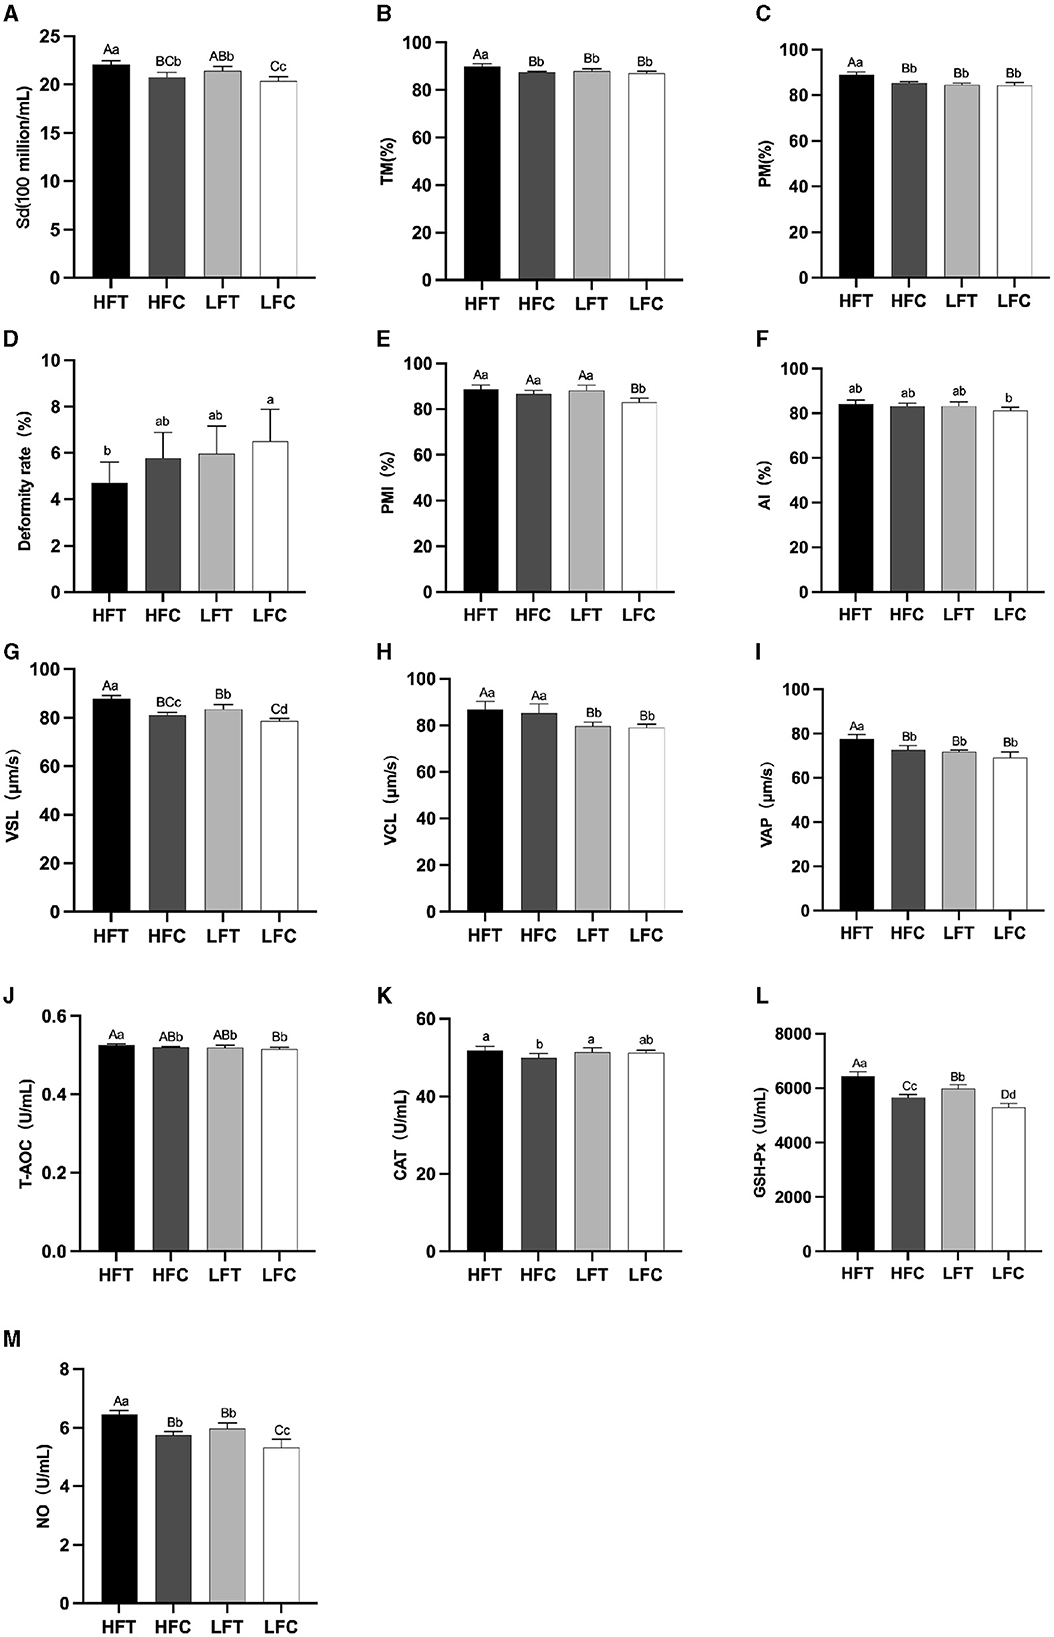
Figure 3. Parameter difference of fresh sperm after supplementation with L-Cit. (A) Sd, sperm density; (B) TM, Total motility; (C) PM, Progressive motility; (D) Deformity rate; (E) PMI, Plasma membrane integrity, (F) AI, Acrosome integrity; (G) VSL, Velocity of straight line; (H) VCL, Velocity of cured line; (I) VAP, Velocity average path; (J) T-AOC; (K) CAT; (L) GSH-Px; (M) NO. Compared with the LFC group. The difference between different uppercase letters was extremely significant (P < 0.01). There was no significant difference between the same letter or no letter label (P > 0.05). The same below.
3.3 Comparison of semen quality following thawing between the high antifreeze and low antifreeze groups after L-Cit supplementary feedingAfter L-Cit supplementation, sperm TM (Figure 4A), PM (Figure 4B), and PMI (Figure 4D) in the LFC group exhibited significant reductions compared to the other three groups (P < 0.01). Furthermore, sperm Deformity rate (Figure 4C) in the LFC group was significantly elevated in comparison to both the HFT and LFT groups (P < 0.01). The AI (Figure 4E) and VAP (Figure 4H) in the HFT group was also significantly higher than that observed in the other three groups (P < 0.05). The VSL (Figure 4F) in HFC group was significantly higher than that in LFC group (P < 0.05). The VCL (Figure 4G) of HFT and LFT groups were significantly higher than that of LFC group (P < 0.05). T-AOC (Figure 4I) and CAT (Figure 4J) in both the HFT and LFT groups were significantly higher than those in the other two groups (P < 0.01). The GSH-Px (Figure 4K) and NO (Figure 4L) in HFT group was also significantly higher than that observed in the other three groups (P < 0.01). Additionally, sperm TM (Figure 4A) and PMI (Figure 4D) in the LFT group were significantly higher than those in the LFC group (P < 0.01).
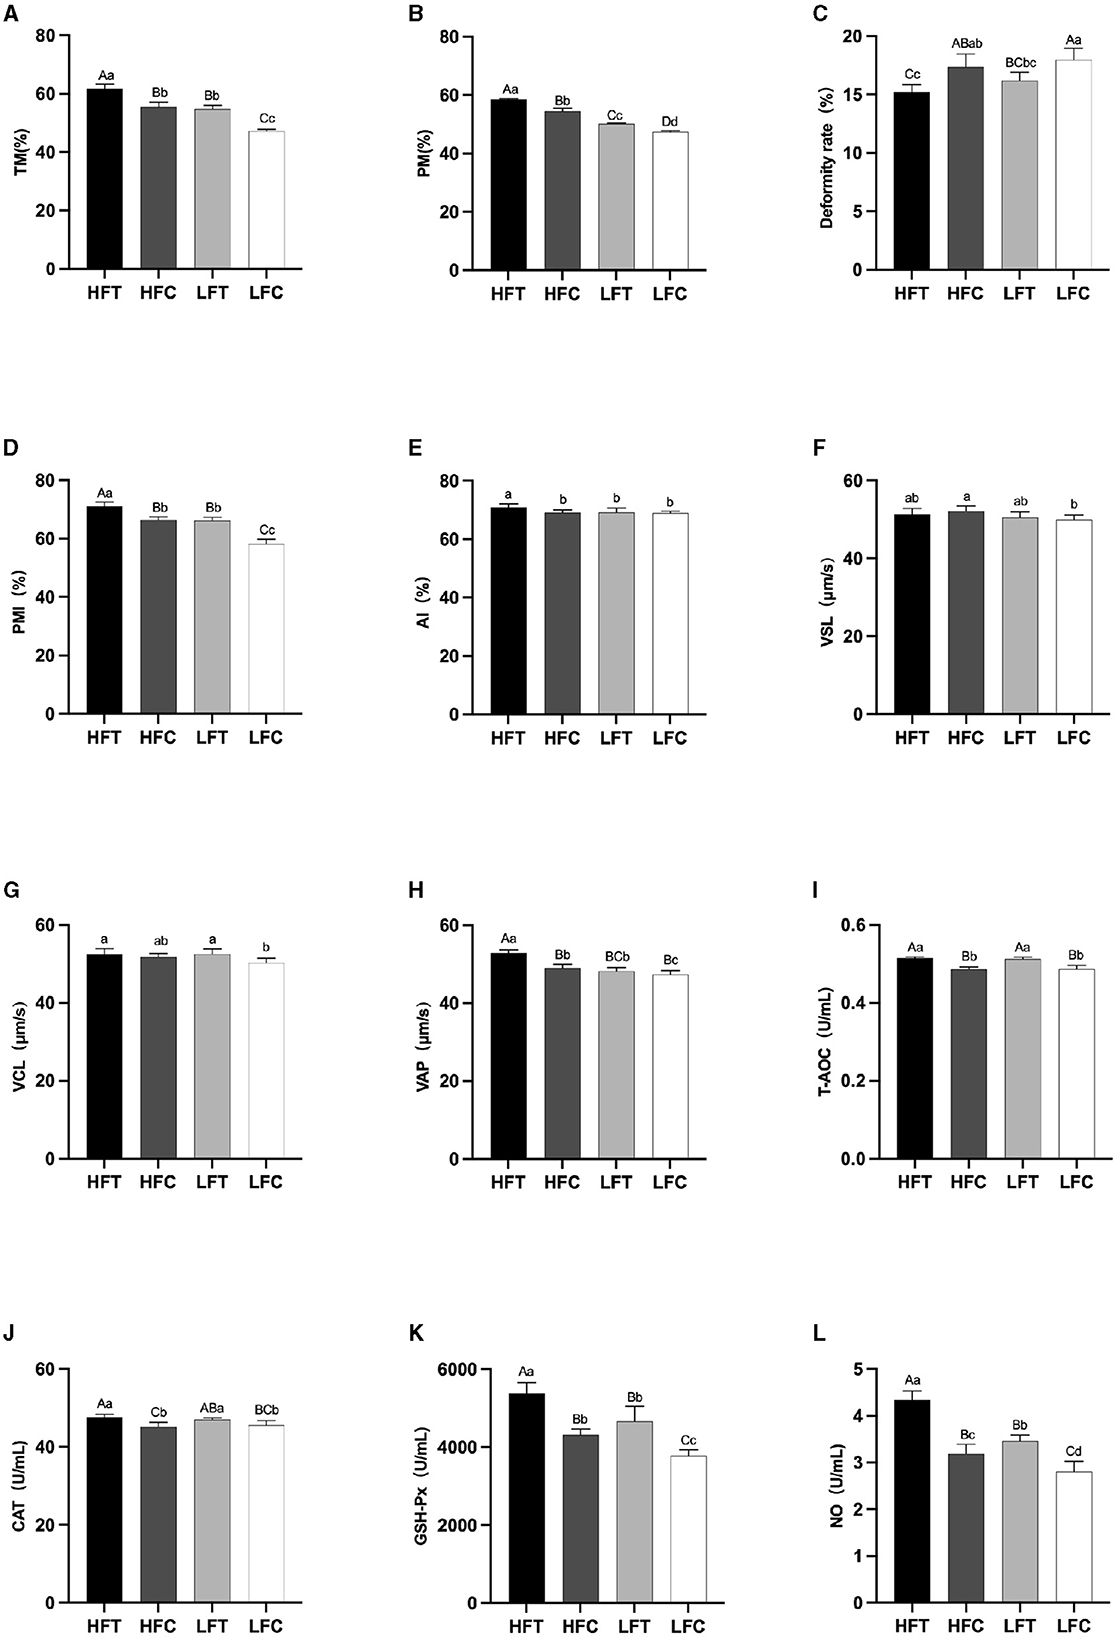
Figure 4. Differences in sperm parameters after thawing after supplementation with L-Cit. (A) TM, Total motility; (B) PM, Progressive motility; (C) Deformity rate; (D) PMI, Plasma membrane integrity, (E) AI, Acrosome integrity; (F) VSL, Velocity of straight line; (G) VCL, Velocity of cured line; (H) VAP, Velocity average path; (I) T-AOC; (J) CAT; (K) GSH-Px; (L) NO. Compared with the LFC group. Values with different lowercase superscripts mean significant difference (P < 0.05), while with same lowercase or no letter superscripts mean no significant difference (P > 0.05). Values with difference capital letter mean difference was extremely significant (P < 0.01).
3.4 Effects of L-Cit supplementation on the expression of HSP90 and HK1 in ram spermWestern blot analysis revealed significant variations in the expression levels of HK1 (Kruskal–Wallis ANOVA, df = 4, P = 0.016) and HSP90 (Kruskal–Wallis ANOVA, df = 4, P = 0.914) proteins among the groups. Refer to Figure 5 for the blots illustrating the protein expression of HK1 and HSP90 in the frozen-thawed HFC and HFT sperm.
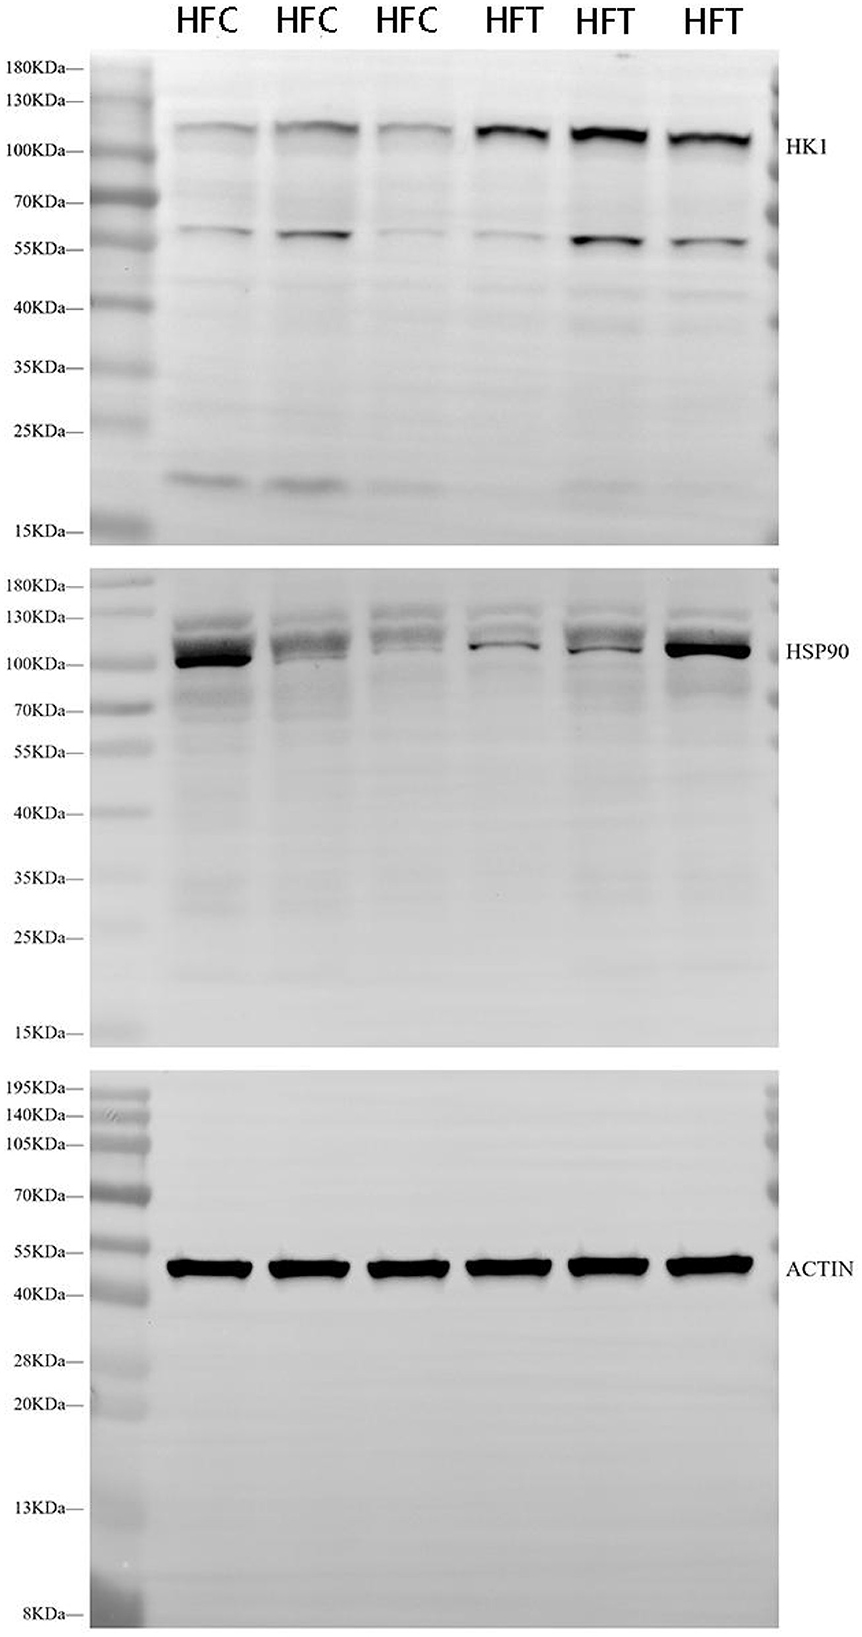
Figure 5. Western blotting analysis showing the protein expression of HK1 and HSP90 in frozen-thawed sheep sperm from the HFC and HFT groups.
The bands corresponding to 115 kDa (~115 kDa) for HK1 and approximately 110 kDa (~110 kDa) for HSP90 were observed in the lysates obtained from frozen-thawed PF sperm (Figure 5). Analysis revealed variations in the expression levels of the examined proteins in the sperm of sheep in both the HFC and HFT groups (Figure 5). Compared to the HFC group, the HFT group exhibited a relatively higher (P = 0.016) expression of the HK1 protein after thawing (Figure 6A). There was no significant difference in HSP90 protein expression between the HFC and HFT groups (P = 0.914, Figure 6B).
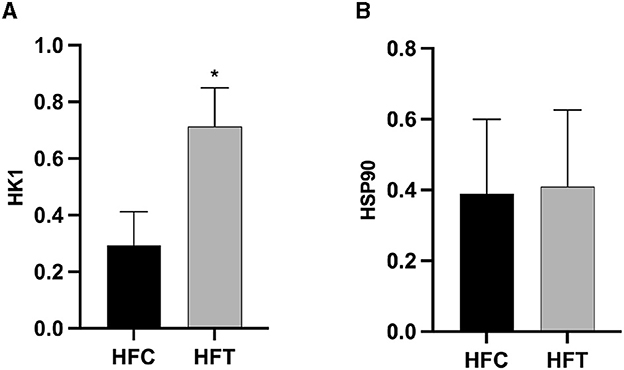
Figure 6. Relative expression of the (A) HK1 and (B) HSP90 proteins in sheep sperm from the HFC and HFT groups. The values represent the mean ± SEM (Standard Error of Mean). Actin was used as a control to normalize the relative expression of the analyzed proteins. Significance at *P < 0.05 after Bonferroni correction.
3.5 Effects of L-Cit supplementation on spermatogenic cells in ram testisThe spermatogonia, Sertoli cells, spermatocytes, and sperm cells in the seminiferous tubules of ram testes from the HFT group exhibited a well-organized arrangement. Compared with the HFC group, the testicular tissue structure of the HFT group was clear and complete, the seminiferous tubules were arranged neatly, and the basement membrane was complete (Figures 7A, B). Testicular tissue samples were magnified 200-fold, as depicted in Figures 7C, D. In the HFT group, the testicular germ cells were closely arranged, and the number of germ cells and the number of germ cells in the seminiferous tubules increased (Figure 7C). Conversely, in the HFC group, testicular germ cells were loosely arranged, and the number of germ cell layers and germ cells was low (Figure 7D). Significantly higher quantities of spermatogonia (Figure 8A), spermatocytes (Figure 8B), and spermatids (Figure 8C) were observed in the HFT group compared to the HFC group (P < 0.05). There was no significant difference in the number of Sn (Figure 8D) between the two groups (P < 0.05).
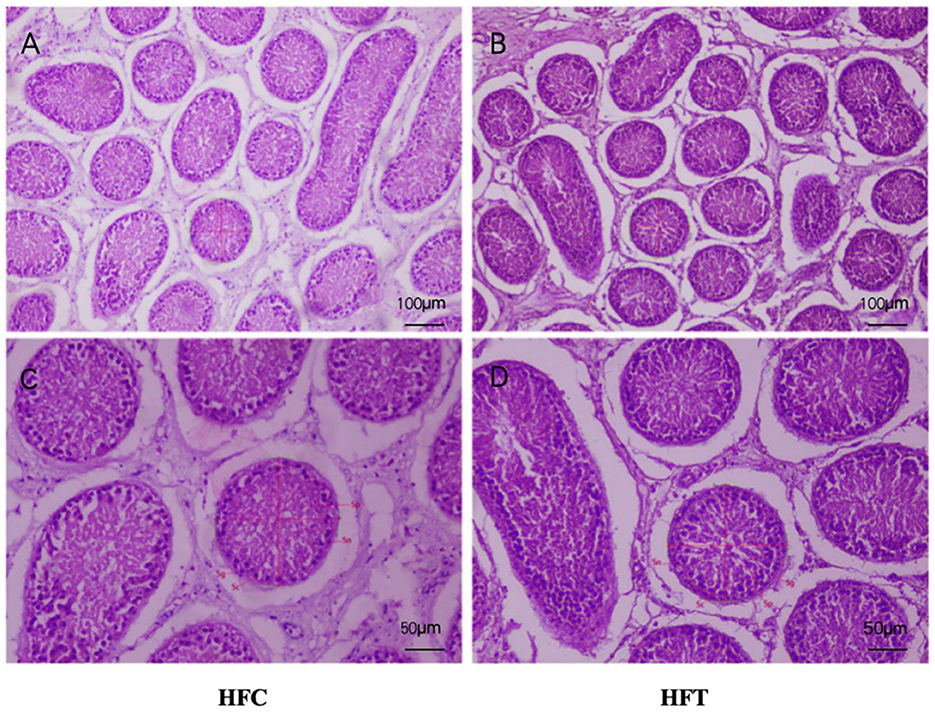
Figure 7. Testicular tissue sections of HFC and HFT groups. (A, C) were fed HFC group, (B, D) were HFT group. Morphological analysis after H&E staining. Sg, Spermatogonium; Sn, Sustentacular cells; Sc, Spermatocytes; Sp, Spermatids. The image above was captured at 100× using an optical microscope, and the following image was captured at 200× using an optical microscope. Significance was calculated via a t-test.
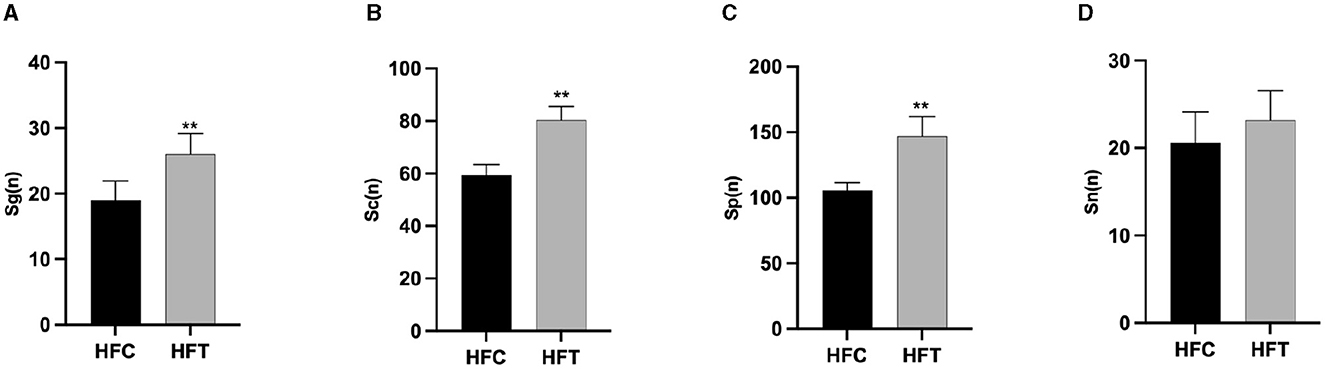
Figure 8. The number of Spermatogonia, Spermatocytes, Sperm cells, and Sertoli cells in HFC and HFT groups. (A) Sg, Spermatogonia; (B) Sc, Spermatocytes; (C) Sp, Sperm cells; (D) Sn, Sertoli cells. Compared with the HFC group, **P < 0.01.
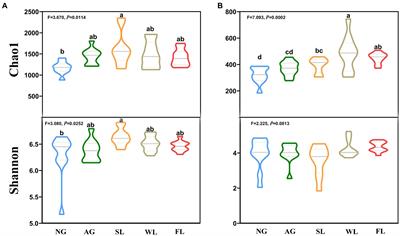
3.6 Analysis of rumen microbial composition and diversity in rams following L-Cit supplementationThe composition and diversity of rumen microorganisms in the HFC and HFT groups are shown in Figure 9. The number of OTUs (Operational Taxonomic Units) in the HFC and HFT groups was 56 and 188, respectively, with an overlap of 845 OTUs between both groups (Figure 9A). The average Chao1 index for rumen fluid samples in the HFC and HFT groups was 693.55 and 812.09, respectively. The average bacterial count in rumen fluid for the HFC and HFT groups was 551.28 and 680.60, respectively. The average diversity indexes for rumen fluid samples in the HFC and HFT groups were 277.57 and 303.34, respectively (Figure 9B). PCA showed distinct differences in rumen microbiota between the two groups (Figure 9C). Subsequently, we identified Firmicutes as the predominant microbial phylum in rumen microorganisms, followed by Patescibacteria, Actinobacteriota, Proteobacteria, and Bacteroidota (Figure 9D). There was no significant difference in the abundance of Firmicutes at the phylum level between the two groups. The HFC group exhibited a higher abundance of Bacteroidota, while the HFT group showed significantly higher abundances of Patescibacteria, Actinobacteriota, and Proteobacteria (Figure 9D). The predominant genera in the rumen microflora included Candidatus_Saccharimonas, followed by Lachnospiraceae_NK3A20_group, Acetitomaculum, Klebsiella, and Olsenella (Figure 9E). In addition, LEFSe showed significant enrichments at the genus level, with the HFT group displaying an enrichment of Candidatus_Saccharimonas, Staphylococcus, Weissella, Succinivbrionaceae_UcG_002, and Quinella, while the HFC group exhibited an enrichment of Ureaplasma (Figure 9F).
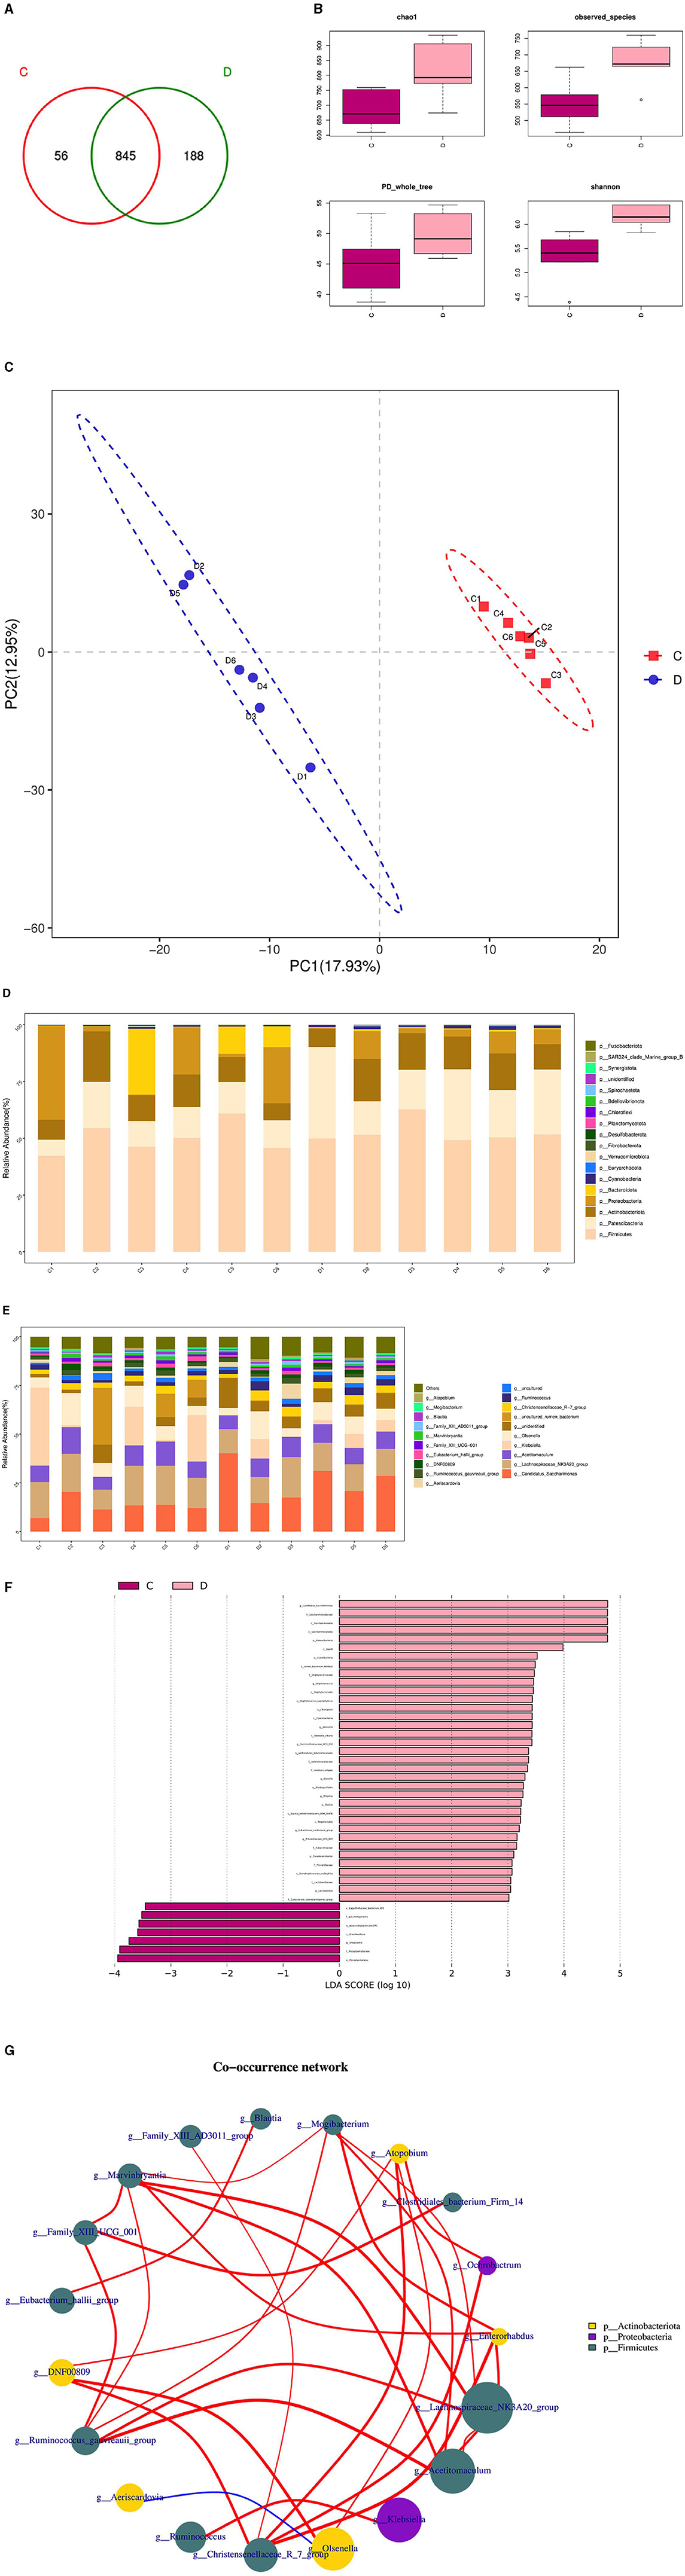
Figure 9. Rumen microbial composition and diversity in rams of the HFC and HFT groups. (A) A Wayne diagram of rumen microbial distribution comparing the two groups. (B) Alpha diversity index box diagram. (C) PLS-DA (Partial Least Squares Discrimination Analysis) analysis. (D) Comparison of the taxonomic composition of the rumen microbiota at the phylum level between the two groups. (E) Comparison of the taxonomic composition of the rumen microbiota at the genus level between the two groups. (F) LEfSe (LDA > 2). (G) Correlation analysis. C denotes the HFC group, and D indicates the HFT group.
The Spearman test elucidated five or more related bacterial taxa, namely Mogibacterium, Enterorhabdus, Lachnospiraceae NK3A20, Acetitomaculum, and Christersenellaceae. Furthermore, the Family_XIII_AD3011_group exhibited a strong association with Blautia, while Mogibacterium displayed a high association with Christensenellaceae. Ochrobactrum exhibited a strong correlation with DNF00809, and Acetitomaculum demonstrated a notable association with the Ruminococcus_gauvreauii_group. Conversely, the correlation between firmicutes and Proteobacteria was found to be relatively low. Family_XIII_AD3011_group displayed a significantly positive correlation with Blautia, while Mogibacterium exhibited a significant positive correlation with Christensenellaceae. Additionally, Ochrobactrum displayed a significant positive correlation with DNF00809, and Acetitomaculum exhibited a significant positive correlation with the Ruminococcus_gauvreauii_group. Conversely, a significant negative correlation was observed between Firmicutes and Proteobacteria (Figure 9G).
3.7 Analysis of microbial composition and diversity in the duodenum of rams subjected to L-Cit supplementary feedingThe microbial composition and diversity of the duodenum in the HFC and HFT groups are presented in Figure 10. The HFT group exhibited 354 OTUs, while the HFC group had 545 OTUs. Moreover, these groups shared 4,425 OTUs (Figure 10A). Regarding the average Chao1 index, the duodenal fluid samples in the HFT and HFC groups displayed values of 4,067.15 and 3,946.11, respectively. The average bacterial counts in the duodenal fluid were 3,318.17 for the HFT group and 3,278.5 for the HFC group (Figure 10B). PCA revealed a difference in duodenal flora between the two groups (Figure 10C). Subsequently, we found that the predominant microbial phylum in the duodenum was Firmicutes, followed by Bacteroidota, Patescibacteria, Actinobacteriota, and Verrucomicrobiota (Figure 10D). There was no significant disparity in the abundance of Firmicutes at the phylum level between the two groups. The HFT group exhibited higher abundances of Bacteroidota and Actinobacteriota, while the HFC group demonstrated significantly higher abundances of Patescibacteria and Verrucomicrobiota (Figure 10D). In the duodenal microflora, the predominant genus was Prevotella, Followed by Uncultured rumen bacterium, Unidentified species, Rikenellaceae RC9 gut group, and Christensenellaceae R-7 group (Figure 10E). In addition, LEFSe at the genus level highlighted significant enrichment of Clostridiales bacterium Firm-14, Butyrivibrio, and Prevotellaceae NK3831 group in the HFT group, while the HFC group exhibited significant enrichment of Desulfovbrio and Quinella (Figure 10F).
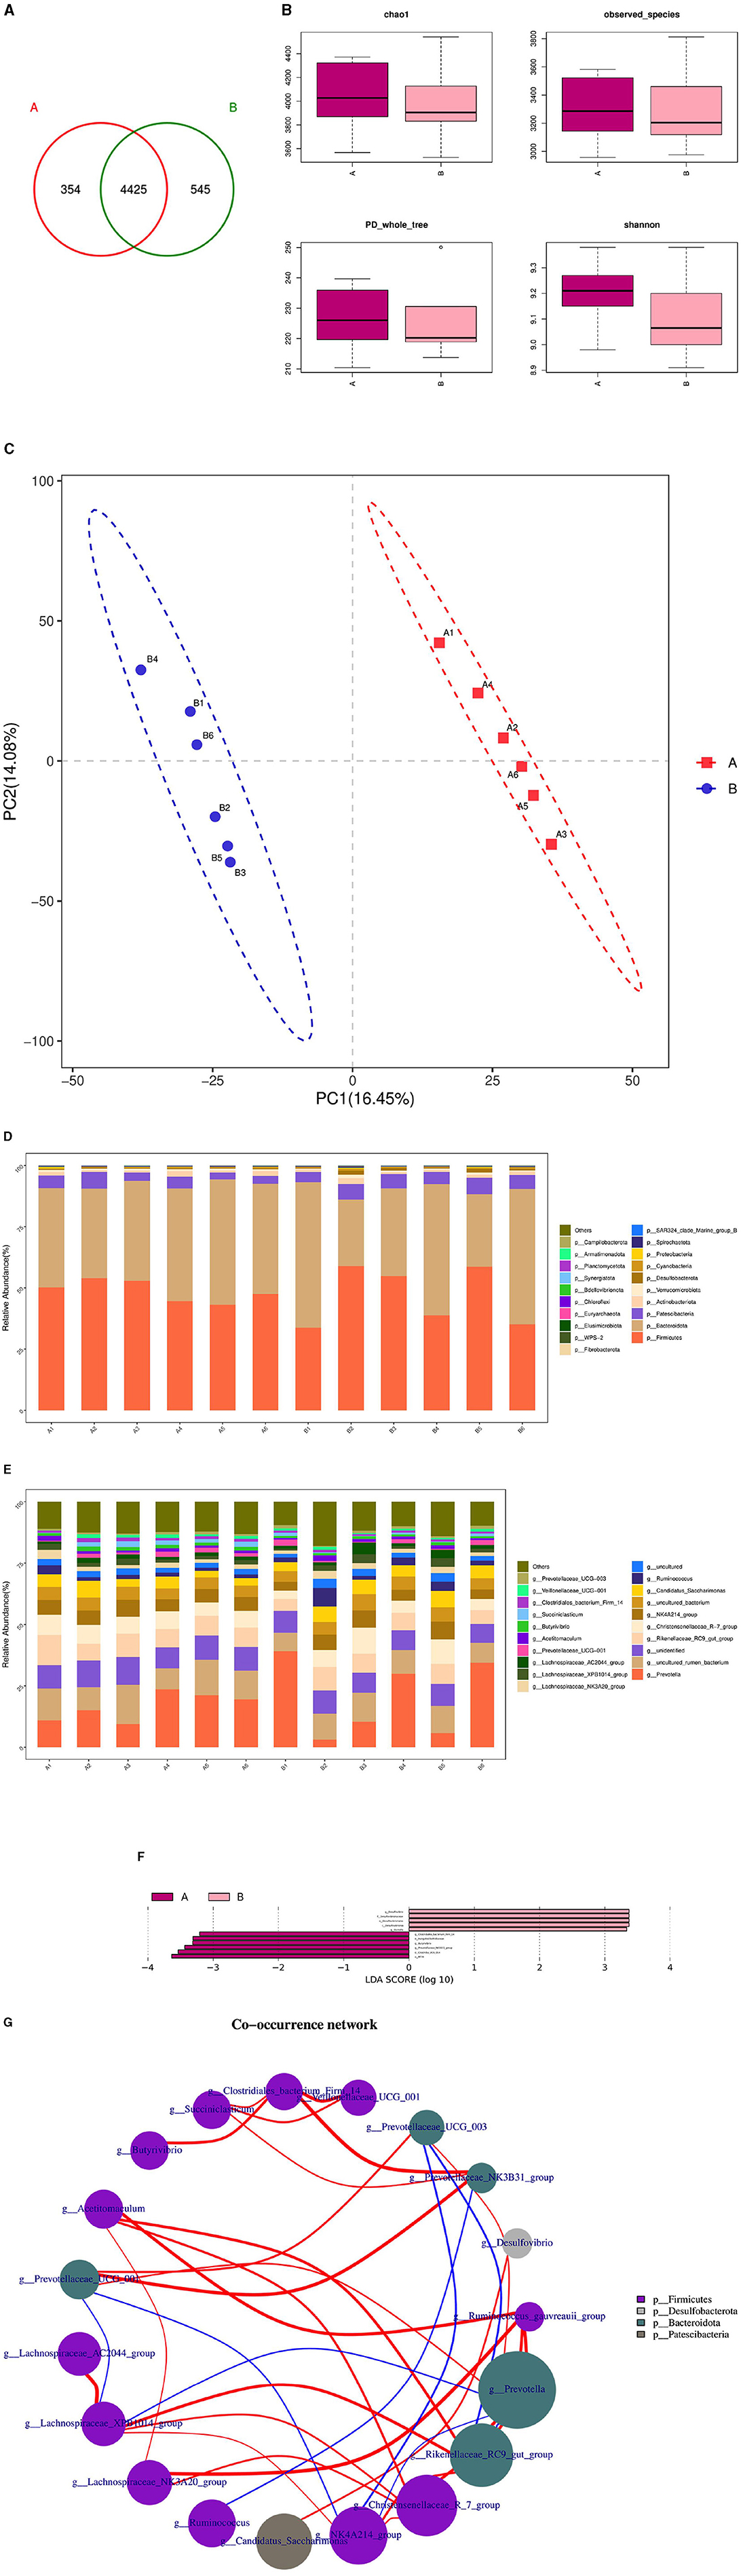
Figure 10. Microbial composition and diversity in the duodenum of sheep from the HFC and HFT groups. (A) A Wayne diagram of duodenal microbial distribution comparing the two groups. (B) Alpha diversity index box diagram. (C) PLS-DA analysis. (D) Comparison of the taxonomic composition of duodenal microbiota at the phylum level between the two groups. (E) Comparison of the taxonomic composition of duodenal microbiota at the genus level between the two groups. (F) LEfSe (LDA > 2). (G) Correlation analysis. A denotes the HFT group, and B represents the HFC group.
The Spearman test revealed that Christersenellaceae exhibited an association with Lachnospiraceae_NK3A20_group, Ruminococcaceae, NK4A214_group, Acetitoma- culum, and Rikenellaceae_RC9_gut_group. Conversely, Prevotellaceae_NK3B31_ group displayed a high correlation with Clostridiales_bacterium_firm14. Prevotellaceae_UCG_003 exhibited a negative correlation with NK4A214_group and Rikenellaceae_RC9_gut_group. In addition, a negative correlation was observed between NK4A214_group and Prevotella, as well as between Prevotellaceae_UCG_001 and NK4A214_group. Furthermore, a negative correlation was identified between Prevotellaceae_UCG_001 and Lachnospiraceae_XPB1014_group, as well as between Lachnospiraceae_XPB1014_group and Prevotella, and finally, between Prevotella and Rikenellaceae_RC9_gut_group (Figure 10G).
3.8 Analysis of the association between L-Cit supplementation and rumen and duodenal microbiota in ramsThe microbial associations in the rumen and duodenum of the HFC and HFT groups are shown in Figure 11. The OTUs identified in the rumen and duodenum of the HFC and HFT groups were 16, 63, 663, and 525, respectively, resulting in a total of 929 OTUs (Figure 11A). The average Chao1 index values for the rumen and duodenum samples in the HFC and HFT groups were 920.48, 1,268.25, 3,096.13, and 3,110.84, respectively. Furthermore, the average bacterial counts in the rumen and duodenal fluid of the HFC and HFT groups were 683.27, 899.58, 2,253.07, and 2,237.72 (Figure 11B), respectively. PCA demonstrated differences in the flora of the rumen and duodenum between the two groups (Figure 11C). Subsequently, we observed that Firmicutes, followed by Bacteroidota, Patescibacteria, Actinobacteriota, and Proteobacteria (Figure 11D), were the predominant phyla in both the rumen and duodenum. At the phylum level, no significant differences were detected in the abundance of Firmicutes between the rumen and duodenum of the two groups. However, the duodenum exhibited a higher abundance of Bacteroidota. Additionally, the rumen of the HFC group displayed significantly higher levels of Proteobacteria, while the rumen of the HFT group exhibited a significantly higher abundance of Patescibacteria and Actinobacteriota (Figure 11D). The predominant genera in the microbial flora included Candidatus_Saccharimonas, Prevotella, Lachnospiraceae_ NK3A20_group, Uncultured_rumen_bacterium, and Unidentified species (Figure 11E). In addition, LEFSe highlighted significant enrichments at the genus level, with the HFC group showing significant enrichment in Lachnospiraceae_NK3A20_group, Acobitomaculum, Klebsiella, and Olsenella, and the HFT group displaying significant enrichment in Candidatus_Saccharimonas, Family_XIII_AD3011_group, Ochrobactrum, and Atopobium. In the duodenum, the HFC group exhibited significant enrichments in Lachnospiraceae_AC2044_group, Prevotellaceae_XPB1014_group, Prevotellaceae_UGG_003, and Desulfovibrio, while the HFT group displayed significant enrichments in Rikenellacase_PC9_gut_group, NK4A214_group, Christensenellaceae_R-7_group, and Succinictasticum (Figure 11F).
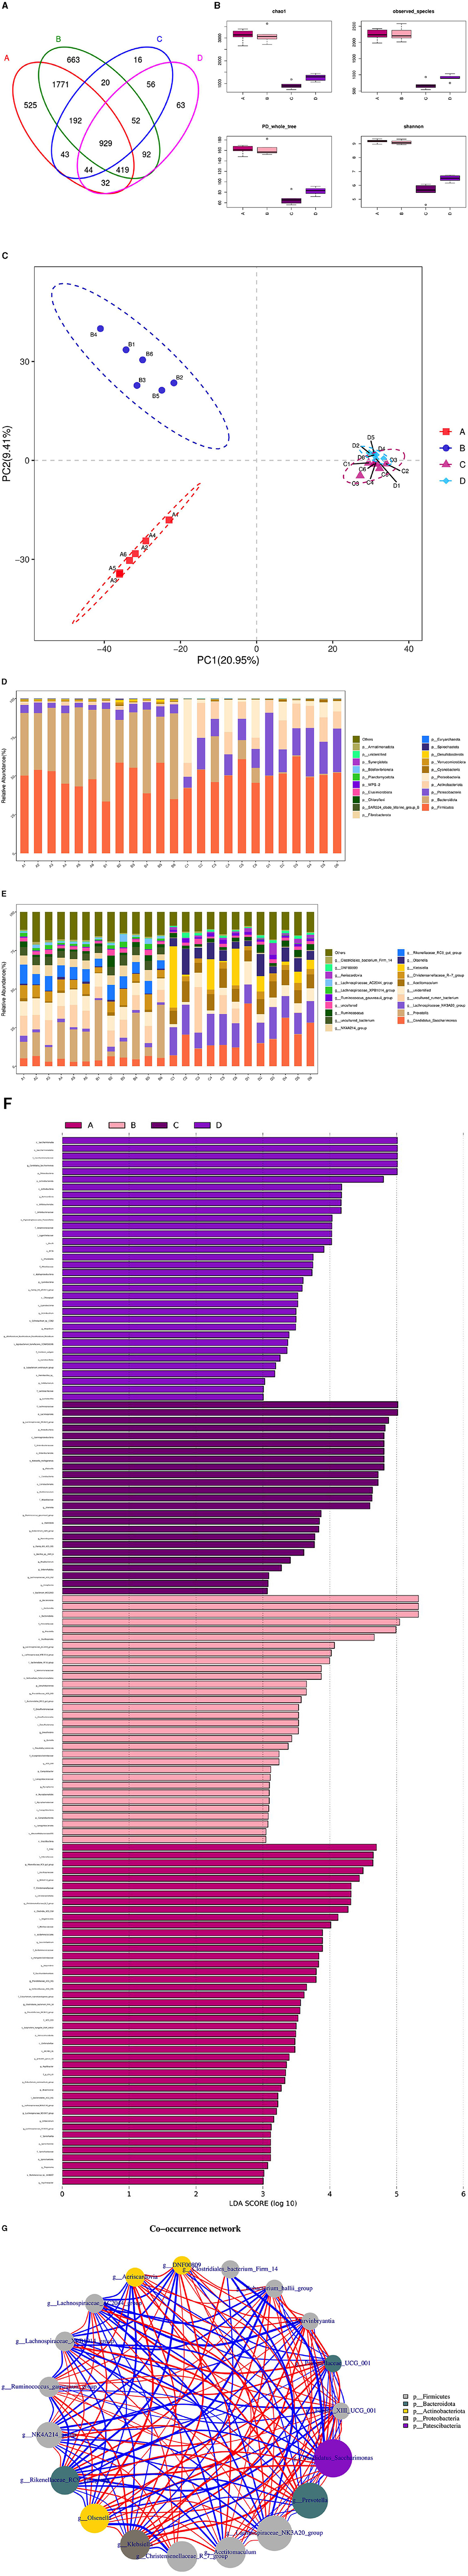
Figure 11. Correlation analysis of rumen and duodenal microbiota in the HFC and HFT groups. (A) A Wayne diagram of microbial distribution comparing the two groups. (B) Alpha diversity index box diagram. (C) PLS-DA analysis. (D) Comparison of the taxonomic composition of the microbiota at the phylum level between the two groups. (E) Comparison of the taxonomic composition of the microbiota at the genus level between the two groups. (F) LEfSe (LDA > 2). (G) Correlation analysis. A and B indicate duodenal microbiota in the HFT and HFC groups, respectively, and C and D indicate rumen microbiota in the HFC and HFT groups, respectively.
The Spearman test revealed that Prevotellaceae_UGG_001 and Marvinbryantia, Eubacterium_hallii_group, Family_III_UCG_001, Candidatus_Saccharimonas, Rikenellaceae_RC9_gut_group, Lachnospiraceae_AC2044_group, Family_III_UCG_ 001, Candidatus_Saccharimonas, Klebsiella, Prevotella, Lachnospiraceae_AC2044_ group, and Prevotellaceae_XPB101_group were highly associated with Ruminococcus_gauvreauii_group and DNF00809. Candidatus_Saccharimonas was negatively correlated with Clostridiales_bacterium_Firm_14, Lachnospiraceae_AC2044_group, and Lachnospiraceae_ XPB1014_group. In addition, Lachnospir-aceae_NK3A20_group, Clostridiales_bacterium_Firm_14, Christensenellaceae_R_7_ group, Olsenella, Rikenellaceae_RC9_gut_group, Eubacterium_hallii_group, DNF00809, Aeriscardovia, Ruminococcus_gauvreauii_group, NK4A214, Eubacterium_hallii_group, and Runinococcus_gauvreauii_group were negatively correlated with Lachnospiraceae_XPB1014_group and Lachnospiraceae_AC2044_group (Figure 11G).
3.9 Correlation analysis between rumen flora and semen quality of rams after supplementary feeding with L-CitThrough correlation analysis of spermatogenic cell count, fresh sperm index, and rumen flora, the number of Sg exhibited a significant positive correlation with the abundance of Ruminococcus_torques_group, Ochrobactrum, and Catenisphaera in the HFC group (P < 0.05). Furthermore, the number of Sc showed a significant positive correlation with the abundance of Lachnospiraceae_UCG-010 and Moryella (P < 0.05). The abundance of Sd demonstrated a significant positive correlation with the abundance of Lachnospiraceae_UCG-010, Escherichia_Shigella, and Pseudomonas (P < 0.01), while exhibiting a significant negative correlation with the abundance of Ochrobactrum and Lactonifactor (P < 0.05). TM was significantly positively correlated with the abundance of Catenisphaera (P < 0.05), while the VAP was positively correlated with the abundance of Ochrobactrum and Lactonifactor (P < 0.05). Additionally, T-AOC exhibited a positive correlation with Moryella abundance (P < 0.05). In the HFC group, the number of Sg displayed significant positive correlations with the abundance of Aureimonas (P < 0.05) and Roseburia (P < 0.01). The number of Sd also exhibited a significant positive correlation with the abundance of Lactococcus (P < 0.05), and the concentration of GSH-Px was significantly positively correlated with the abundance of Eubacterium_hallii_group and Moryella (P < 0.05) (Figure 12).
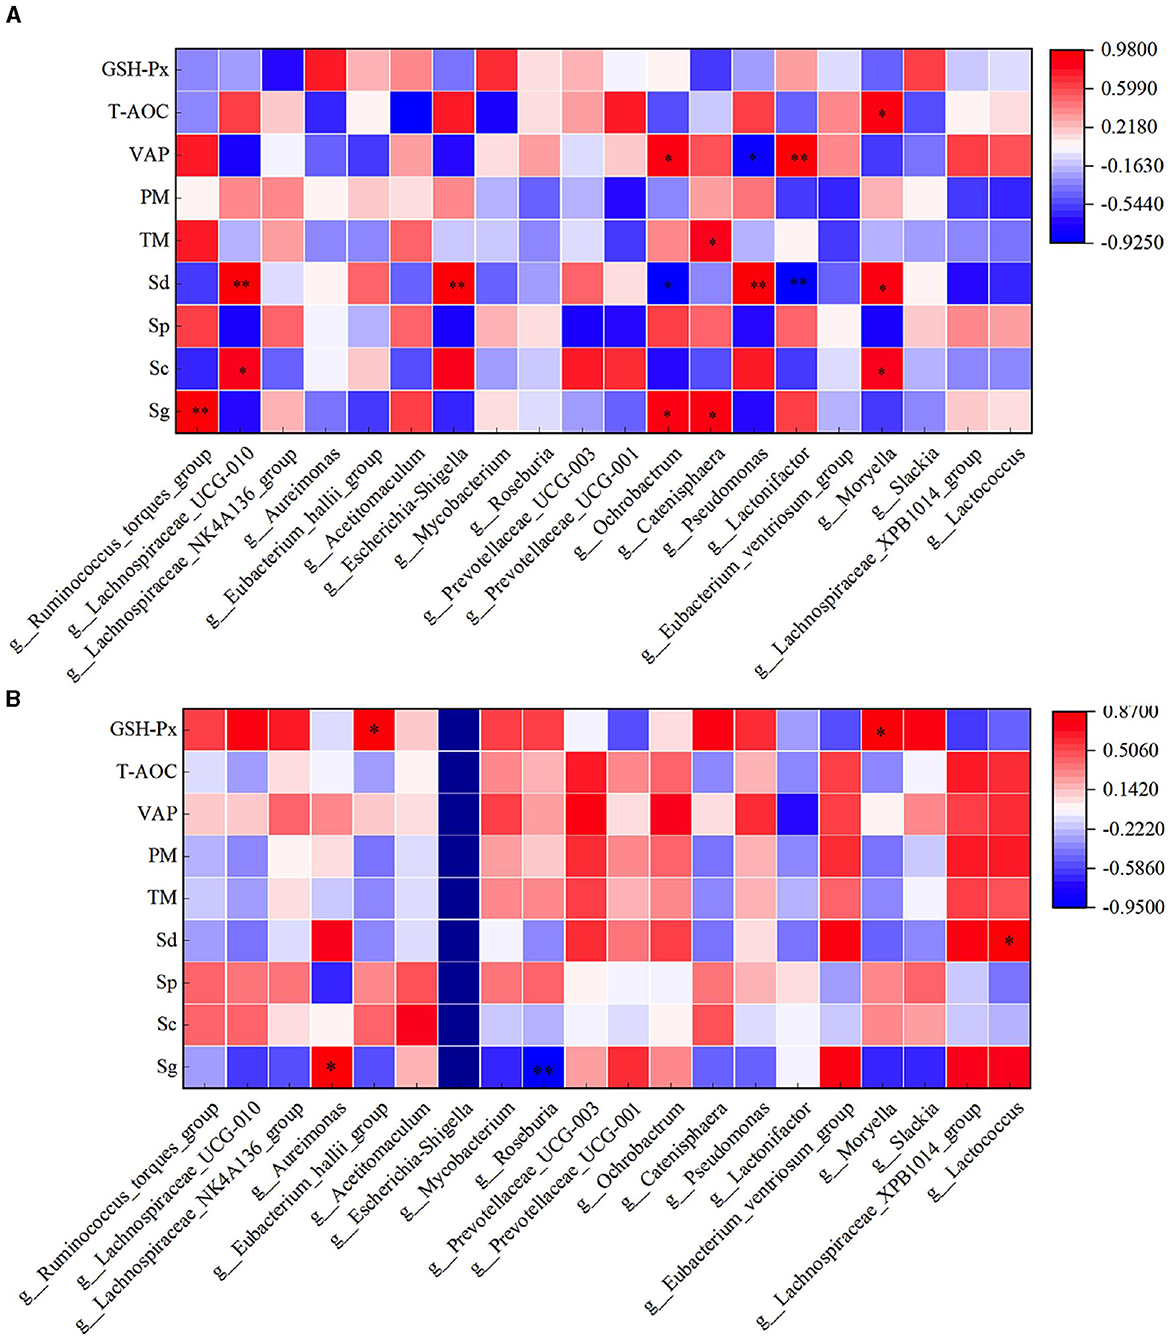
Figure 12. Correlation analysis of spermatogenic cells, fresh sperm index, and rumen flora in the HFC and HFT groups. (A) indicates the HFC group, and (B) denotes the HFT group. *indicates a significant difference between groups where P < 0.05. **indicates a significant difference between groups where P < 0.01.
In the HFC group, both TM and PM exhibited significant positive correlations with the abundance of Aureimonas (P < 0.05). VCL displayed a significant positive correlation with the abundance of Acetitomaculum (P < 0.05) and a significant negative correlation with the abundance of Prevotellaceae_UCG-001 (P < 0.05). Furthermore, VAP demonstrated a significant positive correlation with the abundance of Aureimonas (P < 0.05). T-AOC content was significantly negatively correlated with the abundance of Lachnospiraceae_UCG-010, Escherichia_Shigella, Pseudomonas, and Moryella (P < 0.05). CAT content displayed a significant negative correlation with Roseburia abundance (P < 0.05), and GSH-Px concentration was significantly negatively correlated with Catenisphaera abundance (P < 0.05). In the HFT group, both TM and PM were significantly negatively correlated with the abundance of Mycobacterium and Pseudomonas (P < 0.05). PMI showed a significant negative correlation with the abundance
留言 (0)