
記住我


Unnatural epidemics (UEs) are caused by human intervention and may be deliberate or accidental releases of naturally occurring or altered pathogens (1). UEs cause substantial harm due to their wide range of infectiousness, rapid transmission, insidious processes, and multiple transmission methods (2). The intricacy of crowd behaviors and uncertainty regarding time and geography in UE outbreaks make prevention and control difficult (3).
This emphasizes the importance of early identification, prediction, and warning in UEs (4). Mathematical models and analysis tools can help combat UEs in prediction, early warning, and risk assessment (5). A study has proposed a model for labeling abnormal outbreak patterns to predict the development trends of complex pathogens (6). To achieve automatic early warning and response to UEs, some scholars have proposed real-time surveillance and aberration detection algorithms for enhanced outbreak monitoring (7). In addition, analysis tools can use simple scoring rules to complete a risk assessment of UEs. Scholars can use the analysis tools to assess the needs of applied epidemiology and training programs to develop greater capacity (8) and rank highly hazardous microorganisms. To better integrate various mathematical models and analysis tools for disease prediction, early warning, and risk assessment, disease surveillance systems have emerged as practical application tools. Current disease surveillance systems require early warning mechanisms that can detect a significant increase in confirmed cases by analyzing historical data. However, these methods cannot estimate outbreak size or detect new UEs. The data on UEs are scarce, making projections less accurate. Existing mathematical models and analysis tools for prediction, early warning, and risk assessment of UEs lack comprehensive review.
Therefore, this study aims to address the following research questions: What kinds of mathematical models or analysis tools have been developed for risk assessment of UEs? How should the suitability of the mathematical models and analysis tools be verified? What is the application of mathematical models and analysis tools embedded in surveillance systems? By reviewing relevant literature, this study will provide insights into mathematical models and analysis tools used for quantifying the risk of UEs. The findings will assist public health officials in making timely projections and decisions about UEs.
2 Methods 2.1 DesignThis scoping review was conducted using the recommended PRISMA-ScR (Preferred Reporting Items for Systematic Reviews and Meta-Analyses extension for Scoping Reviews) guidelines published in 2018 (9). Supplementary material S1 provides the PRISMA-ScR Checklist.
2.2 Information sources and search strategyA rigorous literature search was conducted from inception to 31 December 2023 using various online databases, such as PubMed, Web of Science, Scopus, and Embase. A combination of three types of keywords for the issue is necessary: subjects (words such as bioterrorism), purposes (words such as predict), and methods (words such as model) (10). These search terms are limited to the title, abstract, and keywords of the articles. Logical operators “AND” and “OR” were used to combine terms to meet PubMed, Web of Science, Scopus, and Embase standards. Appropriate filters and keywords were selected for the four databases. Supplementary material S2 provides detailed search strategies.
2.3 Selection of studiesAll peer-reviewed sources were reviewed independently by two authors. A third author resolved disagreements. A total of 1992 articles were reviewed, and after de-duplication using Endnote X9 (Clarivate Analytics, United States), 1,103 articles met the nadir criteria to enter the data extraction stage. Seventy-one articles were screened for initial inclusion based on the constraints of the selected metrics in this study. Twelve articles were chosen using snowball sampling. Seventeen of the eighty-three articles were eliminated because the necessary metrics could not be derived. Finally, 66 articles were reviewed in this study (Figure 1). The study selection form is shown in Supplementary material S3.

Figure 1. Flowchart depicting the study design.
2.4 Data extractionData were extracted from all identified studies using a predefined format. Variables included year of publication, country, first author, journal, and so on (10). Supplementary material S4 provides the data extraction form.
2.5 Characteristics of the included studiesBased on the current literature, risk assessment of UEs began to attract scholars from all fields in the 21st century, with more than 60% of the articles coming from the United States, which dominates research on mathematical models and analysis tools for risk assessment. Sixteen other countries have also published corresponding articles. Thirty-five journals contributed sixty-six articles to the study. With six articles, Emerging Infectious Diseases, Morbidity and Mortality Weekly Report Supplements, and Risk Analysis contributed the most articles. Supplementary material S5 summarizes the characteristics of the included studies. Supplementary material S6 displays the articles published in risk assessment studies using mathematical models and analysis tools.
2.6 Evidence synthesisThis scoping review used descriptive-analytical methods. The graphs were designed using R statistical software (version 4.1.3).
3 Categorizing of mathematical models and analysis tools for risk assessment of UEs 3.1 Data-driven modelsData-driven models are commonly used in statistical or machine learning methods such as support vector machines. Based on goodness-of-fit rather than mode-of-action or mechanism, data-driven models use correlations to find the optimal input variables to predict desired outputs. Therefore, their structure is “driven by the data” (11). Table 1 summarizes data-driven models for risk assessment of UEs.
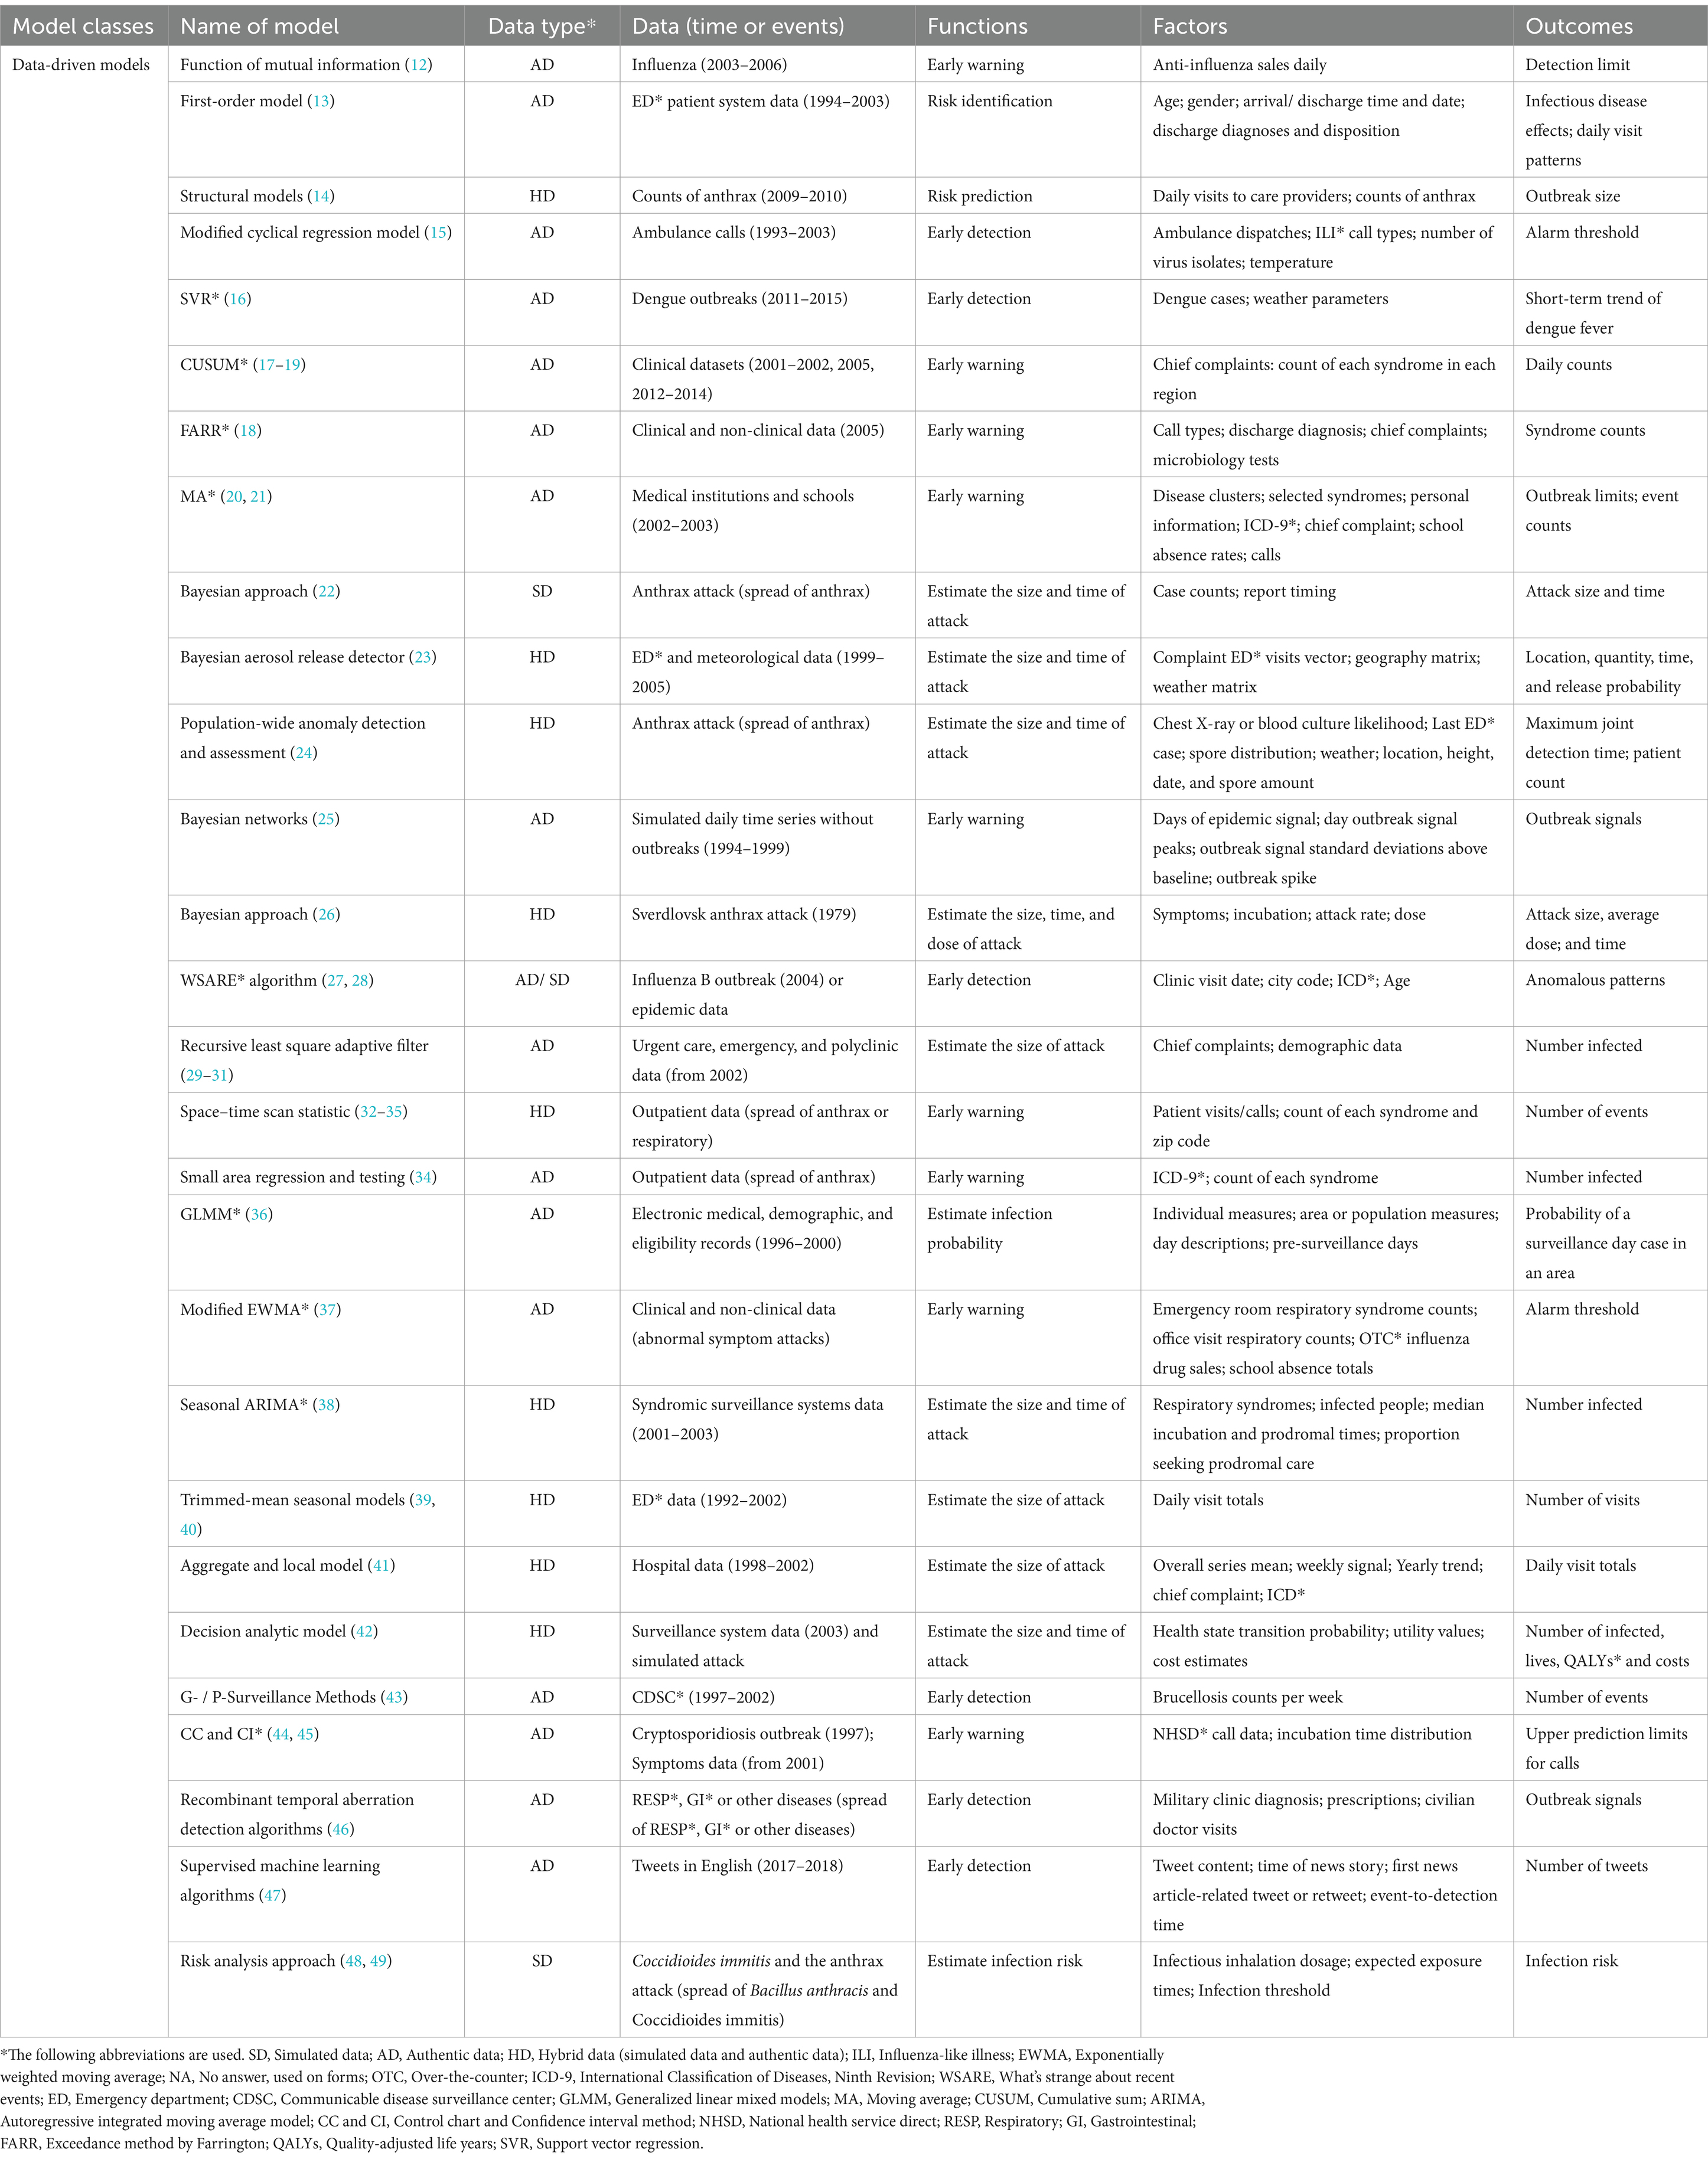
Table 1. Summary of data-driven models for risk assessment of unnatural epidemics.
3.1.1 Application I: detect outbreaksData-driven models have important applications in prediction. The first application is to detect outbreaks of UEs. The function of mutual information (12) uses daily anti-influenza drug sales to determine detection limits (thresholds) of UEs to complete early warning. A first-order model (13) can identify outbreaks 1–2 weeks before respiratory disease events. This model uses patient monitoring data, including age, complaints, and discharge diagnoses. Structural model (14) predicts the outbreak level 2 weeks after the alert using real and simulated anthrax exposure counting with noise. This model can detect and predict partially observed epidemics. Modified cyclical regression model (15) uses ambulance dispatch data for outbreak detection to measure influenza mortality and report the alarm threshold. Support vector regression (16) links dengue cases with weather parameters and predicts 20-week dengue trends. Cumulative sum (CUSUM) method (17–19) and exceedance method by Farrington (FARR) (18) are often used for early warning. A “signal” is generated in the system when the observed and expected count disparities exceed a threshold. CUSUM is widely used to report the epidemic severity of regional outbreaks in a system. UEs can also be tracked by the moving average of numerous data cycles (20, 21). Furthermore, data-driven models can track public opinions during outbreaks. Using supervised machine learning algorithms (47), researchers can identify anthrax-related tweets. Plotting data over time helped determine if an event was detected (based on a spike in the number of tweets occurring three times). This shows that machine learning can use not only conventional clinical data but also public opinion data for outbreak detection.
3.1.2 Application II: predict the size and time of attacksThe second application is directed at predicting the size and time of attacks. Bayesian methods and networks (22–26) can predict simulated anthrax attacks using case counts and attack time. Bayesian methods can quickly assess the extent and time of a biological error attack and predict how many people will develop symptoms and need medical care. The What’s Strange About Recent Events (WSARE) algorithm (27, 28) reports anomalous patterns based on time, location, and population at risk to construct an outbreak risk profile. The recursive least square adaptive filter (29–31) detects short-term outbreak signals because it emphasizes recent past data while calculating forecast counts. Space–time scan statistics (32–35) prioritize temporal and geographical partitions based on attack size and time. Furthermore, generalized linear mixed models (36) estimate the infection probability of being a case for a surveillance day in a setting area. Time series analysis, such as the modified exponentially weighted moving average technique (37), the seasonal autoregressive integrated moving average model (ARIMA) (38), trimmed-mean seasonal models (39, 40) and ARIMA (39), is frequently used to examine epidemic trends. It uses count data to predict outbreaks and detect abnormal epidemics early.
3.1.3 Model performanceWith the emergence of more and more mathematical models for the risk assessment of UEs, there is a growing focus on evaluating the performance of these models. Some studies (34, 41) use a single input data or multivariate aggregated data to check the sensitivity of the model prediction performance. The results prove that two-stream surveillance is superior to one-stream surveillance. Model performance can also be measured by model practice effectiveness. Decision-analytic model (42) predicts lives, quality-adjusted life years (QALYs), and costs for a series of simulated bioterrorist attacks. However, false positives of the model were also noticed. G-/P-surveillance methods (43) that use only incidence case count data set the time to 21–30 days or 1 year to detect a relatively sudden increase in incidence. It greatly reduces false alarms but decreases sensitivity. Control chart and confidence interval methods (44) use call data and incubation periods for early warning of outbreaks. In comparison, the control chart for false alarm control is stricter. On top of having case data, different models incorporate additional data based on factors affecting the issue. Recombinant temporal aberration detection algorithms (46) also employ outpatient diagnoses, volume, and other relevant factors to decompose existing temporal aberration detection algorithms into two consecutive phases. This method investigates the impact of each phase on outbreak detection performance by reporting outbreak signals. In addition, the algorithms enhance the model’s detection of UEs.
3.2 Mechanistic-based modelsMechanistic-based models use mechanisms and algorithms regardless of data availability (50, 51). Data are used to fit these mechanistic-based models and enable their operations. They aim to describe causation, although they typically contain empirical components as well (11). Table 2 summarizes mechanistic-based models for risk assessment of UEs.
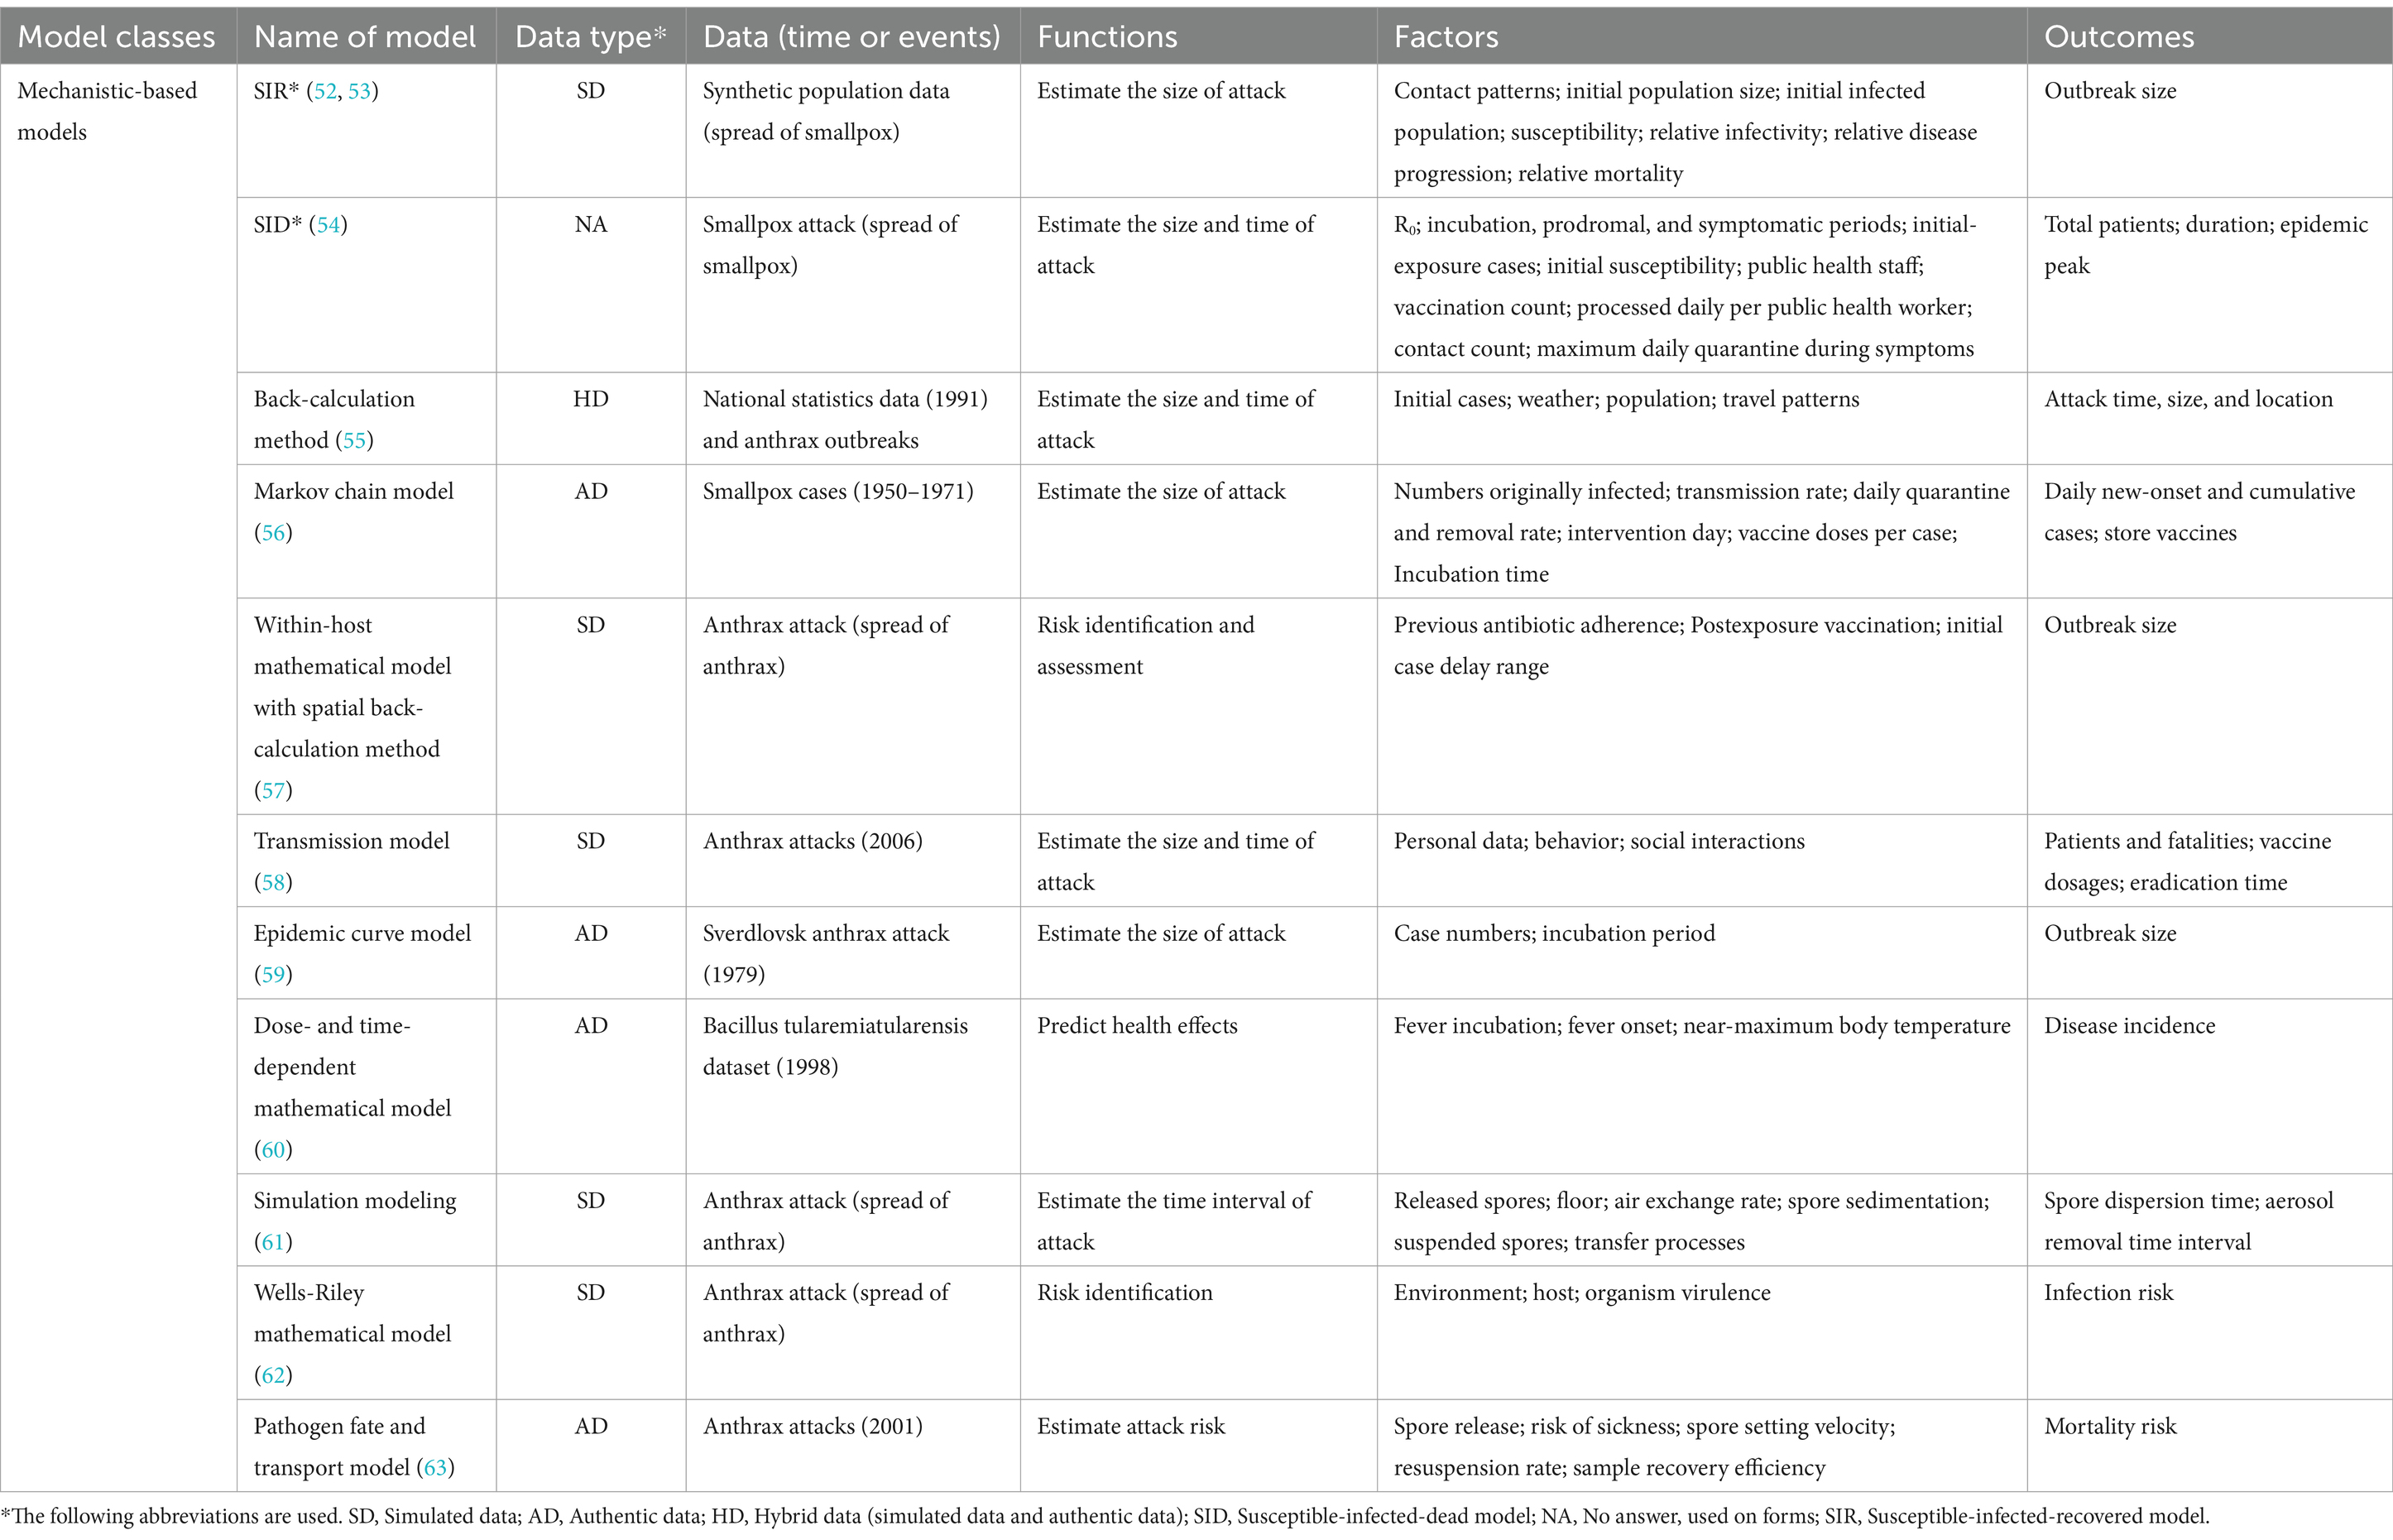
Table 2. Summary of mechanistic-based models for risk assessment of unnatural epidemics.
Mechanistic-based models for risk assessment of UEs mainly rely on infectious disease transmission mechanisms to construct a skeleton-like framework and commonly include Susceptible-Exposed-Infected-Removed (SEIR) models (52, 54), disease propagation differential equations, and other models (64, 65). Unlike data-driven models, mechanistic-based models emphasize fitting the model to the data. Mechanistic-based models can predict the size of UEs. A probabilistic anthrax model (55) uses a Markov chain Monte Carlo sampling algorithm to estimate the outbreak size. It evaluates post-anthrax release mitigating measures to better estimate unnatural outbreaks. Most mechanistic-based models (53, 56–59) predict cumulative infections, daily numbers of infections, and the size of UEs based on pathogen transmission in the target population. These models create rapid reaction systems and procedures by identifying and geospatially analyzing UEs. A few mechanistic-based models focus on the impact of dose–response mechanisms on the risk assessment of UEs. Input indicators are crucial to dose–response models (48, 49, 60–63). The input indicators can be included in clinical indicators (e.g., human respiration rate), environmental indicators (e.g., indoor room area), and pathogen dispersal indicators (e.g., spore dispersal rate). Dose–response models can estimate the size and timing of UEs for airborne pathogen infections, using human, environmental, and pathogen data to assess infection risk. Dose–response models can provide a reliable reference for risk assessors and healthcare decision-makers.
3.3 Analysis toolsIn addition to data-driven and mechanistic-based models, analysis tools are often applied to UEs. Analysis tools, including qualitative and quantitative tools, enable decision-makers to quickly and reliably differentiate between natural epidemics and UEs (66). Scores are assigned based on answers, similar to questionnaire scoring. Finally, these characteristics are scored to reflect the risk of UEs. Table 3 provides analysis tools for risk assessment of UEs.

Table 3. Summary of analysis tools for risk assessment of unnatural epidemics.
A qualitative tool (67) presents epidemiological clues that highlight features of an epidemic that may suggest an unnatural attack. Another class of quantitative tools (68–77, 79–81) can calculate the risk factor scores to differentiate between natural epidemics and UEs. If the risk factor scores exceed the threshold, the event is likely unnatural. Such a simple and useful scoring method enables rapid differentiation between biological attacks and other epidemics, shortens the time for decision-makers to report the epidemic situation, and develops appropriate responses. Some scoring tools (8, 78) also assess biological weapon danger.
4 Validation of mathematical models and analysis tools for risk assessment of UEsModel validation checks if a “model reliably reproduces the crucial behavior and quantities of interest within the intended context of use” (82). Model validation enhances model performance and applicability. The general analytical perspective of model validation starts with model uncertainty. Model uncertainty requires further refinement or tests of the model itself to affect final results. The validity of models and tools is increased by calibration (12, 14), improvement (74–76), and comparison (13, 55, 59, 63) under model uncertainty. Table 4 shows the model validation.
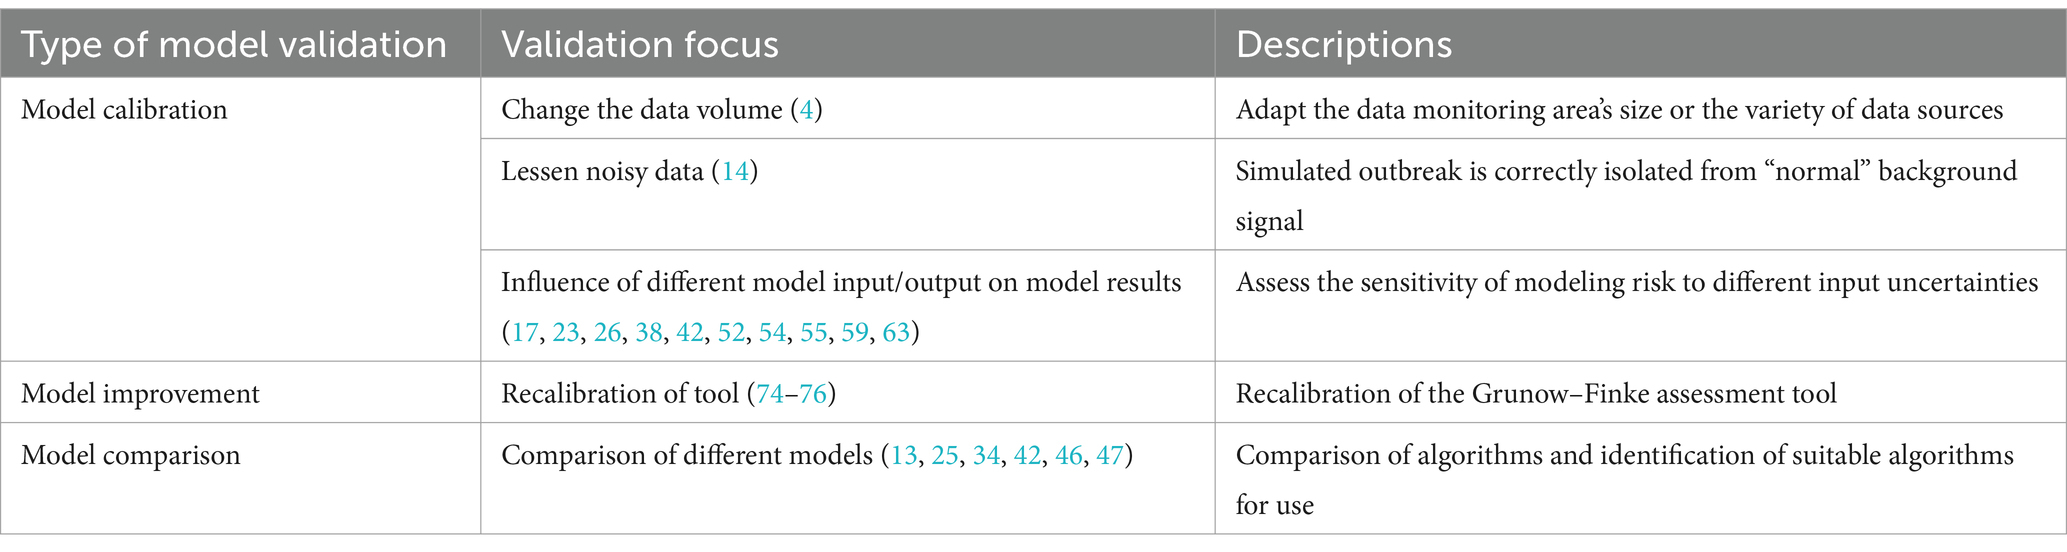
Table 4. Validation of mathematical models and analysis tools for risk assessment of unnatural epidemics.
4.1 Model calibrationModel calibration is a performance test of the model that has been built. Model calibration, which adjusts model parameters to match experimental data, affects a model’s ability to predict the future (83). This approach is particularly useful when a model involves multiple inputs or parameters (84). This study summarizes three directions for model validation.
First, it involves changing various inputs or model parameters (17, 23, 26, 38, 42, 52, 54, 55, 59, 63). Different model input–output combinations are tested to see how they affect results. Modeling risk sensitivity to input uncertainties is commonly studied. Then, method validation analyses the same scenario for different combinations of inputs and is assessed with evaluation indicators, such as R-squared, root mean square error (RMSE), mean square error (MSE), mean absolute error (MAE), mean absolute percentage error (MAPE), sensitivity, and receiver operating characteristic (ROC) curve. In addition to modifying model inputs and outputs, model misspecifications can affect model estimate accuracy. Legrand et al. (55) replicated the process of estimating anthrax spread in a model but intentionally misspecified parameter values, data, or model structure. The results suggest this can affect model estimation accuracy. Second, it involves reducing the influence of noisy data on genuine data. Background subtraction can test the multiple forward predictions of the established structural model (14). The final model was able to correctly isolate the simulated epidemic from the “normal” background signal. Third, it involves changing data sources to test model applicability. One approach (12) is to expand the monitored area by collecting data on daily sales of disease-related drugs. Researchers can then check drug purchase records for abnormalities to assess whether an epidemic has occurred. To test the sensitivity of the model’s prediction ability, another approach (34, 41) involves using a single input data set and multivariate aggregated data. Model calibration is common when a system is poorly understood or measured (83). However, model calibration is difficult because quantitative epidemic prediction models have many parameters to calibrate. Thus, poor parameter determination is the main obstacle to model prediction accuracy.
4.2 Model improvementModel improvement extends beyond method validation. It involves calibrating the model to increase event risk assessment accuracy. This process typically leads to improved accuracy of a single model. The original technique is insensitive to unnatural infectious diseases and is weak at spotting previous epidemics with known causes. The Grunow-Finke tool (GFT) is the best-known tool for such differentiation. The recalibration of GFT for identifying UEs (74–76) involved removing criteria from the old GFT. In addition, it also adjusts weighting factors for additional criteria and reintroduces significant ones. It sets evaluation tools that identify the thresholds of natural epidemics and UEs, too. Model improvement focuses on the lower sensitivity and specificity of the model or tool to improve the broad applicability of them. Model improvement involves reviewing the original model’s assumptions and determining if existing changes conflict with existing data.
4.3 Model comparisonKnowing the right model’s structure may make it more interesting to determine its absolute performance. This situation involves model comparison for various defined models (83). Model comparison involves comparing and observing the results of different methods for the same problem. It compares multiple models to prove its performance. Building multiple models for the same problem and comparing their predictions help determine the best model and algorithm for forecasting unnatural outbreaks (13, 25, 34, 42, 46, 47). In general, when assessing model outbreak thresholds, three or more standard deviations from the baseline model can be used. Exponentially weighted moving averages (EWMA) (13) can be used as a method to modify the forecast based on recent errors. Finally, various models are compared to the baseline model to assess its predictive power. Accuracy, recall, F1-score, sensitivity, specificity, ROC, and p-value measure model efficacy. When attempting to predict UEs, not all models can be assessed for efficacy using the same set of evaluation indicators. This is where attention must be paid to model comparison for risk assessments of UEs.
5 Difference between natural epidemics and UEs in mathematical models and analysis toolsMathematical models and analysis tools are used for UEs in our review, but they can also be used to determine the occurrence of natural epidemics. The difference exists between natural epidemics and UEs when using mathematical models and analytical tools. The values for natural epidemics and UEs are not the same in the choice of model parameters (60, 62, 63) and warning thresholds (19). However, some studies (13, 20, 44) have also pointed out that some models and tools used for natural epidemics are currently unlikely to provide early detection of UEs. In the current study, data-driven models and mechanistic-based models are less likely to mention the difference between natural epidemics and UEs in terms of model use.
6 Mathematical models and analysis tools for risk assessment in various surveillance systemsSeveral syndrome surveillance systems have been created recently to detect natural epidemics and UEs. Mathematical modeling of surveillance systems has two general directions. One approach simulates various UEs. The second approach is to evaluate warning algorithms for reported event outbreaks using surveillance system data. Currently, the system’s mission is to detect historical outbreaks and determine when the disease will be detected. The systems used in this study are divided into three types: event-based surveillance systems, indicator-based surveillance systems, and hybrid surveillance systems. Supplementary material S7 shows the mathematical models and analysis tools applied in the surveillance systems.
6.1 Event-based surveillance systemsEvent-based surveillance systems use unstructured data from non-health-sector sources (85). Frequently, data seen daily in society, such as drug sales and absence data, are used as early warning signals (86). It is a common way for such surveillance systems to conduct risk assessment with mathematical models, such as the National Health Service Clinical Assessment System (NHSCAS) and Early Alerting and Reporting (EAR) project. NHSCAS (44, 45) provides early warning of outbreaks caused by UEs or more common infections. The syndrome surveillance system overlays cryptosporidiosis epidemic data onto a statistical model of health hotline (NHS Direct) call data to test it. It calculates the upper limit of prediction for the proportion of diarrhea calls using the confidence interval and control chart methods. A scored risk assessment tool is used in the EAR project (72). It is based on the etiology, health effects, clinical presentation, and epidemiology of the project’s event or outbreak, as well as the sources of information and the potential for intentional release.
6.2 Indicator-based surveillance systemsIndicator-based surveillance systems generally analyze data routinely collected from healthcare facilities through institutional disease reporting (87). WSARE algorithm (27, 28) detects outbreak-related anomalies. Date-indexed biomonitoring data (e.g., emergency department data) feeds the algorithm. By comparing date events, statistically significant abnormalities are found and analyzed for early warning. Demographic and hospital monitoring data will alert systems to UEs (19, 20, 29, 30). If a signal exceeds the statistical distortion threshold, an alarm is raised. Commonly used models for this type of system are time series methods (moving average method), CUSUM, and recursive least square adaptive filter. The WHO recommends event-based surveillance to supplement indicator-based surveillance. Indicator-based surveillance may not uncover outbreaks and major public health problems. Additionally, current techniques cannot detect rare but significant outbreaks such as Ebola and avian influenza, as well as novel diseases (86).
6.3 Hybrid surveillance systemsHybrid surveillance systems use both event and indicator variables to construct the model. Mostashari et al. (15) monitor UEs using ambulance dispatch calls. They also employ statistical techniques to measure retrospective data on influenza-like illness (ILI) call types. An alarm was raised when the observed ILI rate exceeded the expected upper confidence limit by 1 day. A system that uses a dengue prediction model using support vector regression (16) relates cases to weather parameters (i.e., temperature, humidity, and rainfall). Even with a small amount of data training, the system can capture dengue trends. The national bioterrorism syndromic surveillance demonstration program (32, 33) combines incidence counts and zip codes to predict the number of episodes of illness using space–time scan statistics. Absenteeism rates (21) are used in system data to track abnormal occurrences. A multi-data surveillance system (18) uses CUSUM and FARR by chief complaints, NHS call types, and the number of records assigned to each syndrome. They detect syndrome numbers rising slowly, acutely, and locally. Time series analysis employed by Early Notification of Community-Based Epidemics (ESSENCE) II (37) for early warning reveals that high-profile events may change detection and alert thresholds.
7 Strengths and weaknesses of mathematical models and analysis tools for risk assessment of UEs 7.1 Strengths of mathematical models and analysis toolsThis study involves two models and a class of tools with established theoretical and computational background. Data-driven models solve biosafety challenges and self-learn for epidemic prediction and monitoring, while mechanistic-based models use extensive knowledge of disease transmission mechanisms to forecast epidemics. This makes disease development more traceable. For decision-makers addressing biosecurity events, the analysis tools in this study are user-friendly and adaptable to multiple diseases. They facilitate quick collaboration among agencies to combat UEs. Machine learning methods are increasingly preferred by researchers in data-driven models. With massive data, machine learning is being applied in UEs. Machine learning enhances tracking and real-time reporting of highly hidden, short-spread, and rapidly spreading unnatural outbreaks.
7.2 Weaknesses of mathematical models and analysis toolsAlthough there are many variations of algorithms in data-driven models in terms of technical means, there are certain requirements for data. The data quality tries to be complete and accurate. If the quality of the data is not satisfactory, it is often necessary to find a way out of the algorithms. Therefore, data-driven models increasingly favor machine learning algorithms. Model parameter fitting makes mechanistic-based model prediction harder. The use of analysis tools, although simple, is generally not superior to the above two types of models in terms of accuracy for event identification.
8 Recommendations for the development and applications of mathematical models and analysis tools for risk assessment of UEs 8.1 Aspect I: improvementsMathematical models and analysis tools have advanced, but challenges remain. First, the difficulty of data collection; Complete and accurate data are crucial for data-driven models but limited for UEs. Mechanistic-based models are not influenced by external data, but parameters must be fitted multiple times to improve risk assessment. Second, updating the models is also challenging due to uncertain biological factors. Transmission characteristics of viruses and bacteria need to be accurately identified. Mechanistic-based models struggle with spatial predictions. At the same time, syndromic surveillance solutions typically target one illness. It has a limited ability to distinguish between outbreaks of individual diseases with similar syndromes.
8.2 Aspect II: promotional applicationsFully digitized demographic and health data and efficient testing and reporting systems are crucial for effective disease control. Mathematical models and analysis tools play a vital role in controlling epidemics by providing risk assessment. Future applications will focus on improving model parameters to consider social exposure, human activity, economic impact, and environmental impact. Machine learning algorithms will play a significant role in case detection, contact tracking, and intervention responses, narrowing risk assessment to smaller scales and shorter timeframes.
9 ConclusionUEs generate social and work disruptions, mortality, and economic losses due to their covert spread. Current research in this field focuses on analyzing the risk of UEs using symptoms and social data for prediction, early warning, and risk assessment. Mathematical models and analysis tools can be very useful for risk assessment of UEs. Now, using data-driven models combined with non-medical data (such as opinion data) for risk assessment of UEs is indeed becoming more prevalent. Most approaches for differentiating from natural epidemics and UEs globally use analysis tools. However, there are limitations to existing mathematical models and analysis tools, such as limited data availability and the inability to update models in real time. Risk analysis tools rely on data inputs such as data source validity and specified illness parameters of recognized pathogens, which is a limitation. Furthermore, the data used to generate the risk scores was gathered from multiple sources and at various points in time, which may be out of date or contain biases in some circumstances. Data and monitoring errors may also arise during actual events. Most importantly, the included studies, while showing that the models they examined were used for UEs, can also be used to identify the occurrence of natural epidemics. In the current study, mathematical models and analysis tools suggest a distinction between natural epidemics and UEs in the selection of model parameters and warning thresholds.
This review summarizes mathematical models and analysis tools for risk assessment of UEs. If data limitations persist, subsequent model development should focus on model structure or data. For example, the model structure can be improved by replacing the model calculation method to reduce data integrity dependence (e.g., combining a mechanism model with a data-driven approach). In terms of used data, data cleaning can interpolate missing values or consider noisy data. For model factors, the selection will affect the methods of model validation. High-quality surveillance data and indicators are necessary for future surveillance systems. Future model development should consider combining a mechanistic-based model with a data-driven model and learning in the pursuit of time-varying, high-precision risk assessment capabilities.
Data availability statementThe original contributions presented in the study are included in the article/Supplementary material, further inquiries can be directed to the corresponding authors.
Author contributionsJL: Conceptualization, Data curation, Formal analysis, Investigation, Writing – original draft, Writing – review & editing. YL: Conceptualization, Data curation, Formal analysis, Investigation, Writing – original draft, Writing – review & editing. ZM: Data curation, Formal analysis, Writing – review & editing. ZL: Data curation, Formal analysis, Writing – review & editing. GZ: Conceptualization, Supervision, Writing – review & editing. CC: Conceptualization, Funding acquisition, Supervision, Writing – review & editing.
FundingThe author(s) declare that financial support was received for the research, authorship, and/or publication of this article. This study was supported by the National Key R&D Program of China [2021YFC260050401].
Conflict of interestThe authors declare that the research was conducted in the absence of any commercial or financial relationships that could be construed as a potential conflict of interest.
Publisher’s noteAll claims expressed in this article are solely those of the authors and do not necessarily represent those of their affiliated organizations, or those of the publisher, the editors and the reviewers. Any product that may be evaluated in this article, or claim that may be made by its manufacturer, is not guaranteed or endorsed by the publisher.
Supplementary materialThe Supplementary material for this article can be found online at: https://www.frontiersin.org/articles/10.3389/fpubh.2024.1381328/full#supplementary-material
References4. Ministry of Government LegislationShin, GR . The definition of terrorism concept reflecting the change of terrorism in the anti-terrorism act. Gachon law. Review. (2020) 13:101–34. doi: 10.15335/GLR.2020.13.3.004
Crossref Full Text | Google Scholar
5. Mykhalovskiy, E, and Weir, L. The global public health intelligence network and early warning outbreak detection: a Canadian contribution to global public health. Can J Public Health. (2006) 97:42–4. doi: 10.1007/BF03405213
PubMed Abstract | Crossref Full Text | Google Scholar
6. MacIntyre, CR . Biopreparedness in the age of genetically engineered pathogens and open access science: an urgent need for a paradigm shift. Mil Med. (2015) 180:943–9. doi: 10.7205/MILMED-D-14-00482
PubMed Abstract | Crossref Full Text | Google Scholar
7. Zhang, H, Wang, L, Lai, S, Li, Z, Sun, Q, and Zhang, P. Surveillance and early warning systems of infectious disease in China: from 2012 to 2014. Health Plan Manag. (2017) 32:329–38. doi: 10.1002/hpm.2434
PubMed Abstract | Crossref Full Text | Google Scholar
8. Tomuzia, K, Menrath, A, Frentzel, H, Filter, M, Weiser, AA, Bräunig, J, et al. Development of a comparative risk ranking system for agents posing a bioterrorism threat to human or animal populations. Biosecur Bioterr. (2013) 11:S3–S16. doi: 10.1089/bsp.2012.0070
Crossref Full Text | Google Scholar
9. Tricco, AC, Lillie, E, Zarin, W, O’Brien, KK, Colquhoun, H, Levac, D, et al. PRISMA extension for scoping reviews (PRISMA-ScR): checklist and explanation. Ann Intern Med. (2018) 169:467–73. doi: 10.7326/M18-0850
PubMed Abstract | Crossref Full Text | Google Scholar
10. Fleuren, LM, Klausch, TLT, Zwager, CL, Schoonmade, LJ, Guo, T, Roggeveen, LF, et al. Machine learning for the prediction of sepsis: a systematic review and meta-analysis of diagnostic test accuracy. Intensive Care Med. (2020) 46:383–400. doi: 10.1007/s00134-019-05872-y
PubMed Abstract | Crossref Full Text | Google Scholar
11. Ellis, JL, Jacobs, M, Dijkstra, J, Van Laar, H, Cant, JP, Tulpan, D, et al. Review: synergy between mechanistic modelling and data-driven models for modern animal production systems in the era of big data. Animal. (2020) 14:s223–37. doi: 10.1017/S1751731120000312
PubMed Abstract | Crossref Full Text | Google Scholar
12. Kobari, T, Iwaki, K, Nagashima, T, Ishii, F, Hayashi, Y, and Yajima, T. Detection limit used for early warning in public health surveillance. Anal Sci. (2009) 25:795–800. doi: 10.2116/analsci.25.795
PubMed Abstract | Crossref Full Text | Google Scholar
13. Brillman, JC, Burr, T, Forslund, D, Joyce, E, Picard, R, and Umland, E. Modeling emergency department visit patterns for infectious disease complaints: results and application to disease surveillance. BMC Med Inform Decis Mak. (2005) 5:4. doi: 10.1186/1472-6947-5-4
PubMed Abstract | Crossref Full Text | Google Scholar
14. Cheng, KE, Crary, DJ, Ray, J, and Safta, C. Structural models used in real-time biosurveillance outbreak detection and outbreak curve isolation from noisy background morbidity levels. J Am Med Inform Assoc. (2013) 20:435–40. doi: 10.1136/amiajnl-2012-000945
PubMed Abstract | Crossref Full Text | Google Scholar
15. Mostashari, F, Fine, A, Das, D, Adams, J, and Layton, M. Use of ambulance dispatch data as an early warning system for communitywide influenzalike illness. New York City J Urban Health. (2003) 80:i43–9. doi: 10.1007/PL00022314
PubMed Abstract | Crossref Full Text | Google Scholar
16. Ali, MA, Ahsan, Z, Amin, M, Latif, S, Ayyaz, A, and Ayyaz, MN. ID-viewer: a visual analytics architecture for infectious diseases surveillance and response management in Pakistan. Public Health. (2016) 134:72–85. doi: 10.1016/j.puhe.2016.01.006
PubMed Abstract | Crossref Full Text | Google Scholar
18. Meyer, N, McMenamin, J, Robertson, C, Donaghy, M, Allardice, G, and Cooper, D. A multi-data source surveillance system to detect a bioterrorism attack during the G8 summit in Scotland. Epidemiol Infect. (2008) 136:876–85. doi: 10.1017/S0950268807009132
PubMed Abstract | Crossref Full Text | Google Scholar
19. Rhee, C, Burkom, H, Yoon, C, Stewart, M, Elbert, Y, Katz, A, et al. Syndromic surveillance system for Korea–US joint biosurveillance portal: design and lessons learned. Health Secur. (2016) 14:152–60. doi: 10.1089/hs.2015.0067
PubMed Abstract | Crossref Full Text | Google Scholar
20. Dembek, ZF, Carley, K, Siniscalchi, A, and Hadler, J. Hospital admissions syndromic surveillance--Connecticut, September 200-November 2003. MMWR Suppl. (2004) 53:50–2.
PubMed Abstract | Google Scholar
21. Lawson, BM, Fitzhugh, EC, Hall, SP, Franklin, C, Hutwagner, LC, Seeman, GM, et al. multifaceted syndromic surveillance in a public health department using the early aberration reporting system. J Public Health Manag Pract. (2005) 11:274–81. doi: 10.1097/00124784-200507000-00003
Crossref Full Text | Google Scholar
23. Hogan, WR, Cooper, GF, Wallstrom, GL, Wagner, MM, and Depinay, JM. The Bayesian aerosol release detector: an algorithm for detecting and characterizing outbreaks caused by an atmospheric release of Bacillus anthracis. Stat Med. (2007) 26:5225–52. doi: 10.1002/sim.3093
PubMed Abstract | Crossref Full Text | Google Scholar
24. Shen, Y, Adamou, C, Dowling, JN, and Cooper, GF. Estimating the joint disease outbreak-detection time when an automated biosurveillance system is augmenting traditional clinical case finding. J Biomed Inform. (2008) 41:224–31. doi: 10.1016/j.jbi.2007.11.002
Crossref Full Text | Google Scholar
25. Izadi, M, Buckeridge, D, Okhmatovskaia, A, and Tu, SW. A Bayesian network model for analysis of detection performance in surveillance systems. In: Amia Annual Symposium Proceedings Amia Symposium (2009):2009:276–280
PubMed Abstract | Google Scholar
28. Kaufman, Z, Wong, WK, Peled-Leviatan, T, Cohen, E, Lavy, C, Aharonowitz, G, et al. Evaluation of a syndromic surveillance system using the WSARE algorithm for early detection of an unusual, localized summer outbreak of influenza B: implications for bioterrorism surveillance. Isr Med Assoc J. (2007) 9:3–7.
29. Tsui, Fu-Chiang, Espino, Jeremy U., Wagner, Michael M., Gesteland, Per, Ivanov, Oleg, Olszewski, Robert T., et al. Data, network, and application: technical description of the Utah RODS winter Olympic biosurveillance system. In: Proceedings Amia Symposium (2002): 815–819.
30. Gesteland, PH, Gardner, RM, Tsui, FC, Espino, JU, Rolfs, RT, James, BC, et al. Automated syndromic surveillance for the 2002 winter Olympics: Table 1. J Am Med Inform Assoc. (2003) 10:547–54. doi: 10.1197/jamia.M1352
PubMed Abstract | Crossref Full Text | Google Scholar
31. Tsui, FC, Espino, JU, Dato, VM, Gesteland, PH, Hutman, J, and Wagner, MM. Technical description of RODS: a real-time public health surveillance system. J Am Med Inform Assoc. (2003) 10:399
留言 (0)