

記住我

Myocardial infarction (MI) and atrial fibrillation (AF) are two prevalent cardiovascular diseases. AF, in particular, is a well-established risk factor for several other cardiovascular conditions. The severity and mortality risk associated with AF increase significantly upon relapse. To manage and prevent new AF events, a range of medical and interventional therapies are available. These treatments aim to either normalize the rhythm or stabilize the heart rate. Among these approaches, AF ablation has emerged as a leading clinical treatment. However, its success rate varies, and approximately 20%–40% of patients may require additional treatment (1). Similarly, MI is a severe heart diagnosis associated with high mortality rates. Upon survival, the heart is most likely weakened, making the patient vulnerable to other diseases. In fact, 33% of patients experiencing MI die within a year (all causes of death) (2). However, some patients experience only a single event of MI and lead a normal and healthy life afterward. Most MI patients undergo cardiac catheterization and percutaneous coronary interventions in the acute phase, while medical therapies targeting clotting of blood and lipids, as well as lifestyle interventions, are provided to reduce the chance of recurrent events. Still, a significant proportion of MI patients suffer from relapse.
Many studies have been conducted to identify genetic variants that likely affect the risk of AF (3, 4) and MI (5, 6). While multiple variants have been identified and later replicated in other studies, these variants were identified when comparing all included cases of AF or MI with healthy controls. Some studies have been conducted to understand the genetics of patients experiencing recurrent AF (1, 7–10) and MI events (11–13). These are, however, mostly focused on either the patients’ response after treatment or the genetic effects on recurrence from known AF/MI variants or genes. Little effort has been made regarding the comparison of genetics between patients experiencing a single event vs. patients experiencing recurrent events.
To date, no comprehensive genome-wide association studies (GWAS) analysis has directly compared the genetic profiles of patients with recurrent events to those experiencing single events in either AF or MI. In this study, we explore whether statistically significant genetic differences exist between patients who encounter recurrent events (defined as two or more occurrences) of AF or MI and patients who only experience a single event. Notably, we do not differentiate cases based on the specific treatment received after the initial AF or MI event. By adopting this approach, we aim for a broad comparison to uncover potential genetic distinctions between patients with single events and those with recurrent events.
2 Methods 2.1 Cohorts 2.1.1 The HUNT studyThe Trøndelag Health study (HUNT) is a health-related population-based longitudinal study based on four rounds of data collection: HUNT1 (1984–1986), HUNT2 (1995–1997), HUNT3 (2006–2008), and HUNT4 (2017–2019). With a unique database covering clinical measurements, questionnaire data, and biological samples from roughly 230,000 inhabitants of the Trøndelag county from 1984 onward, it is one of the largest health study ever performed (14). A great benefit of the HUNT study is the connection to other health-related registries by use of the Norwegian unique personal identification number. These health registries include hospital and general practitioner registries, cancer registries, cause of death registries, and the prescription database.
In the current study, genotype data for 69,621 participants from HUNT2 and HUNT3 were used, and these were linked to questionnaire data and clinical measurements from HUNT1, HUNT2, and HUNT3, regional hospital records, the Nord-Trøndelag Hospital Trust (HNT), and the Norwegian Cause of Death Registry (COD). The HNT registry contains all ICD9 and ICD10 codes for hospital visits of these HUNT participants from August 1987 to April 2017. The COD registry spans the same period, with registered ICD9 and ICD10 codes for the primary and secondary causes of death.
2.1.2 The United Kingdom BiobankThe United Kingdom Biobank (UKBB) is a health-related population-based study consisting of approximately 500,000 middle-aged UK inhabitants. Sampling of the participants took place from 2006 to 2010, when questionnaires, clinical measurements, and biological samples were collected. Similar to the HUNT study, it is also linked to electronic health records that contain information about the participants’ hospital, general practitioner, and death records with ICD9 and ICD10 diagnose codes (15). Genotyped data are available for more than 480,000 of the participants, and in the current study, we use these data together with relevant questionnaire data, clinical measurements, and hospital and death records for the genotyped participants (of European ancestry). The hospital records span from December 1992 to September 2021. The death registry spans from 2006 until September 2021.
2.2 Genotyping and imputationGenotyping and imputation of the HUNT and UKBB participants have been described elsewhere (16, 17). Briefly, genotyping was performed using one of three Illumina HumanCoreExome arrays: 12 v.1.0, 12 v.1.1 with custom content (UM HUNT Biobank v1.0) according to standard protocols for the HUNT participants, and standard protocols for Affymetrix Applied Biosystems UK BiLEVE Axiom or Applied Biosystems UK Biobank Axiom array for the UKBB participants. Standard quality control was performed for the HUNT genotyping, as well as a UKBB-specific quality control for the UKBB genotyping. Imputation in HUNT was performed using 2,202 whole-genome sequenced samples from HUNT together with the Haplotype Reference Consortium (HRC) reference panel (18, 19), resulting in 25 million genetic markers. For UKBB, the HRC and UK10K+1000 Genomes reference panel were used, resulting in 90 million variants.
2.3 Definitions of traits and outcomesHospital records of HUNT and UKBB participants were used to determine cases of MI and AF as well as the number of events for each participant. An MI event is defined as the patient having a registered diagnosis of ICD10:I21-I24 or ICD9:410. An AF event is defined as a diagnosis of ICD10:I48 or ICD9:427.3.
In both UKBB and HUNT records, each diagnosis is registered as a main or bi-diagnosis (denoted as first and second diagnosis in UKBB), and we take both of them into consideration when determining the number of events for each participant. Limiting our analysis to only the main diagnosis while excluding bi-diagnoses introduces potential errors and significantly reduces the available data. Bi-diagnoses can be interpreted in various ways. For instance, consider a scenario where a patient is admitted to the hospital with a primary diagnosis, and additional diagnoses are identified and documented during that initial visit. Despite being new diagnoses, these are categorized as bi-diagnoses. Had they been the sole disease and reason for the hospital visit on that day, they might have been recorded as the main diagnoses. Alternatively, a physician might infer from historical records that certain other conditions (such as AF or MI) are relevant to the primary diagnosis and include them as bi-diagnoses, even if they are not recent events. Given the diverse reporting practices related to bi-diagnoses, we employ selective filtering to distinguish single events from recurrent events of MI and AF.
A first event is defined as the initial visit during which a specific diagnosis appears in the medical records, either as a primary (main) or as a secondary (bi-diagnosis) diagnosis. Subsequently, a second event is established if there exists a time gap of more than 1 month between the initial event and any subsequent occurrences. The second event must meet one of the following criteria: (i) it is recorded as a main diagnosis or (ii) it is a bi-diagnosis and the sole diagnosis documented on that particular day (indicating a genuinely new event reported at that time). Subsequent events are similarly categorized as second events, with a minimum interval of 1 month from the previously defined event. This event definition ensures the selection of new occurrences, except in cases where only main diagnoses are exclusively considered.
In our investigation of comparing patients with recurrent events to those who remain relapse-free, it is crucial to address the potential misclassification of patients with only a single recorded event. Specifically, we need to ensure that such patients are not erroneously categorized due to premature mortality before experiencing subsequent events. Analyzing the HUNT dataset, we observe that approximately 80% of secondary events occur within a 5-year window for AF and a 7-year window for MI. To mitigate this potential bias, we apply the following filtering criteria: First, we exclude single-event participants who have passed away either due to the phenotype itself or within the specified time frames after the initial AF or MI event. These time frames align with the observed secondary event patterns in the HUNT and UKBB datasets. Second, we remove participants registered with only a single AF or MI event if it occurred less than 5 (AF) or 7 (MI) years before the censoring dates (6 April 2017 for HUNT and 12 November 2021 for UKBB). The three trait groups are denoted as single AF/MI: participants that experience only one event of AF/MI, and recurrent AF/MI: participants that experience more than one event of AF/MI, while satisfying the conditions specified above.
Baseline and clinical characteristics, as well as information about other relevant diseases identified with the participants, were taken from the HUNT and UKBB hospital records, questionnaires, and clinical measurements. Participants were defined to have diabetes and/or hypertension if they have ever been registered with the ICD codes ICD10:E10-E14 or ICD9:250 for diabetes and/or ICD10:I10-I15 (excluding I11.0), and ICD9:401-405 for hypertension. The smoking variable was derived from the HUNT questionnaire response to the question: “Have you ever smoked?” (with options for “Yes” or “No”). For each patient, we utilized the most recent HUNT participation data available prior to the disease event. The corresponding variable in UKBB was “Ever smoked (Yes/No),” which was constructed upon sampling. To assess statistical differences in characteristics (age, diabetes, hypertension, BMI, smoking, cholesterol, systolic, and diastolic blood pressure) between groups with single vs. recurrent events, we employed the Student’s t-test for continuous variables and Fishers’ exact test for binary variables. Test statistics with Bonferroni-adjusted p-values (p<0.05/8=6.25×10−3) were considered significant findings.
2.4 GWAS meta-analysisTo identify genetic factors associated with single or recurrent events of AF and MI, we conducted three GWAS analyses for each trait in both cohorts separately: (i) patients with single events vs. healthy controls, (ii) patients with recurrent events vs. healthy controls, and (iii) patients with recurrent events vs. patients with single events. As a control, we also conducted a GWAS analysis in each cohort with all cases of each disease against healthy controls. Healthy controls were defined as participants with no registered events of AF and MI. Variants with minor allele count (MAC) <3 and an imputation score <0.3 were excluded from all GWAS results. Participants with non-European recent ancestry were excluded from the analyses in UKBB (note that all genotyped HUNT participants are of European ancestry). Association analyses were performed with SAIGE, using a generalized linear mixed model adjusted for relatedness and unbalanced case–control ratios (20). Birth year, gender, batch/chip, and the first four principal components were added as covariates in the models. Here, birth year is chosen instead of age at the time the event was recorded to facilitate the building of phenotypes based on a heterogenic set of data sources collected at different time points using multiple diagnostic codes. Genomic variants with minor allele frequency (MAF) >1% in one or both studies were included in the meta-analysis.
From the eight GWAS analyses (three for AF, three for MI, and one control for each disease) performed for both the HUNT population and the UKBB population, we performed eight fixed-effect inverse variance weighted (IVW) meta-analyses using METAL (21). In METAL, each variant is assigned a new effect size as the sum of each study’s effect size weighted by the corresponding study variance. The p-values in the meta-analysis are calculated based on the Z statistic given by the new effect sizes and standard errors. Variants reaching genome-wide significance (p-values <5×10⁻⁸) from the Z statistic were considered significant findings. Annotations of significant single nucleotide polymorphisms (SNPs), identification of nearest genes, and a search for nearby SNPs associated with relevant traits were performed with the FUMA platform and the GWAS catalog (22, 23). Variants were considered to be in the same genetic region if they were less than 500 kb apart, and genetic regions denoted as shared for both the single and the recurrent events meta-analysis were either consisting of the same SNPs or SNPs within the same genetic region. Observed scale genetic heritability of the traits were found using the LD Score Regression software (24), with precomputed LD Scores for Europeans from the 1000 Genomes reference panel (25) and summary statistics from the meta-analysis.
2.5 Phenome-wide association studiesPhenome-wide association studies (PheWAS) were performed on all SNPs from the meta-analyses reaching genome-wide significance. From the comprehensive Pan UKBB resource (26), we collected results from GWAS conducted on 1,326 phenocodes, and we identified the effect of each of our SNPs of interest on each phenocode. All GWAS results from the Pan UKBB are based on UKBB participants, and we selected results for European ancestry exclusively. For each set of SNPs (identified in common or specifically for either single or recurrent AF/MI), phenotypes with a p-value <0.05/(1326×nset), where nset is the number of SNPs in the set, were considered significant associations. For simplicity, only the SNP with the lowest p-value for each phenotype was selected from each set of SNPs.
2.6 Gene function and network analysesThe sets of nearest genes to the SNPs identified through the GWAS analyses as common or unique to either recurrent or single AF/MI events (in total six sets) were analyzed for tissue specificity (differentially expressed gene sets in each tissue). We employed both FUMA (22) and gene ontology enrichment using Fisher’s exact over-representation test in PANTHER (protein annotation through evolutionary relationship) (27). Here, biological processes with a false discovery rate (FDR) adjusted for multiple testing <0.05 were considered functionally enriched for the gene set. To further investigate the processes connected to these genes, we performed gene co-expression network analysis (28–30), where the hypothesis is that highly correlated genes have a regulatory relationship or similar response in a condition (31). Using the identified gene sets as target genes in an egocentric gene co-expression network analysis, we generated a network from the shared neighborhoods among the closest neighbor genes of each target gene in the gene set, and we inspected the gene functions in the network.
Creating these egocentric networks involves several steps. First, using gene expression data from GTEx v.8 (32) (https://www.gtexportal.org) gene co-expression networks for seven tissue sub-types from the heart, muscle, skeletal, artery, and kidney (GTEx_Analysis_v8_eQTL_expression_matrices.tar: Heart Atrial Appendage, Heart Left Ventricle, Muscle Skeletal, Artery Aorta, Artery Coronary, Artery Tibial, and Kidney Cortex) were created. Since co-expression patterns may vary in different tissues (31), a separate network was created for each tissue. Following the WGCNA approach (33), the link weight (strength of co-expression) between each pair of genes (i and j) were defined by the weighted topological overlap (wTO) in Equation 1:
wTOij=Aij+∑k≠i,jAikAkjmin(∑uAiu,∑uAju)+1−Aij,(1)where Aij=|cor(i,j)|6 is the absolute Pearson correlation of the gene expressions raised to a power 6 to emphasize the strongest correlations. The resulting gene co-expression network is then an all-to-all network where pairs of genes with high wTO-link weights represent strong connections between the genes and their topological neighborhood. Only the 15% strongest links from each tissue were included in the following analysis (still leaving about 30 million links) to avoid the inclusion of genes based on weak (and likely spurious) connections.
Next, for each of the seven tissues, egocentric networks for each target gene were extracted from the co-expression networks. The egocentric networks were filtered to include only the 25 genes with the strongest wTO-link weights with each target gene. By merging and further reducing the complexity of the networks, the 25 strongest linked genes to each target gene across all tissues were selected in the final network. Here, we weighted the link strengths using wTOijweighted=∑w=1WwTOij,w2, where W is the number of tissues in which the linked gene is among the 25 strongest linked genes to the target gene and wTOij,w is the corresponding wTO-link weight in tissue w.
The final six sets of egocentric networks for target genes identified as common or as unique for the single or recurrent AF/MI events were analyzed with the igraph R-package (34, 35). Shared neighboring genes were defined as genes linked to two or more of the target genes. The set of shared neighborhood genes for each network was plotted separately with Cytoscape (v. 3.8.1) (36) and gene ontology enrichment of these gene sets were obtained through the PANTHER over-representation test (27).
3 Results 3.1 Characteristics of trait groupsAmong the genotyped participants with European ancestry included in this study, there are 7,127 and 29,330 hospital patients registered with AF in HUNT and UKBB, respectively. Employing the filtering approach described in the Methods section, we identified 1,425 HUNT and 9,561 UKBB patients with single AF events and 2,267 HUNT and 7,267 UKBB patients with recurrent AF events. Correspondingly, 5,805 HUNT and 14,592 UKBB participants are registered with MI events. Of these, 1,651 HUNT and 6,584 UKBB patients are identified with single MI events and 1,615 HUNT and 1,615 UKBB patients are identified with recurrent MI events.
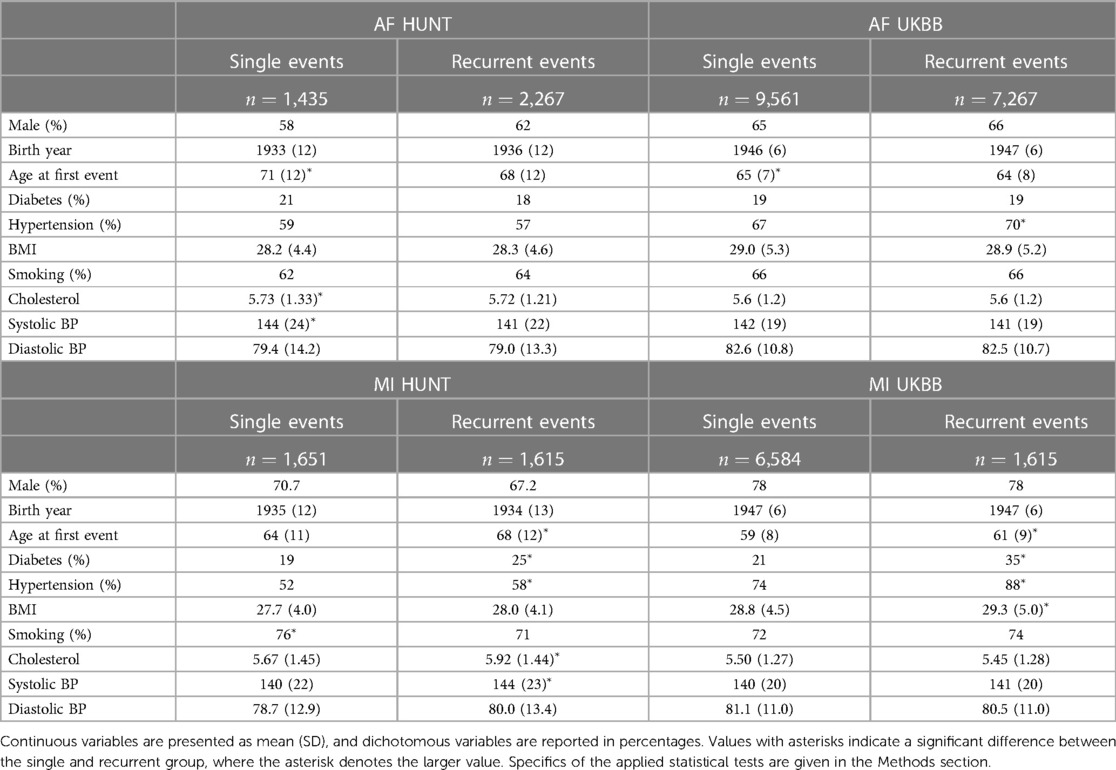
Baseline and clinical characteristics of these patients are presented in Table 1. In the HUNT study, a comparison between the two AF groups reveals a discernible pattern. The group experiencing a single AF episode tends to be older (adjusted p-value 2×10⁻¹⁰) and displays elevated levels of cholesterol and systolic blood pressure (adjusted p-values 6.1×10⁻⁶ and 5×10⁻⁴, respectively). Similarly, an examination of the AF groups within the UKBB reinforces this trend, with the single AF event group exhibiting higher age (adjusted p-value <10−16), along with marginally higher levels of BMI and systolic blood pressure compared to the recurrent AF group.
Table 1. Characteristics of sample groups of single and recurrent events of AF and MI in the HUNT and UKBB population.
However, the reverse trends emerge when analyzing the MI groups in the HUNT study. Here, patients experiencing recurrent MI events are older (adjusted p-value <10−16) and demonstrate higher rates of diabetes and hypertension (adjusted p-values 8.8×10⁻⁵ and 7.6×10⁻³, respectively), alongside elevated levels of cholesterol and systolic blood pressure (adjusted p-values 5.4×10⁻⁶ and 1.4×10⁻⁵, respectively). In addition, there is a tendency toward higher BMI and diastolic blood pressure within this group. These trends persist within the UKBB MI cohorts, where the recurrent MI event group exhibits higher age, BMI, and prevalence of diabetes and hypertension (adjusted p-values 6×10⁻¹⁴, 3.9×10⁻⁵, <10−16, and <10−16, respectively) compared to the single MI event group. Moreover, there is a tendency toward higher systolic blood pressure levels within the UKBB single MI event group.
In summary, our observations reveal distinct patterns between patients experiencing single AF events and those with recurrent AF events. Notably, the single AF event group tends to be older at their initial event and exhibits worse health conditions and lifestyle factors compared to the recurrent AF group. Based on these findings, we hypothesize that single AF events may be primarily influenced by age and lifestyle factors, whereas recurrent AF events may be driven by genetic factors. The characteristics related to MI point in the opposite direction, since patients experiencing recurrent MI events are older and generally exhibit worse health conditions and lifestyle factors compared to those with only one MI event (and survive it). For MI, we therefore consider two alternative hypotheses: (i) recurrent MI events are associated with the age at the first event and worsened health conditions and single MI events are driven by genetic factors, or (ii) both single and recurrent MI events share common genetic factors, but recurring MI events are influenced by higher age and other lifestyle factors, affecting the risk of subsequent MI occurrences.
3.2 Genetic differencesIn the following sections, we explore our hypotheses (as defined above) for AF and MI by investigating genetic differences between the groups identified through the GWAS meta-analyses.
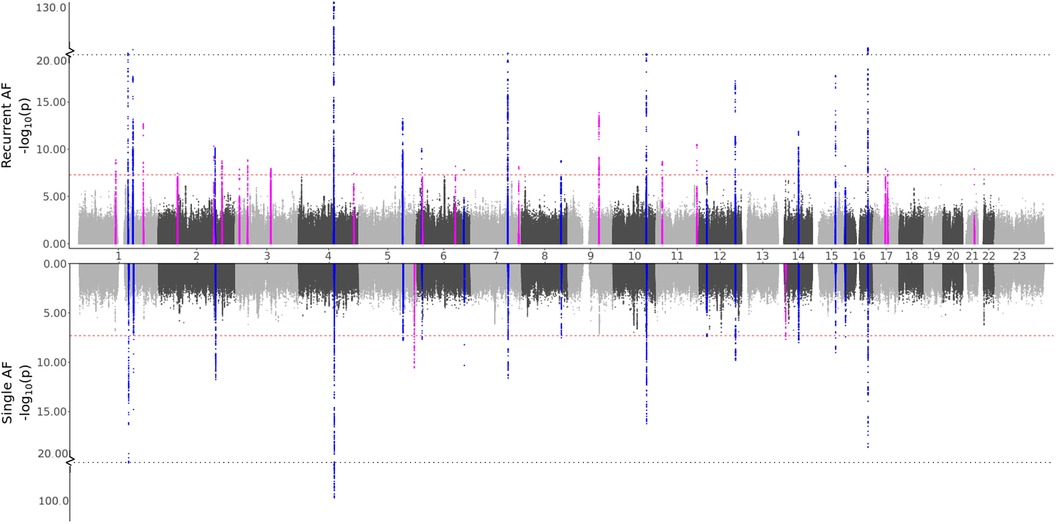
3.2.1 Genetic differences in AFTo test our hypothesis that patients experiencing recurrent AF events are more genetically susceptible than patients experiencing single AF events, we perform three GWAS meta-analyses (see Methods). The GWAS meta-analysis comparing single to recurrent AF events found no regions with significantly different effects. Some SNPs were identified to be of genome-wide significance in the HUNT population, but these were rare variants (MAF ≤0.2%), and we removed them through filtering prior to the meta-analysis. Comparing the GWAS meta-analyses of each group against healthy controls (Table 2 and Figure 1), we find that 18 regions are specifically associated with recurrent AF events: 2 are specifically associated with single AF events and 16 are identified in both GWAS investigations. Many regions comprise multiple SNPs that exhibit significant effects in only one of the study groups. Five regions identified in the recurrent AF GWAS study consist of only one SNP, yet these are identified with similarly strong effects in both the HUNT and the UKBB studies, indicating a genuine association. Regional plots of the single SNP hits uniquely associated with recurrent AF are shown in Supplementary File 1, Figures S15–S19. The presented results show that more than half of the identified regions are specifically linked to single or recurrent AF, supporting the hypothesis that patients who have experienced recurrent AF events are genetically more susceptible than those who have only experienced one event and survived it.
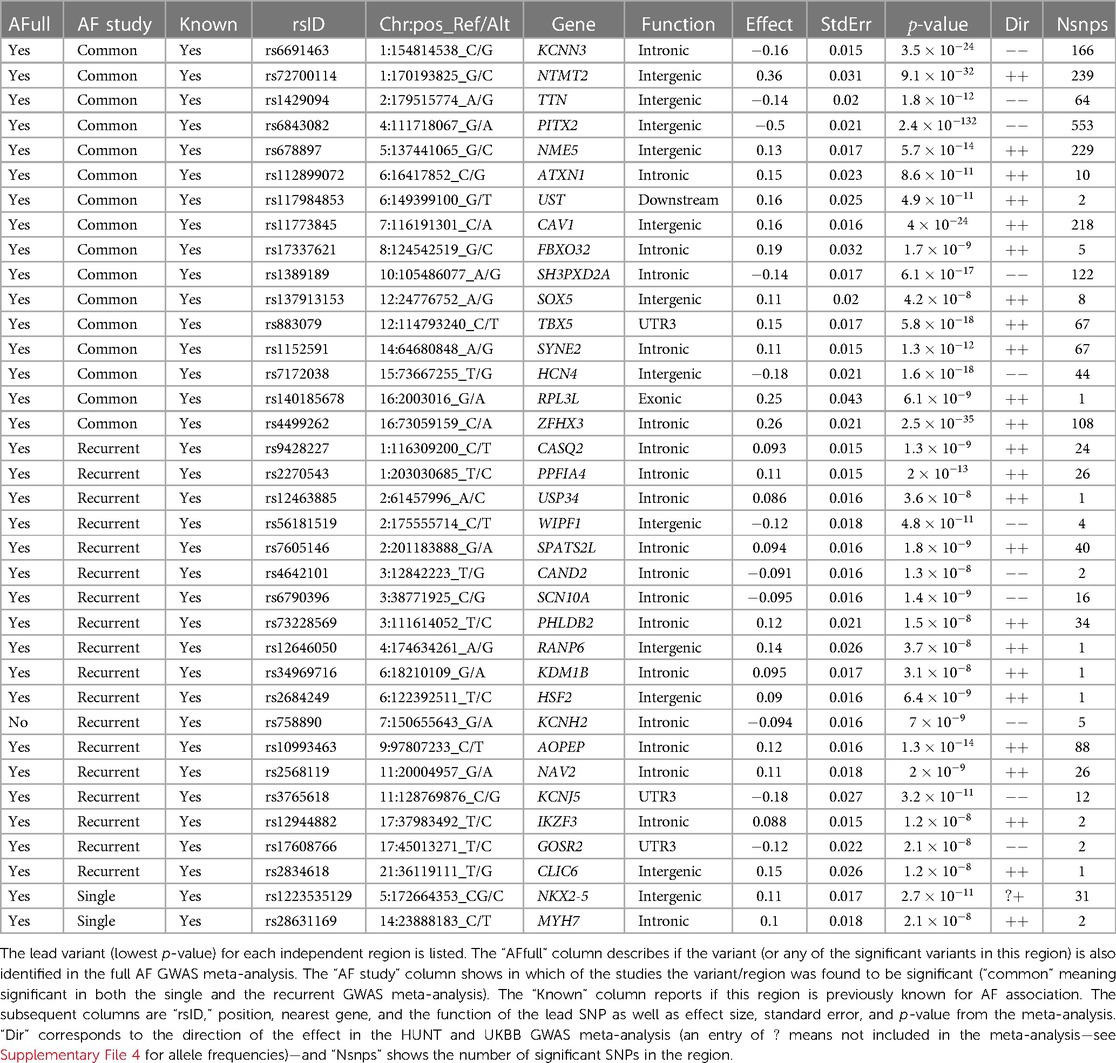
Table 2. AF variants found to be significant in the GWAS meta-analysis.
Figure 1. GWAS meta-analysis results for AF. Top: Comparing recurrent AF patients to AF-free controls. Bottom: Comparing single AF patients to AF-free controls. Blue spikes represent regions of SNPs found to be statistically significant in both GWAS studies (common), while magenta spikes represent statistically significant regions of SNPs specifically associated with the given AF group.
All regions had previously been associated with AF, and all regions except one (chromosome 7, in the KCNH2 gene) were identified in the full AF GWAS meta-analysis by comparing all AF cases against healthy controls. This indicates that all the regions identified as unique for single or recurrent AF (excluding the KCNH2 gene region) have an effect when compared to healthy controls, with the true effect being mainly or solely for patients experiencing single or recurrent AF. The five SNPs in the KCNH2 gene, however, are not detected in our full GWAS meta-analysis and therefore only show an effect for patients experiencing recurrent AF.
To our knowledge, only seven genes have previously been found to be associated with AF recurrence: SOX5, CAV1, EPHX2, ITGA9, SLC8A1, TBX5, and PITX2 (1, 8, 10, 37). Our findings show that regions proximate to the SOX5, CAV1, TBX5, and PITX2 genes are identified in both the single and the recurrent GWAS, yielding comparable effects. Thus, there is no evidence of differences in the impact of these regions between the two groups. Furthermore, no regions were identified near the EPHX2, SCL8A1, and ITGA9 genes. Variants near the NAV2 and SCN10A genes have previously been tested for their effect in recurrent AF events without any significant findings (37, 38). In this study, we discovered 26 and 16 SNPs located within and nearby the NAV2 and SCN10A genes, respectively, that are exclusively associated with recurrent AF, suggesting that these SNPs have a distinct effect on recurrent AF patients compared to single AF cases.
Several of the genes listed in Table 2 code for functions related to AF. Two of the genes listed as “Common” (KCNN3 and HCN4) and three genes identified uniquely for recurrent AF (SCN10A, KCNH2, and KCNJ5) are related to electrophysiological activity, coding for potassium and sodium channels. Other genes listed as “Common” in Table 2 code for functions directly linked to heart activity and AF (TTN, TBX5, SYNE2, and RPL3L) , or they are indirectly linked to AF through comorbidities (ATXN1, CAV1, SH3PXD2A, and ZFHX3). Two of the recurrent AF genes also code for functions directly or indirectly linked to AF (CASQ2 and GOSR2), and some genes indicate a possible indirect link related to comorbidities, e.g., hypertension or malignancy (PPFIA4, USP34, WIPF1, SPATS2L, CAND2, and AOPEP). The two genes uniquely identified for single AF events have been shown important for myocardial diseases and cardiac abnormalities, coding for functions found to be central in malformation in heart (NKX2-5) and myosin (MYH7).
The genetic observed scale heritability was found to be 0.0139 (SE 0.0024) for recurrent AF and 0.0086 (SE 0.0018) for single AF events.
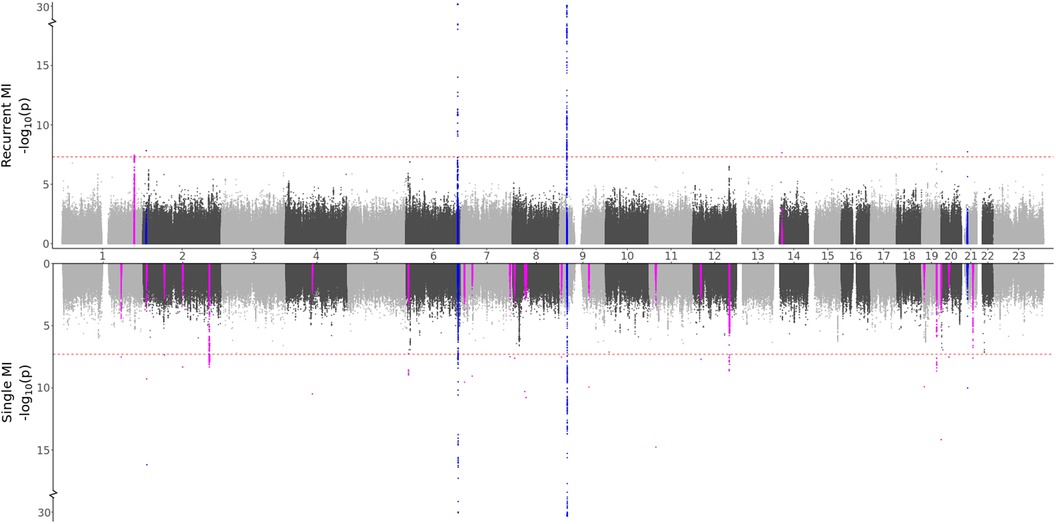
3.2.2 Genetic differences in MIBased on the characteristics of the two MI groups, we formulated two hypotheses: (i) Recurrent MI events are associated with the age at the first event and worsened health conditions and single MI events are driven by genetic factors, or (ii) Both single and recurrent MI events share common genetic factors, but recurring MI events are influenced by higher age and other lifestyle factors, affecting the risk of subsequent MI occurrences. Testing for direct genetic differences between the two MI groups, the GWAS meta-analysis (comparing single to recurrent events) did not detect any regions with significant effects. When testing for genetic effects in each group as compared to MI-free controls, the GWAS meta-analyses shown in Figure 2 and Table 3 identified four regions that are in common for both groups, 24 regions that are specifically identified for the single event group, and two regions that are unique for the recurrent events group. Hence, some genetic factors are common for both groups, but most identified genetic effects are unique to patients experiencing only one event of MI and surviving it. These results are in support of our first hypothesis.
Figure 2. GWAS meta-analysis results for MI. Top: Comparing recurrent MI patients to MI-free controls. Bottom: Comparing single MI patients to MI-free controls. Blue spikes represent regions of SNPs found to be statistically significant in both GWAS studies (common), while magenta spikes represent statistically significant regions of SNPs that are specifically associated with the given MI group.
Table 3. MI variants that are significant in the GWAS meta-analysis.
Some distinct regions, including the SNPs in the NBEAL1 and ATXN2 genes for single MI events and SNPs in the MIA3 gene for recurrent events, exhibit substantial effects for multiple SNPs in the region, with comparable effects in both the HUNT and UKBB populations. Several regions represent suggestive findings comprising only single SNPs and are only identified in the HUNT population (regional plots of the single SNP hits uniquely associated with single or recurrent MI are shown in Supplementary File 1, Figures S20–S39). However, as shown in Supplementary File 4, these variants are not HUNT-specific since they are reported with relatively high frequencies in the general European population. Hence, although they are rare in the UKBB population and thereby not included in the meta-analysis, including a different European study population could validate or dispute the effect identified here. Also, many of these regions are well-known for MI, further suggesting that these findings might be valid.
Comparing the GWAS meta-analysis of all MI cases to MI-free controls, we find that all four regions that were identified as common for single and recurrent MI (regions in or close to the genes HPCAL1, LPA, CDKN2A, and CXADR) were also found in the full MI GWAS meta-analysis. The two regions that were specifically associated with recurrent MI events (regions close to the MIA3 and NOVA1 genes) were also identified in the full MI GWAS, but nine of the regions specifically associated with single MI were not detected in the full MI GWAS (regions in or close to the genes OVAAL, TAF1B, GLI2, BBS9, MCPH1, GLIS3, HECTD4, INSR, and SYNDIG1). Hence, certain regions identified in the full MI GWAS are exclusively linked to either single or recurrent MI, and some regions are only observed when patients with single MI events are filtered out, emphasizing the need for sub-dividing the MI groups.
We notice that 24 regions are specifically associated with a single MI. Among these, 10 regions, proximal to or within the genes OVAAL, BMP3, RIOK1, AC096553.5, MCPH1, KCNU1, GLIS3, TUT7, TRIB3, and SYNDIG1, represent novel associations with MI and have not been previously linked to Cardiovascular disease (CVD)-related traits. These regions are predominantly characterized by a single SNP, with the exception of five SNPs in proximity to the RIOK1 gene. These SNPs are only identified within the HUNT population, barring the SNP near the KCNU1 gene. Interestingly, some of these regions encode for functions similar to those of genes previously associated with MI. Three of these genes, namely, OVAAL, RIOK1, and TUT7, are commonly associated with malignancy, akin to NBEAL1, where we identified a known MI region comprising 254 SNPs uniquely associated with single MI. Other genes encode proteins involved in calcium handling (BMP3 and SYNDIG1) or are associated with diabetes mellitus (GLIS3 and TRIB3), suggesting a potential link to accelerated atherosclerosis development. Similarly, both ATXN2 and HECTD4 are associated with diabetes mellitus, and we identified known MI regions uniquely associated with single MI in these genes. Two regions exclusively linked to recurrent MI events were identified, both exhibiting negative effects in the HUNT and the UKBB population. The region near the MIA3 gene has been previously associated with MI, while the single SNP near the NOVA1 gene, which may also be related to malignancy, represents a novel finding. Collectively, these findings underscore the potential relevance of these genes to MI. Further investigations are warranted to ascertain if these effects are replicable in other European and non-European populations and to determine the specific links of these SNPs/genes to MI, particularly in relation to single or recurrent MI events.
The observed genetic scale heritability was found to be 0.0051 (SE 0.0011) for single MI and 0.0039 (SE 0.0011) for recurrent MI.
3.3 Identification of additional phenotypes affected by SNPs through PheWASTo delve deeper into the genetic distinctions observed between single and recurrent AF and MI, we conducted a PheWAS analysis. This enabled us to pinpoint other phenotypes associated with the same set of SNPs designated as either common or unique for single and recurrent AF and MI.
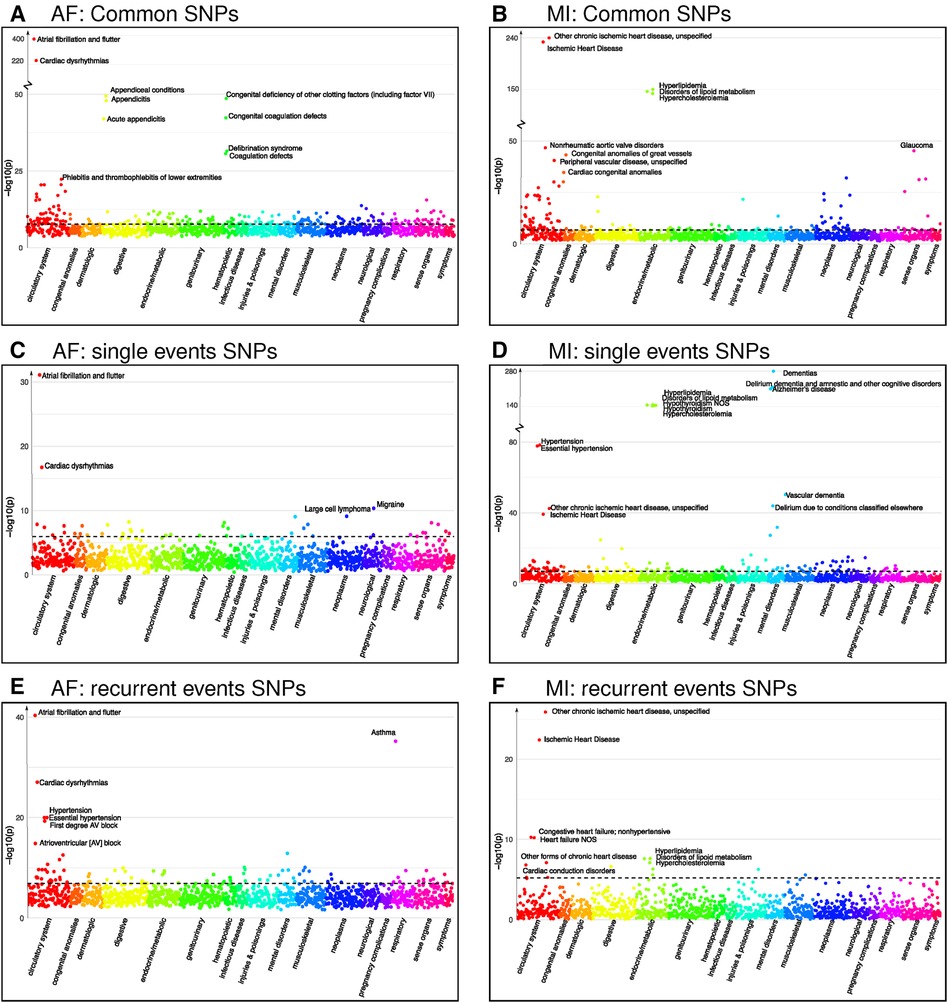
Our PheWAS investigation of the SNPs identified as common for both single and recurrent AF revealed a total of 1,903 SNPs linked with 236 phenocodes (shown in Figure 3 and Supplementary File 2). Not surprisingly, the strongest associations were found for Atrial fibrillation and flutter and Cardiac dysrhythmia (p-value 10−400 and 10−220). Furthermore, we identified robust associations with phenocodes related to Appendiceal conditions and Coagulation defects. Notably, the circulatory system category emerged as the predominant category, encompassing 54 phenocodes. This includes, but is not limited to, conditions such as Phlebitis and thrombophlebitis, Sinoatrial node dysfunction (Bradycardia), Heart failure, and Hypertension.
Figure 3. Phenocodes associated with each set of SNPs found for both single and recurrent AF/MI or uniquely for one of them. The x-axis shows each of the 1,326 phenocodes sorted by phenocode category, and the y-axis shows the lowest p-value for the association between the phenocode and the SNPs in the set. The dotted line shows the threshold for significant associates, which vary according to the number of SNPs in each set. (A) A set of 1,903 SNPs found in common for both single and recurrent AF. (B) A set of 245 SNPs found in common for both single and recurrent MI. (C) A set of 33 SNPs found uniquely for single AF events. (D) A set of 299 SNPs found uniquely for single MI events. (E) A set of 286 SNPs found uniquely for recurrent AF events. (F) A set of six SNPs found uniquely for recurrent MI events.
Intriguingly, the two identified regions specifically associated with single AF consist of 33 SNPs that exhibit significant association with 44 phenocodes (see Supplementary File 2). Not surprisingly, the strongest associations for these SNPs pertain to the phenocodes Atrial fibrillation and flutter and Cardiac dysrhythmias, the remaining 42 phenocodes span a diverse array of phenocode categories. These include not only Migraine and Large cell lymphoma but also conditions such as Arrhythmia (cardiac) NOS, Paroxysmal supraventricular tachycardia, and Cerebral atherosclerosis.
In contrast, the 18 regions specifically associated with recurrent AF events consisting of 286 SNPs show a significant association with 91 phenocodes (see Supplementary File 2), and a majority of the strong associations pertain to phenocodes of the circulatory system category. Again, the phenocode with the most potent associations are Atrial fibrillation and flutter and Cardiac dysrhythmias. In addition, these SNPs also display significant associations with Asthma and 27 phenocodes from the circulatory system, including conditions such as Hypertension, Atrioventricular block, Cardiomyopathy, Heart failure, Ischemic heart disease, Cardiac arrest, and Palpitations. Collectively, these results underscore genetic susceptibility disparities between patients experiencing single vs. recurrent AF events. In particular, SNPs specifically tied to recurrent AF are linked to a broad range of phenocodes related to the heart and circulatory system, in contrast to SNPs exclusively linked to single AF events.
Regarding MI, we identified four regions associated with both single and recurrent MI, comprising 245 SNPs that exhibit significant associations to 144 phenocodes (see Supplementary File 2). The most prominent associations are observed with Ischemic heart disease and Hyperlipidemia disorders. In addition, numerous diseases within the circulatory system category, such as Non-rheumatic aortic valve disorders, Peripheral vascular disease, Stricture of artery, Hypertension, and Heart valve disorders, are also strongly associated.
The 24 regions specifically identified for single MI events consist of 299 SNPs that are associated with 128 phenocodes (see Supplementary File 2). These include Ischemic heart disease, Hypertension, and diseases of Hyperlipidemia. In addition, there are strong associations with neurodegenerative disorders, such as Dementia, Alzheimer’s, and Delirium. These SNPs are furthermore linked with 33 phenocodes from the circulatory system category, highlighting conditions such as Cerebral ischemia, Cardiac conduction disorders, Heart failure, Aortic valve disease, and Pulmonary heart disease.
Notably, the two regions consisting of six SNPs specifically identified for recurrent MI were associated with a mere 16 phenocodes (see Supplementary File 2). While these included Ischemic heart disease, Heart failure, Cardiac conduction disorders, and diseases of Hyperlipidemia, they lacked the other 27 circulatory system disorders identified for the single MI SNPs. Once again, these findings emphasize the genetic differences between patients experiencing single and recurrent MI. SNPs specifically associated with single MI events appear to be associated with a broader and more diverse range of cardiovascular disorders compared to those solely linked to recurrent MI.
3.4 Gene sets and co-expression network neighborhoodIn our final analysis, we leverage multiple sets of gene expression data from the GTEx consortium (32) measured in tissue sub-types taken from the heart, muscle, skeletal, artery, and kidney to generate gene co-expression networks (see Methods for details). Here, our expectation is that highly correlated genes have a regulatory relationship or similar response in a condition (31). Thus, this approach should uncover genes that display an expression profile that most closely links to the set of target genes found through our GWAS analyses, and we investigate their functions.
3.4.1 AF-associated genes in co-expression networksDifferential gene expression analysis of the 18 genes identified in recurrent AF (listed as Recurrent in Table 2) reveals a significant upregulation of these genes in atrial appendage tissues from the heart. Furthermore, elevated expression levels are discerned in left ventricular heart, artery tibial, and skeletal muscle tissues (see Supplementary File 1, Figure S9). Gene ontology analysis indicates that this set of genes is significantly enriched for cell–cell signaling involved in cardiac conduction (fold enrichment (FE) >100, FDR =1.17×10⁻²), cardiac muscle cell action potential (FE =70.03, FDR =3.15×10⁻²), and regulation of heart rate (FE =43.99, FDR =1.62×10⁻²).
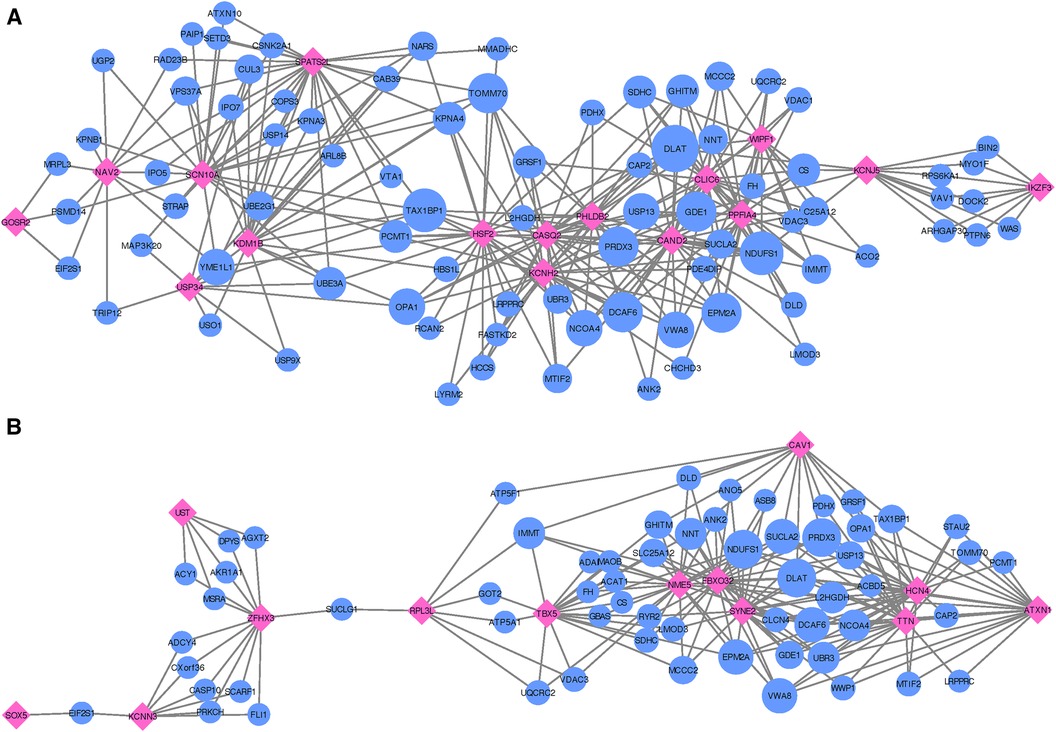
Following the co-expression analysis approach detailed in the Methods section, we find that 16 of the 18 recurrent AF genes show strong co-expression with other genes in heart, artery, kidney, and skeletal muscle tissues. Selecting the top 25 genes with the strongest connection to each of the 16 target genes, Figure 4A shows that all of the 16 target genes are connected through 82 shared neighboring genes (see Supplementary File 3), i.e., the 82 shared genes are among the top 25 strongest connections for two or more of the target genes. These 82 neighboring genes are significantly enriched for a variety of biological processes, including acetyl-CoA biosynthetic process from pyruvate (FE >100, FDR =4.41×10⁻³), tricarboxylic acid cycle (FE =54.70, FDR =1.38×10⁻⁶), NLS-bearing protein import into nucleus (FE =50.99, FDR =1.93×10⁻³), inner mitochondrial membrane organization (FE =32.73, FDR =9.49×10⁻⁴), respiratory electron transport chain (FE =10.72, FDR =4.32×10⁻²), regulation of proteasomal protein catabolic process (FE =7.49, FDR =4.94×10⁻²), proteasome-mediated ubiquitin-dependent protein catabolic process (FE =5.58, FDR =3.79×10⁻²), and regulation of cellular catabolic process (FE =4.01, FDR =9.85×10⁻³).
Figure 4. Networks showing the strongest shared neighborhood of co-expressed genes for the GWAS (target) genes associated with (A) recurrent AF uniquely and (B) both single and recurrent AF. Pink diamond nodes represent the target genes and blue circular nodes represent the neighboring genes. The sizes of the blue nodes are scaled according to their number of nearest neighbors in the network.
Focusing on the two genes specific to single AF events (listed as Single in Table 2), our analysis reveals that these genes show significant upregulation in left ventricle tissues of the heart and also high expression levels for atrial appendage tissues of the heart (see Supplementary File 1, Figure S10). Gene ontology analysis confirms that these genes are closely linked to adult heart development (FE >100, FDR =7.77×10⁻³), ventricular cardiac muscle tissue morphogenesis (FE >100, FDR =4.17×10⁻²), myofibril assembly (FE >100, FDR =2.98×10⁻²), cardiac muscle contraction (FE >100, FDR =2.47×10⁻²), and regulation of striated muscle contraction (FE >100, FDR =2.87×10⁻²). Thus, although both target genes exhibit the specified enriched functions, an egocentric network analysis reveals that they do not share mutual genes with strong co-expression across the heart, artery, kidney, and skeletal muscle tissues. Therefore, while they may have functional overlap, the co-expressing gene partners diverge for each target gene.
In our comparative analysis of gene sets uniquely associated with either single or recurrent AF, we also evaluated genes that were consistent across both AF categories. Among the 16 genes identifie
留言 (0)