
記住我


Iodinated intravenous (IV) contrast plays an important role in computed tomography (CT) body imaging (i.e., abdomen and pelvis) examinations.[1] It is essential for highlighting blood vessels and providing detailed information about organ parenchyma, both of which are vital in the diagnosis, screening, and monitoring of a variety conditions, including cancer, infection, gastrointestinal pathology, and bleeding to name a few.[2]
One such agent of IV contrast, Omnipaque™ (Iohexol, GE Healthcare; Milwaukee, WI, USA), produced by a large General Electric factory in Shanghai, China, was affected by COVID-19 shutdowns starting in May 2022. This led to an abrupt halt in production and a supply shortage experienced worldwide, with an eventual, yet gradual, return to full capacity over the ensuing months.[3]
This contrast shortage forced institutions to adopt various policies and practices regarding contrast allocation and resource stewardship.[4,5] Our institution implemented a weight-based protocol for CT abdomen and pelvis examinations, wherein patients weighing 45.4–136 kg (100–300 lbs) received a reduced dose of IV iodinated contrast of 75 mL (previously 100 mL), and patients weighing >136 kg received an unchanged dose of 100 mL of IV contrast.
Once the IV Omnipaque contrast shortage abated, the clinical question of whether to revert to our prior dosing protocol arose (GE, 2022). The primary objective of this retrospective study was to review CT examinations of the abdomen performed with 100 mL IV contrast dose versus a reduced 75 mL IV contrast dose to determine if there is a significant difference in vessel attenuation and liver enhancement. A secondary objective was to assess whether the variability in liver attenuation measurements on portal venous phase images were affected by the reduction in IV contrast dose. An additional secondary objective was to determine if the accuracy of contrast dose reported on imaging reports differed once multiple doses were introduced as part of the new protocol.
MATERIAL AND METHODSThis retrospective review of patient characteristics and imaging was reviewed by our institution’s Health Quality and Safety Institute and determined to be a quality improvement project and, therefore, exempt from the Institutional Review Board review and approval.
Adult patients who underwent a CT without and with IV contrast of the abdomen or abdomen and pelvis were included in the study. Imaging was performed at our main hospital (two CT scanners imaging emergency department and admitted patients) and an associated outpatient imaging suite (one CT scanner). Consecutive studies for 3 months before the contrast shortage from February 1, 2022, to April 30, 2022, for adults weighing between 45.4 and 136 kg (100–300 lbs) represent those with our standard fixed contrast dosing of 100 mL Omnipaque 350 IV. After the contrast shortage was announced May 9, 2022, consecutive studies for 3 months from June 1, 2022, to August 31, 2022, represent studies performed with reduced dosing of 75 mL Omnipaque 350 IV for adults weighing between 45.4 and 136 kg (100–300 lbs).
Exclusion criteria were age <18-year-old, patient weight below 45.4 kg (<100 lbs), patient weight above 136 kg (>300 lbs), and pregnant patients. Studies that deviated from our standard injection and acquisition protocol were excluded, such as CT angiography studies (faster IV contrast injection rate) and CT urography studies (which utilized split bolus technique). Patient characteristics were obtained from the electronic medical record [Table 1]. Cardiac disease history was defined as any pathologic process that decreased left ventricular ejection fraction. History of liver disease was also identified. The dose of IV contrast recorded by the CT technologist in the medical record and the dose documented in the radiology report were collected.
Table 1: Technical parameters for the 3 GE CT scanners.
Hospital CT 1 Hospital CT 2 Outpatient CT Slices 64 64 64 Detector rows 64 64 64 mAs Variable Variable Variable kVp 120 120 120 Rotation speed, s 0.8 0.8 0.5 Pitch 1.375:1 0.0984:1 0.984:1 Reconstruction interval 5 mm 5 mm 5 mm Iterative reconstruction ASIR 30% decrease ASIR 30% decrease ASIR 30% decreaseCT scanning protocols are largely similar between the three scanners [Table 1]. All scanners used tube current modulation for dose reduction. Iodinated IV contrast used was Omnipaque™ 350 (Iohexol, GE Healthcare; Milwaukee, WI, USA), injected through upper extremity IV access or an indwelling port at 2.5 mL/s. Hepatic arterial phase and portal venous phase were acquired at 45 s and 70 s post-injection, respectively.
Attenuation in Hounsfield units (HUs) was measured using 100 mm2 regions of interest (ROI) on 5 mm thick axial images for non-contrast and portal venous phases and 1.25 mm thick axial images for the arterial phase. Vessel attenuation was measured in the aorta (arterial phase, level of the main portal vein) and main portal vein (portal venous phase). At the level of the main portal vein, ROIs were placed in the right and left lobes of the liver to measure attenuation in the pre-contrast, arterial (if performed), and portal venous phases. Care was taken to avoid large vessels, lesions, or regions of artifact. The standard deviation of ROI liver measurements was also recorded as an indicator of measurement variability. Liver enhancement was calculated by subtracting the average pre-contrast liver HU from the average liver portal venous phase HU. Throughout this paper, we use the term “attenuation” to represent the average HU of an ROI placed in a vessel or the liver, the term “enhancement” indicates the difference in liver attenuation between portal venous phase and pre-contrast phase, as used by Eddy and Costa.[6]
Statistical analysisResults are summarized as mean ± standard deviation for continuous variables and proportion (95% confidence interval) for dichotomous variables. The Mann–Whitney test was used to compare the means of continuous variables between contrast dosages, such as patient age, weight, body mass index (BMI), vessel opacification, and hepatic enhancement. Fisher’s exact test was used for dichotomous variables, such as whether the contrast dose was reported correctly. All statistical analyses were performed in GraphPad Prism (v10.2.0, GraphPad Software, Inc., Boston, MA).
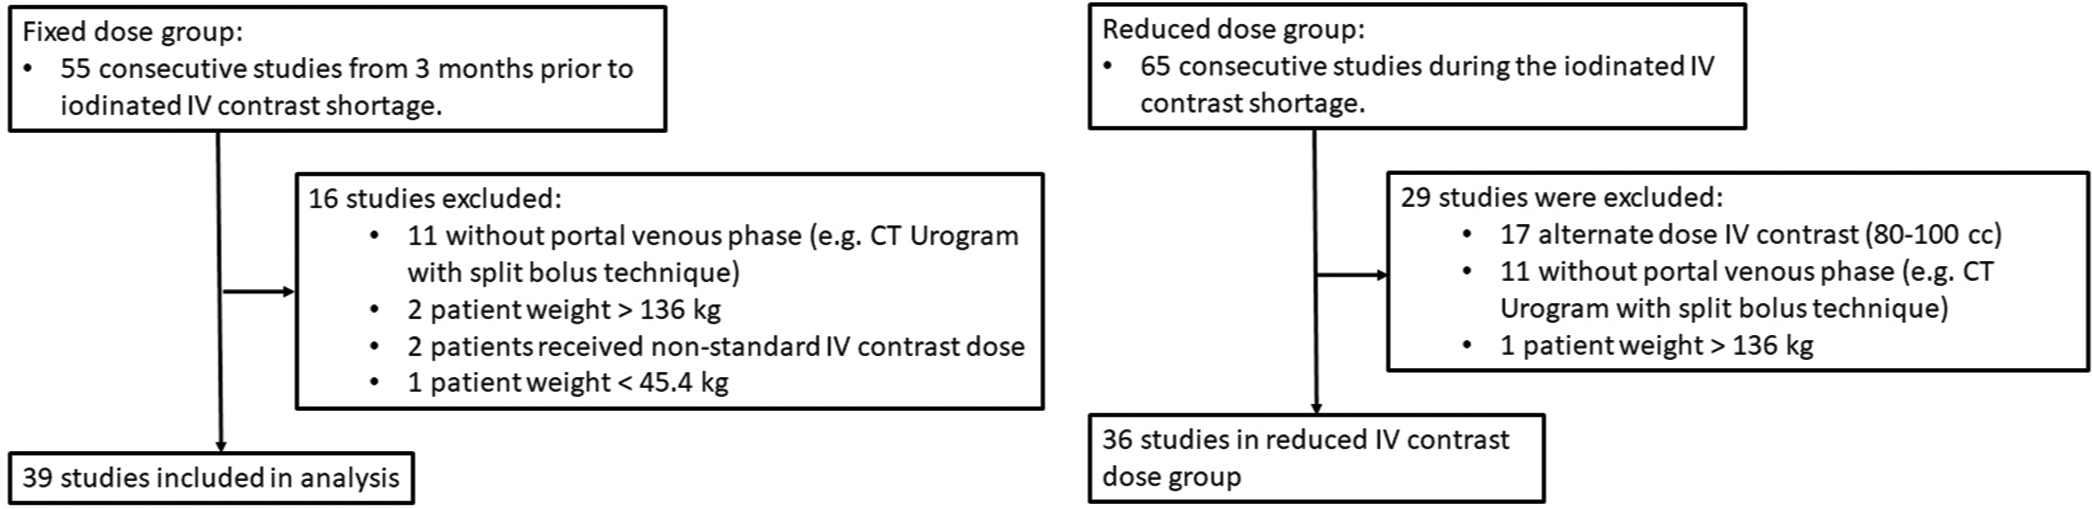
RESULTSThirty-nine fixed dose (100 mL) and 36 reduced dose (75 mL) consecutive patients were included in the study [Figure 1]. There were no significant differences between the two groups with respect to baseline characteristics such as age, weight, BMI, and gender [Table 2]. There were also no significant differences between groups for cardiac and liver disease.
Export to PPT
Table 2: Characteristics of patients included in this study with associated P-values. Ranges for dichotomous variables correspond to a 95% confidence interval.
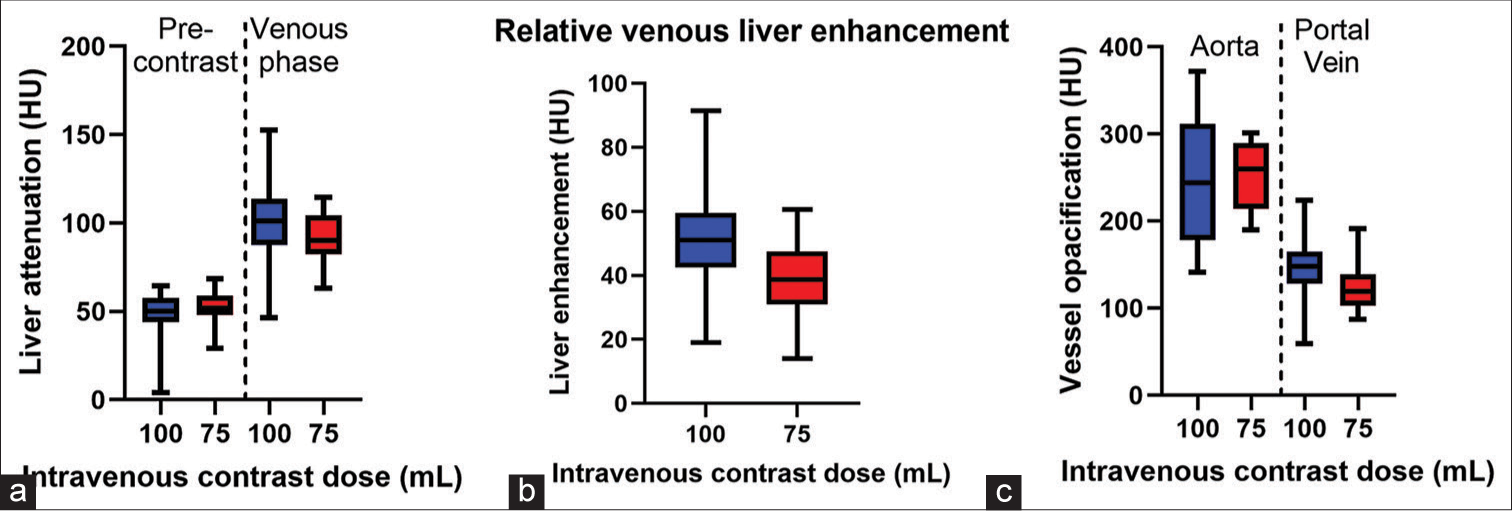
Intravenous contrast dose P-value 100 mL 75 mL Number 39 36 Age in years (range) 63.3±12.8 (33–87) 65.9±12.5 (39–86) 0.32 Gender Male 21 (54%, 37–70%) 20 (56%, 38–72%) >0.99 Female 18 (46%, 30–63%) 16 (44%, 28–62%) Weight in kg (range) 85.9±24.5 (44.1–133.8) 87.6±18.3 (50.3–117.9) 0.59 BMI in kg/m2(range) 30.4±7.7 (17.9–50.6) 30.4±5.3 (15.8–41.2) 0.94 History of cardiac disease 6 (15%, 6–31%) 3 (8%, 2–22%) 0.48 History of liver disease 6 (15%, 6–31%) 4 (11%, 3–26%) 0.74 Central line injection 2 (5%, 1–17%) 2 (6%, 1–19%) >0.99There was no significant difference in pre-contrast liver attenuation between the fixed dose and reduced dose groups (48.2 ± 12.7 HU vs. 52.1 ± 8.8 HU, P = 0.20), [Table 3]. There was a statistically significant difference in liver attenuation during portal venous phase between the fixed dose and reduced dose groups (99.6 ± 23.0 HU vs. 91.2 ± 14.6 HU, P = 0.04). There was also significantly greater liver enhancement during the portal venous phase of the fixed dose group compared to the reduced dose group (51.5 ± 14.4 HU vs. 39.1 ± 10.6 HU, P < 0.0001), [Figure 2].
Export to PPT
Table 3: Vessel opacification and liver attenuation measured in HU±SD between patients receiving 100 mL versus 75 mL of IV contrast and associated P values.
IV contrast dose P-value 100 mL 75 mL HU SD HU SD Vessel opacification Aorta (arterial phase) 245.0 78.6 254 39.1 0.52 Portal vein (venous phase) 146.7 31.6 122.2 24.0 <0.0001 Liver attenuation (average*) Pre-contrast 48.2 12.7 52.1 8.8 0.20 Venous phase 99.6 23.0 91.2 14.5 0.042 Standard deviation of measurement 11.1 2.2 10.6 1.9 0.38 Relative venous liver enhancement₸ 51.5 14.4 39.1 10.7 <0.0001There was significantly greater main portal vein opacification during the portal venous phase for the fixed dose group (146.6 ± 31.6 HU) compared to the reduced dose group (122.2 ± 24.0 HU, P < 0.0001). No significant difference was found in aortic opacification during the arterial phase (245 ± 78.6 HU vs. 254 ± 39.1 HU, P = 0.52).
There was no difference in the standard deviation of liver attenuation measurements on portal venous phase between the groups (11.1 ± 2.2 HU vs. 10.6 ± 1.9 HU, P = 0.38). The dose was reported correctly in 100% (39/39) in patients receiving the fixed dose and 92% (33/36) in patients receiving the reduced dose, which was not statistically significant (P = 0.11).
DISCUSSIONThe iodinated IV contrast shortage in the summer of 2022 provided an opportunity to assess the effect of IV contrast dosage on vessel and liver attenuation of body CT examinations. During the shortage, our institution changed from an IV contrast dose of 100 mL for all patients 45.4 kg (100 lbs) or greater to a reduced IV contrast dose of 75 mL for patients weighing 45.4–136 kg (100–300 lbs). This retrospective review found that the reduced dose group exhibited decreased portal vein opacification and decreased liver enhancement on portal venous phase images compared to the fixed dose group.
The American College of Radiology published recommendations to minimize the use of contrast and waste during the period of reduced contrast supply.[5] One of those recommendations was to utilize weight-based dosing of IV contrast for CT examinations. The rationale behind weight-based dosing is based on the kinetics of contrast after injection into the body. Contrast becomes diluted as it circulates, with the greatest dilution occurring most distal from the injection site.[1] About two-thirds of the blood supply to the liver is from the portal vein.[7] Contrast reaching the portal vein is quite distal, physiologically speaking, as it had to pass through multiple vascular beds before reaching the liver (superior vena cava, right-side of heart, pulmonary artery, pulmonary veins, left side of the heart, aorta, visceral veins, superior mesenteric vein/splenic vein, and portal vein) in that order. In other words, during the portal venous phase, the liver is quite susceptible to the effects of dilution within the circulatory system.[1]
This physiology correlates with our findings. Aortic attenuation during the arterial phase did not significantly differ between the high- and low-dose groups. This is thought to be primarily influenced by the injection rate rather than injection volume.[1,8] The more rapid the delivery of a fixed contrast dose, the faster contrast accumulates in the aorta leading to greater aortic opacification. Prior studies have also reported no significant difference in arterial phase liver enhancement with varying IV contrast doses.[9]
There was a significant difference between groups in portal vein attenuation, liver attenuation on portal venous phase, and liver enhancement. This is secondary to the reduced dose of contrast being more susceptible to hemodilution distal to the injection site. This has also been reported by multiple previous studies,[6,9] although the majority of prior studies were not conducted during a contrast shortage and evaluated IV contrast doses >100 mL. For example, weight-based IV contrast doses evaluated by Yamashita et al. varying from 1.5 mL/kg to 2.5 mL/kg resulted in average doses between 92 and 148 mL of iopamidol 300.[9] Within this IV contrast dose range, they reported peak hepatic contrast enhancement increasing linearly with dose of iodine administered. Two patients in each group received central venous injection rather than peripheral IV injection; excluding these four patients from the analysis did not change results, reinforcing the importance of IV contrast volume for liver enhancement and portal vein opacification.
We did not directly assess how differences in liver enhancement affected the conspicuity of liver lesions. Prior research has suggested that a minimum hepatic enhancement of 50 HU is required for adequate evaluation for hypoattenuating lesions.[10,11] During the contrast shortage, the reduced fixed dose of 75 mL resulted in an average hepatic enhancement of only 39.1 HU, potentially decreasing the sensitivity of contrast-enhanced CT for detecting hepatic lesions. LIRADS CT imaging technique recommends an optimal dose for liver imaging of 1.5–2 mL/kg body weight, equivalent to about 525–600 mg Iodine per kg body weight (mgI/kg).[12] Using a fixed dose of Omnipaque 350, iodine concentration for our patients ranged from 578 mgI/kg in patients weighing 45.4 kg (100 lbs) down to 193 mgI/kg for patients weighing 136 kg (300 lbs). Therefore, during the contrast shortage, the low fixed dose in patients weighing more than 50 kg resulted in an iodine concentration below that suggested for optimal lesion detection. If future IV contrast shortages occur, a more effective approach may be to perform unenhanced CT abdomen examinations with repeat contrast-enhanced studies with a normal IV contrast dose if needed. This was the approach of at least one emergency department during the contrast shortage.[13] Further, research is needed, as well as how to incorporate alternative imaging modalities such as ultrasound and magnetic resonance imaging (MRI) in a time-efficient and resource-efficient way.
There was no significant difference between groups in the standard deviation of liver attenuation measurements during portal venous phase, which was utilized as an indicator for contrast-to-noise ratio. A prior study of cirrhotic livers also reported significantly greater hepatic enhancement with increased contrast doses, but no significant change in contrast-to-noise ratio.[6]
Finally, changing from a fixed IV contrast dose to variable IV dosing based on weight introduces a potential source of error in radiology reports. When a standard IV contrast dose was used for all patient weights >45.4 kg (100 lbs), all radiology reports included the correct IV contrast dose administered. Changing to variable contrast dosing led to 8% of radiology reports recording an incorrect IV contrast dose, with all errors reporting the higher dose of contrast used before the contrast shortage. While this finding did not reach statistical significance, it highlights the importance of ensuring that standardized report templates are edited when protocol changes are introduced into the workflow.
A strength of this study is its broad applicability to non-academic radiology practices. The utilization of 64-slice CT scanners and fixed IV contrast dosing for CT abdomen and pelvis examinations reflects the cost-containment and efficiency measures of many private practices and imaging centers. The iodinated contrast shortage was indiscriminate in its effect on all practice types, and our findings and experience may be of particular benefit to non-university practices in the event of future iodinated contrast shortages.
There are several limitations of this study. The first is that it is retrospective in nature and is thus more difficult to control confounding variables. While the patient variables we accounted for in Table 2 had no significant difference between the groups, it is possible that only higher acuity patients received IV contrast during the IV contrast shortage. However, there were no significant differences between groups for low cardiac output states or liver disease, both of which could affect the delivery of contrast and attenuation of the liver (i.e., through passive congestion, portal hypertension, fibrosis, or replacement by fat).[9] Multiple studies have reported that the most important variable affecting liver enhancement is patient weight and size, with greater patient weight associated with decreased peak attenuation of vessels and org ans for a fixed IV contrast dose.[1,9,14,15] We also did not evaluate the effect the lower contrast dose had on identifying non-hepatic pathology. Since the liver is most susceptible to venous hemodilation of contrast, pathology in other abdominopelvic organs may have been less affected by the lower contrast dose.
CONCLUSIONFor patients, weighing 45.4–136 kg (100–300 lbs) undergoing an abdominal CT examination, reducing the IV contrast dose from 100 mL to 75 mL Omnipaque 350 resulted in significantly decreased portal vein opacification and liver enhancement. In particular, relative liver enhancement fell below the suggested 50 HU threshold for adequate conspicuity of hypoattenuating liver lesions. If future IV contrast shortages occur, a more effective approach may be to perform unenhanced CT abdomen examinations with repeat contrast-enhanced studies with a normal IV contrast dose if needed, or rely more heavily on alternate imaging modalities such as ultrasound and MRI. Continued research is needed. The change in contrast, administration protocol also led to more errors in contrast dose reporting in the radiologist’s report. These findings are broadly applicable to many practice settings and can help inform strategies in response to any potential future iodinated contrast shortage.
留言 (0)