
記住我


Regarding the original paper we provide our best attempt to highlight each concern raised by Xu et al., point by point.
1.Two effect sizes from Rodriguez-Rosell et al. [5] (i.e., − 0.35 and − 0.10 for 10 m and 20 m, respectively) were incorrectly added into the “low” group instead of the “moderate” group (Fig. 4 in the original paper). This resulted in the low group having two extra data points (comment #1 in Xu et al.) and the moderate group having two less (comment #5). We therefore thank the authors for identifying this inconsistency, thus giving us the opportunity to improve the quality of our paper.
2.Similarly, the 0–50 m distance from the Alcaraz et al. [6] study did not appear and should have been present in our original analysis. We again thank the authors for spotting this. The new figure is presented below (Fig. 1).
3.Xu et al. are correct. The “red point” was incorrectly transcribed in the meta-regression. The respective data point for the 30 m group from the Luteberget [7] study should have been a standardized mean difference (SMD) of 0.60. The figure below is updated (Fig. 1).
4.Xu et al. explain how in the McMorrow et al. [8] study, for differences between RS and traditional sprinting, the within-group effect sizes are 0.91 and 0.92, respectively, and the between-group SMD for 0–5 m should be 0. They further claim that the point in our meta-regression is − 0.15, when it is in fact − 0.16 as presented in Table 3 from the original paper [2]. Owing to the lack of disclosure in how Xu et al. calculated a SMD of 0, we went back to the McMorrow et al. paper [8] and calculated the effect size again.
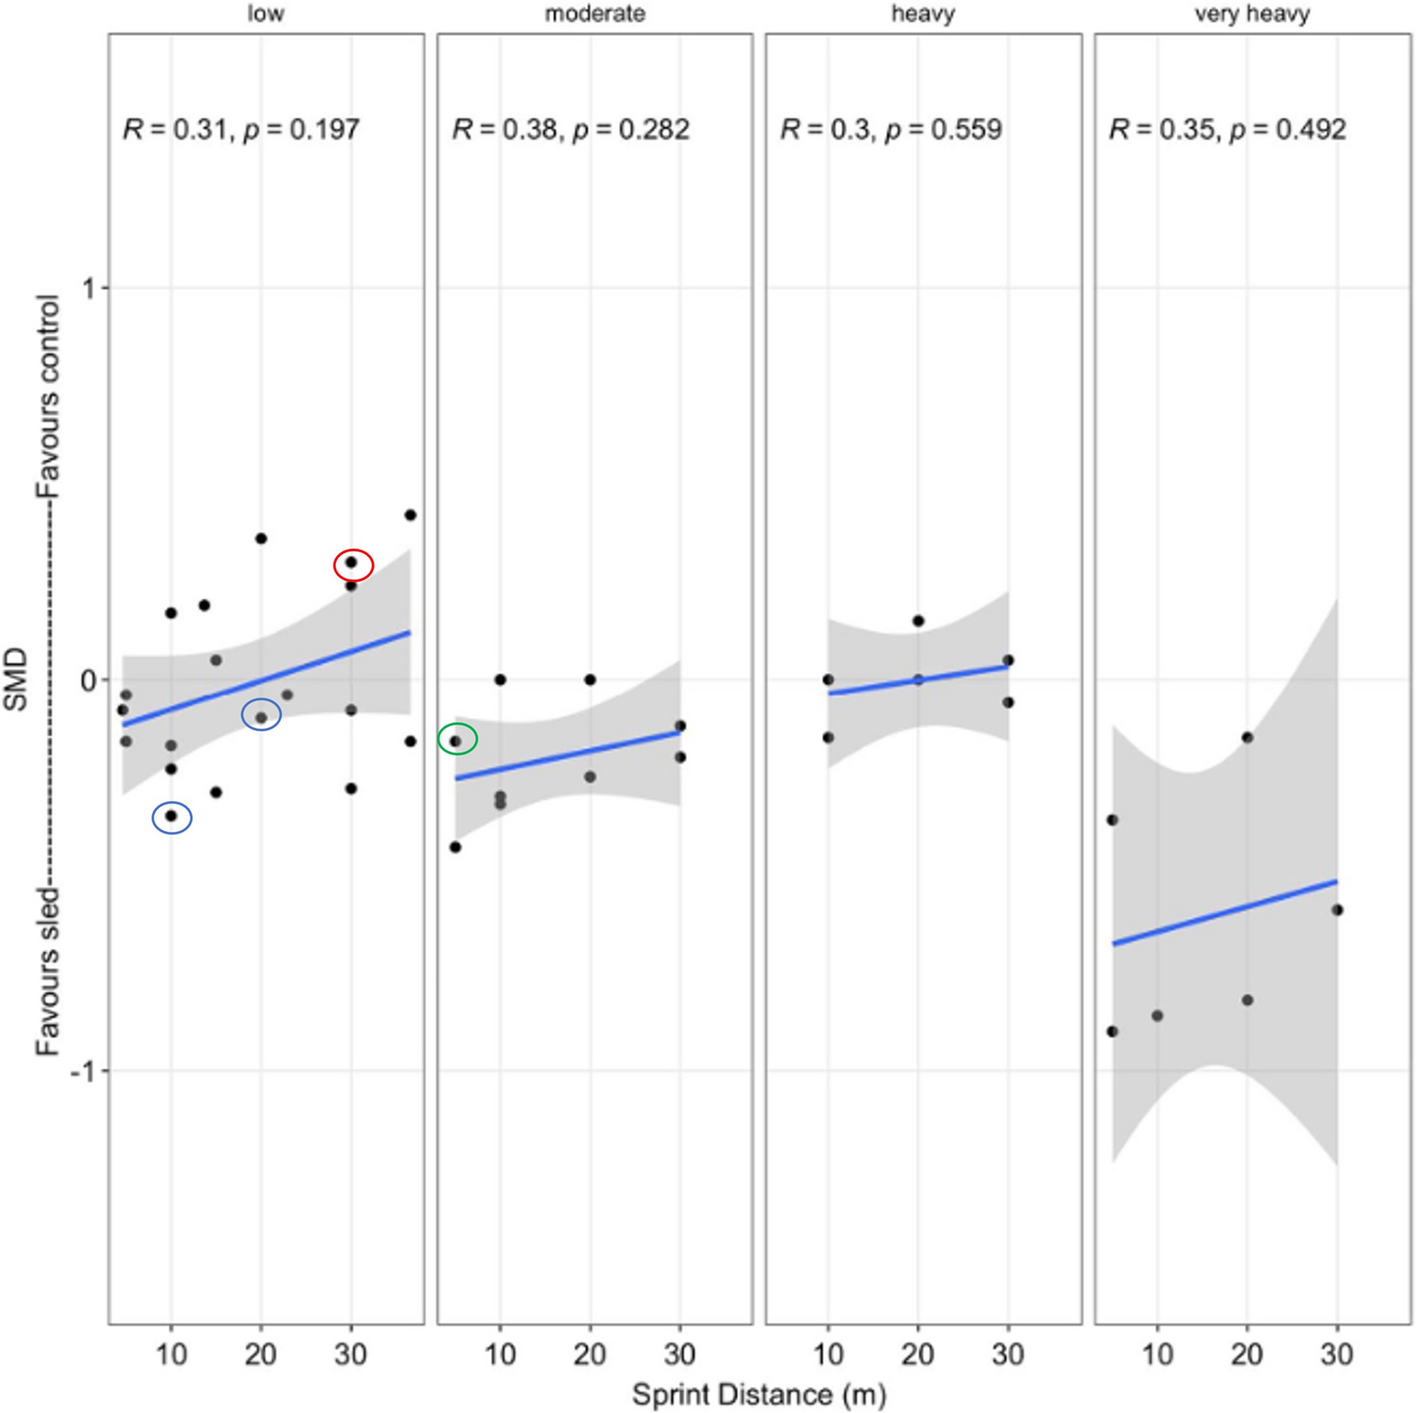
Fig. 1
Corrected comparison of the SMD (negative in favor of the RS group, positive in favor of control group) and the sprint distances tested across each loading prescription, without the removal of outliers
Since the effect size calculation represents a standardized difference, the value of the numerator (i.e., between-group difference) can have an impact on the effect size. That is to say, depending on when raw means are rounded (either before or after effect size calculation), the final effect size may present inconsistencies. Since we used the raw data from sprint studies (many of which present sprint times to two decimal places) we decided to keep mean data to two decimal places. Of note, McMorrow et al. [8] reported differences to three decimal places, namely a 0.001 s difference between groups in favor of the unresisted sprint group. However, considering the procedures employed in our study, when digitizing the pre- and post-data for each group (WebPlotDigitizer, version 4.5; https://apps.automeris.io/wpd/), we found at a group level, a 0.07 s reduction in the RS [i.e., pre: 1.18 s, post: 1.11 s, (SD, 0.05 s)] and a 0.06 s reduction in the unresisted-group [pre: 1.18, post: 1.12 s (SD, 0.04 s)]. The main issue here is that when data is recorded to more decimal places, the difference between 0.066 and 0.065 s is 0.001 s, whereas the difference between 0.07 and 0.06 s is 0.01 s. Thus, depending on when data is rounded, a between-group difference in sprint improvements of 0.01 s versus 0.001 s can result in a SMD of 0.16 or 0.016, respectively. To address this inconsistency, we used the mean differences, standard deviations, and sample sizes provided by the original McMorrow paper [8], along with an effect size calculating spreadsheet by Lakens [9], and re-calculated the Hedges’ g between-groups to three decimal places and obtained a SMD of 0.012 in favor of the unresisted group. In this regard, it is important to state our reluctancy to present this difference as a SMD of 0, as stated by Xu et al. Moreover, since, traditionally, values below 0.2 have been interpreted as “trivial” [10] we advocate for not losing sight of the overall perspective and refer to the original McMorrow paper [8], which stated in their results that improvements for the unresisted and RS were 5.1% (− 2.4 to 12.7) and 5.4% (0.5–10.4), respectively, and that these between-group differences were interpreted as “trivial and unclear for unresisted sprint (URS).”
5.This is addressed in point one of the present manuscript. Additionally, it is important to clarify here that in Fig. 4 of the original paper by Hamad et al. [2], two data points in the moderate group had the exact same effect size for 20 m (i.e., − 0.250). Owing to these two points being stacked on top of each other, they were only visible as one datapoint in the figure. To address this, datapoint transparency has been increased and jitter has been added to the datapoints for better clarity (Fig. 1). We acknowledge that this could have been made clearer in the original publication [2]. Still, we would also like to note that we could have explained this to Xu et al. if we had been contacted prior.
6.Xu et al. claimed that their outlier analyses did not correspond to ours. The authors then state that they used the box plot and z-score approach to identify outliers within the meta-regression data. They also indicate that their outlier analyses results include both the Luteberget et al. 10 m (SMD = 0.58) and 30 m groups (SMD = 0.60) as outliers, while our outlier analysis included only the 10 m datapoint. As has been stated in point#1, the Luteberget 30 m was mistakenly transcribed in the meta-regression. Thus, when this error occurred, it was naturally not identified as an outlier through detection as it was not outside the limits of variance that the box plot and z-score use.
Despite Xu et al. knowing this point was erroneous as they stated in point#1 of their paper, they claimed, at the end of point#6, that we “chose” to only remove this point, hinting that, what was an honest and unfortunate mistake was in fact, deliberate. Again, had we been addressed through our correspondence email, these assumptions would have been prevented.
Another point worth noting is that, in their comments, Xu et al. highlighted that they utilized the commonly used box plot and z-score values to identify seven and five outliers, respectively. They stated they used 2-standard deviations as the cut-off for identifying outliers. In spite of this, we acknowledge that while box plots and z-scores are methods that identify outliers, identification of outliers on its own does not give permission to remove those data points [11]. While error outliers, [12] such as a 14-standard deviation increase in squat performance, may represent errors in measurement or calculation of effect sizes [13], some outliers (single construct outliers) [12] may represent natural variability of the population or test statistic. Indeed, 2-standard deviations cover roughly 95% of a normal distribution, therefore it is completely possible and expected for some data points (nearly 5%) to fall outside these set limits at times. Notably, setting 2-standard deviations as the cut-off is not that common, and literature does provide some heuristics and prior methods that have been used for identifying outliers using z-scores. These include using 3- [13, 14] or 3.29-standard deviation cut-offs [14] as 99.7% and 99.9% of the data in a normal distribution fall within these limits, respectively. Referring back to the study by Hamad et al. [2], the data from the 43 groups included in the meta-regression all fell within 2.5-standard deviations, which means that using standard deviations of 3 or 3.29 would not have allowed for the identification of any outliers. Still, the 2-standard deviation assessment used by Xu et al. found five outliers. While it is argued that using the median may be more suitable as outliers can pull the mean and thus modify the measure of variance [15], it is again important to state that clear reasons should be defined for removing outlier data. The 10 m effect size from the Luteberget study [7] was originally identified and removed as an outlier in our original paper by using the box-plot method using the “identify_outliers()” function from the “rstatix” package, but a more thorough consideration was needed.
Considering these perspectives, it seems to be clear that context must be considered before removing outliers from an analysis. In fact, the outliers mentioned by Xu et al. were to be removed solely because they did not fall within the centrality of the data. To be clear here, the removal of these data points would mean removing study groups that had effect sizes of 0.42, 0.58, 0.60, − 0.68, − 0.82, − 0.86, − 0.90. These effect sizes correspond to study groups that showed “small” to “moderate” differences in sprint improvements between the intervention or control group. When diving into these data even deeper, the changes in sprint times ranged from + 0.06 s (5 m) to − 0.31 s (30 m) (median = − 0.06 s) within studies with professional or amateur subjects, aged 15–23 years old over intervention periods between 4 and 10 weeks. We believe these results are plausible when taken in the context of a meta-analysis which contained clinical variability (differing participant sex, level). Indeed, without any justification, blindly removing these studies from the analysis would not be justifiable. This point can be further emphasized by directly citing Viechtbauer and Cheung [11]: “While most researchers agree that it is necessary to examine the data for potential outliers and influential studies in a meta- analysis (e.g., [2–5]), Hunter and Schmidt [32] recommended against the use of outlier analyses in meta-analysis. The primary reason behind their position on outlier diagnostics is that ‘it is almost impossible to distinguish between large sampling errors and true outliers (i.e., actual erroneous data)’ (see [33], p. 110). It is indeed true that unusually large or small effects could just be a result of chance alone. Therefore, the fact that an effect is particularly large or small should not by itself be taken as grounds for the routine deletion of the study reporting such an effect.” Based on the above explanation, we are unable to provide a reason for removing these studies from the analysis. Therefore, we then reran the analysis on the original dataset without removing any outliers (Fig. 2). The original analysis (unadjusted for load) without removing outliers included 43 groups and did not show a significant effect for distance (r = 0.23, p = 0.137, Fig. 2). Xu et al. state that the effect “approached significance” after the Luteberget outlier was removed, with p = 0.072. In all honesty, it is not clear for us what the authors mean by this since, as can be seen in a separate section of our results, we considered a p value of 0.064 as “not statistically significant”. So, for the authors to assert that a p value = 0.072 “approached significance” is beyond our understanding in the context of our original study [2]. Claiming that “non-significance” can possess a trend towards “significance” is troubling and caution should be taken when stating that a p = 0.072 is “approaching significance,” as this not only implies a nonexistent motion toward a statistically significant value [16], but it may also lead to language that may mislead a reader [17]. Considering the previous line, while Xu et al. claimed that “clear differences” existed between the model in the original paper and the updated results, the truth of the matter is that no statistical significance was reached in either of the models presented. Therefore, we restate our caution from our original paper [2]: “yet considering the variability and weak relationship, it seems that the effects cannot be explained by distance alone. This is indeed further clarified when the model was adjusted for load (ESM S11), showing that the differences between distances were indeed not significant.”
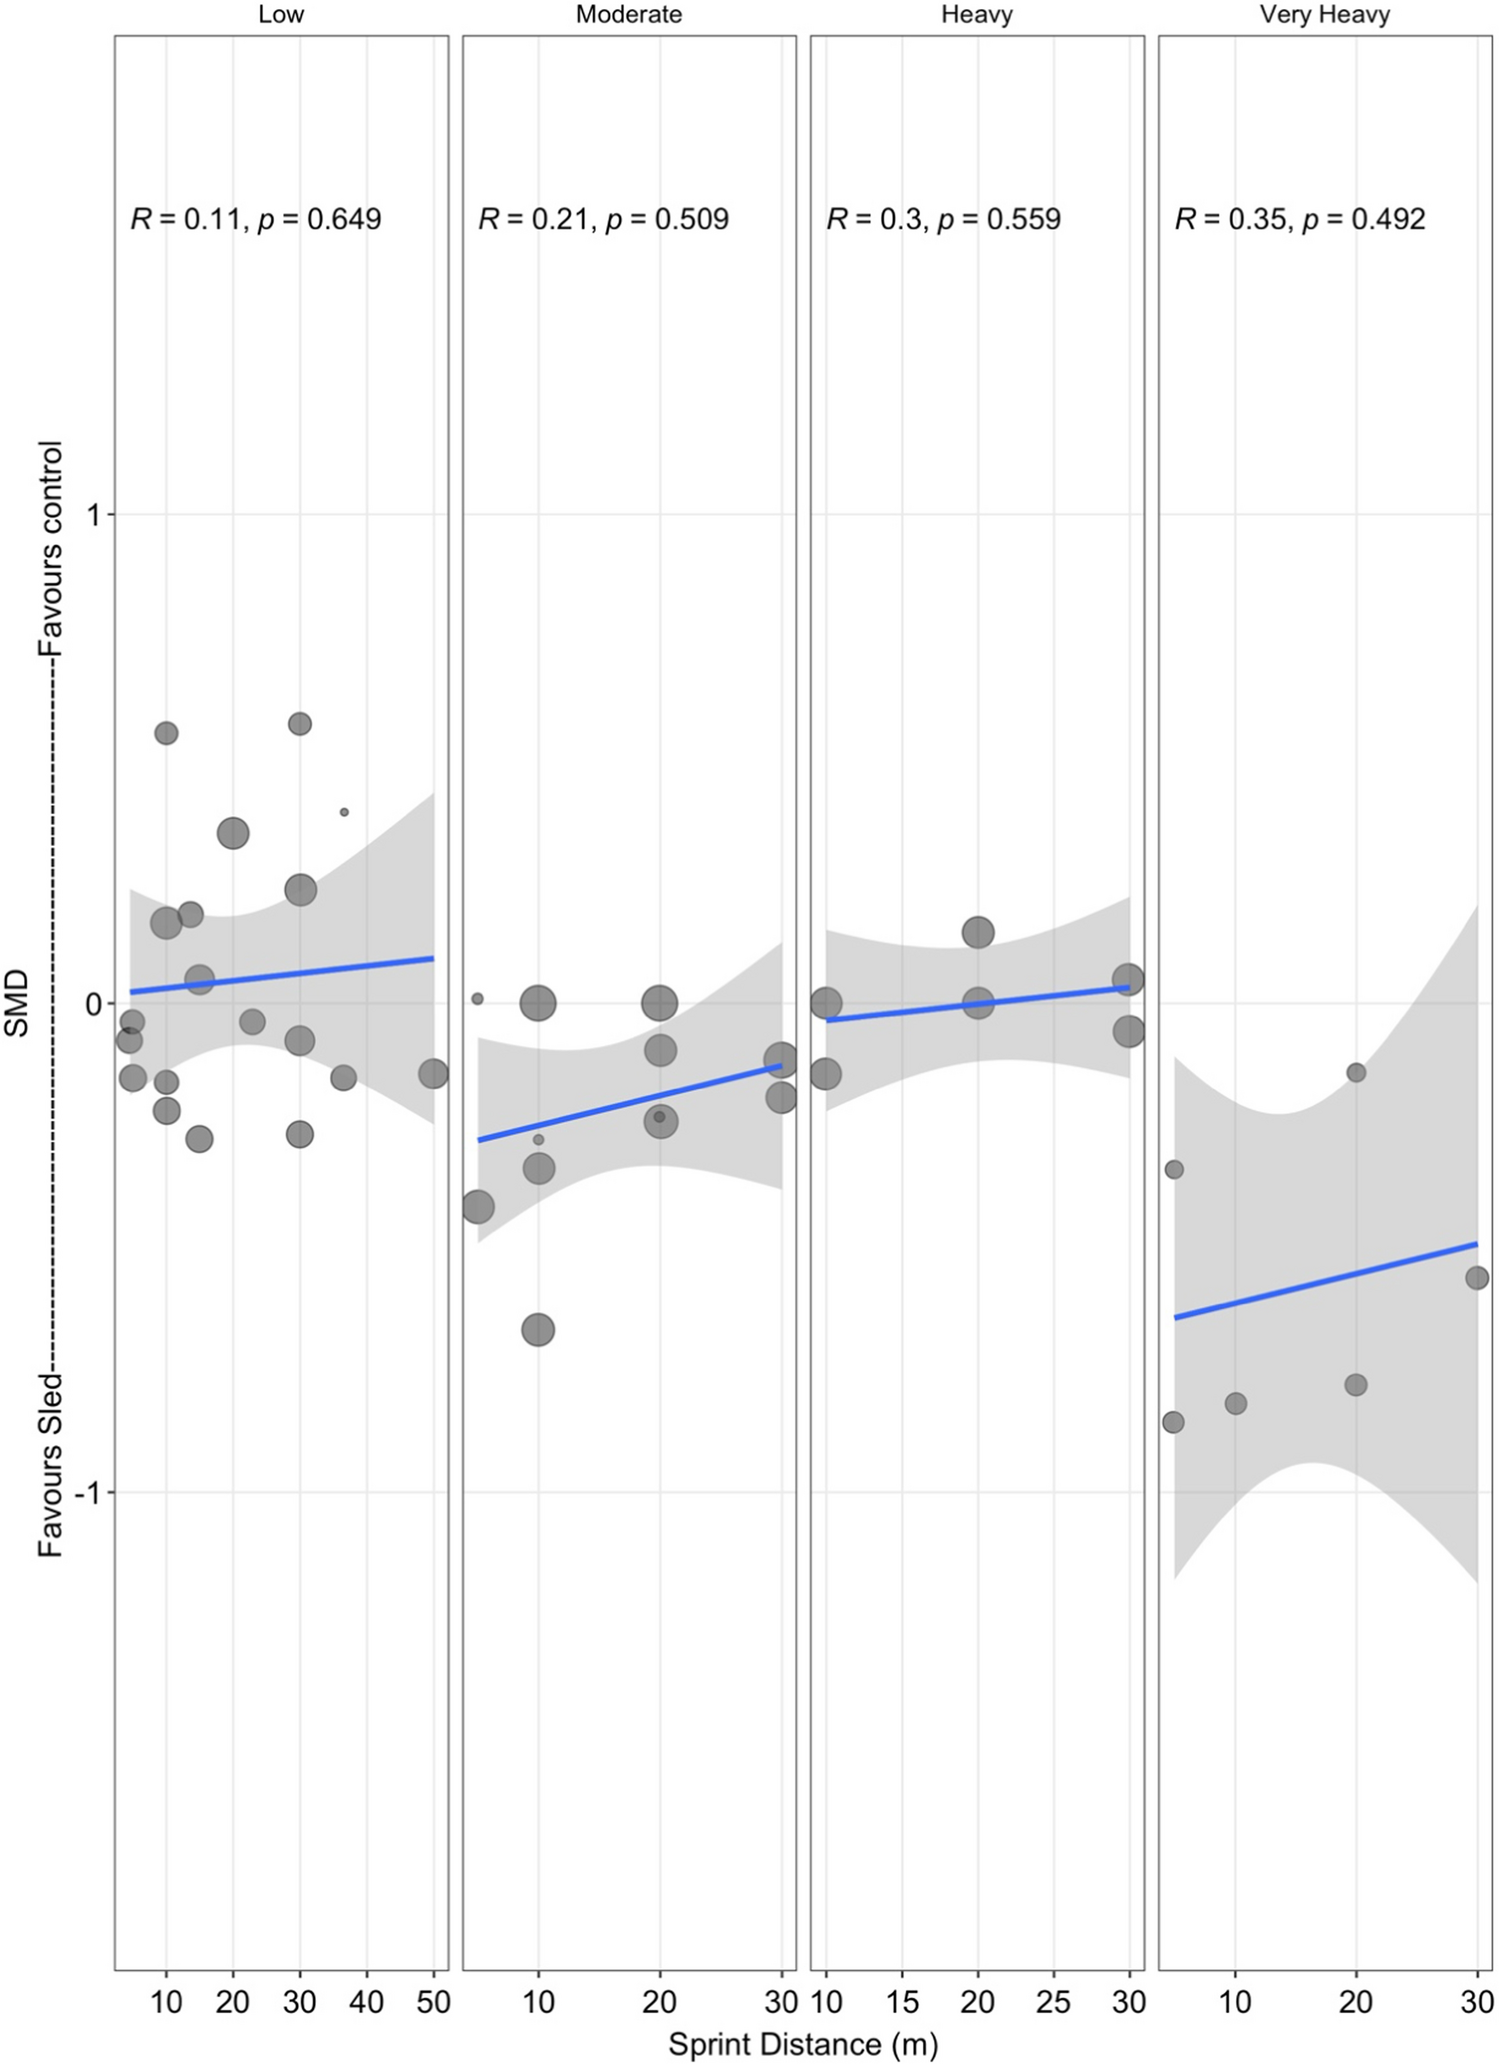
Fig. 2
Corrected relationship between sprint distances tested and SMD (negative in favor of sled, positive in favor of control) without the removal of outliers
8.The “metafor” package was deployed to perform the meta-regression. The multilevel, random-effects model results now account for within-study variance. The sizes of the datapoints reflect the weighting of the studies through the inverse of their within-study variance.
9.The authors claim that we “curiously” included assisted sprint training (AST) in our proposed theoretical modeling despite investigating the effects of combined uphill–downhill sprinting and resisted sprinting compared with traditional sprinting. Firstly, combined uphill–downhill sprinting contains an assistive/overspeed component. It was also not claimed that “AST would be more effective than traditional sprinting only during the maximum velocity phase.” The purpose of our paper was to compare these methods against traditional sprinting controls. Data on assisted and overspeed sprinting interventions are limited. This is why this wasn’t investigated and instead, UDS and RS were compared with traditional sprinting. We then attempted to provide an explanation for the results that we observed considering potential differences between these methods and why “perhaps” UDS appeared more effective than traditional sprinting when RS did not appear to be. We hypothesized that the fact that UDS contained both a resistive and assistive component could explain, at least in part, the results observed. In our conceptualized model, we proposed that assisted and overspeed methods serve as velocity stimuli and perhaps improve mean velocity.
Also worth noting, to support their claims, Xu et al. referred to a single study [18] that involved a group performing 18.3 m assisted accelerations for 4 weeks (“curiously” neglecting other studies that did not fit the narrative, such as the ones by Hicks et al.[19] or Murray et al. [20]). According to the original source [18], the setup of the AST training intervention resulted in players having roughly double the assistive force at the start of the sprint (equivalent to ~14% of body mass) when compared with the distance of 18.3 m (i.e., assistive force of ~ 7.5% of body mass), which could eventually explain why the AST group displayed the greatest increase in velocity in the initial meters (where assistance was much greater). Despite this, performance actually increased across all sprint distances (0–4.6 m, 0–13.7 m, 0–22.9 m, and 0–36.6 m) [18]. It appears, therefore, that Xu et al. made claims that may not reflect the current state of literature as it pertains to AST sprinting. Beyond that, the claim that assistive or overspeed methods are more superior to traditional sprinting only during the maximum velocity phase is a stance that is not drawn by our paper. Finally, Xu et al. also stated their concern with using assisted and overspeed methods in our theoretical explanation because a meta-analysis and regression analysis wasn’t done for the assisted groups. The reason for not performing such an analysis is because we are unsure how a robust meta-analysis and meta-regression can be done with just two study groups.
10.Another issue the authors had with our paper was related to the systematic search process as they listed several studies that should have been included. Important considerations are required to address these concerns. Firstly, Xu et al. claim that Cetin et al.’s [21] study violates our exclusion criteria regarding other exercises performed since we mentioned excluding studies in which the “Sprint intervention group performed other exercises (plyometrics, change of direction, and strength training).” This was a criterion for exclusion so that any effects could be attributed to the respective training modality. If an intervention period contained additional training modalities, there was a chance that any conclusions about the effect of sprint training could potentially become confounded. The study by Cetin et al. [21] had both groups perform general strength training and technique drills 2 weeks before the start of the interventions. They chose to do this to “protect volunteers from injuries before the sprint training”[21]. Once the intervention period began, both groups exclusively performed their respective sprint training programs. Hence, since during the intervention period the subjects did not participate in any other training modalities apart from sprint training, the study by Cetin et al. [21] was included into our meta-analysis.
Xu et al. continued, “We suspect that the authors might have thought that identical training for all did not affect the comparison between the sprint intervention group and traditional sprinting. Athletes certainly engage in other forms of exercise during the process of periodized training. Thus, this logical extension by the authors appears to omit the studies of…” Several studies are then listed. First and foremost, we consider that Xu et al.’s unfounded “suspicions” about our “thought process” should have no place in a scientific discussion and are borderline disrespectful. If the authors had any inquiry about our thoughts, they should have contacted us directly through the correspondence email for clarification. This being said, as explained above, we stand that the study [21] did not violate our exclusion criteria. Regarding the other studies listed by Xu et al., we will attempt to explain why they were not included. In Cahill et al. [22], the study groups performed other training modalities (i.e., strength training) within the 8-week intervention period alongside the sprint training modality. In Gil et al. [23], the study groups performed change of direction and 60% body mass loaded squat jumps alongside their sprint modalities. With regards to the study by Martinopoulou et al. [24], we are unable to find the full-text of the manuscript in the journal it was published (https://www.biologyofexercise.com/). Sekine and Okoda’s [25] study was not indexed in any of the databases that were used for the systematic search. Xu et al. are correct about the study by Escobar Alvarez et al. [26], unfortunately, this study appears to have been missed in the original search. Concerning Makaruk et al. [27], the study was neither indexed in the databases used nor did it qualify as part of our inclusion criteria since it investigated the effects of assisted sprint training (and not combined uphill–downhill sprinting or resisted sprinting). In Toyomura et al. [28], participants performed downhill running on a decline treadmill continuously at lactate-threshold intensity for 20 min per session, which is, by no means related to the topic of our systematic review (i.e., sprint). While this study used a “downhill” aspect, this did not fall within the definition of a “maximum single-effort sprint” with “adequate rest between repetitions” as was written in our inclusion criteria. Despite the misinterpretation of cited articles being a possibility [29], it should be clarified that running for 20 min at lactate threshold and maximal-sprinting are two completely separate activities. Finally, sled-pushing was not included in our meta-analysis as the arms are not allowed to freely swing as in a sprinting action. While a case can be made for including this training method since it consists of a resisted high-intensity running action, a case can also be made for its classification as a separate training stimuli [30]. It is also possible that the inclusion of different training stimuli could have led to unnecessary methodological heterogeneity in the results. Still, we invite future research to include all these different methods and investigate this question further.
11.Xu et al. expressed concerns with the following statement from our original paper, “Of note, the very heavy group also contained some reasonable variability due to the study by Derakhti et al. [52], which may have seen strong effects due to their sample being professional adolescent athletes.” The authors then presented experimental studies showing similar or better effects between very heavy loaded sleds and traditional sprinting controls over “5–30 m” distances and stated that this was evidence that very heavy loads “might be a more effective means of enhancing the acceleration phase.” Our attempt with our previous statement was to provide a possible explanation for the large spread within the very heavy load group since one study contained male amateur soccer players (26.3 ± 4.0 years) while the referenced Derakhti et al. [31] study contained professional adolescent athletes (15.7 ± 0.5 years). We thank the authors for expressing their concerns; however, nowhere in our study did we attempt to undermine the effectiveness of very heavy sled sprinting in general.
In conclusion, we state that the claims made by Xu et al. [1] do not correspond with the conclusions made from our study [2]. While we believe that exchanging arguments and points of view are crucial parts of collaborative and open science, we also acknowledge that unfortunate mistakes may happen (as we point out in the current response to the letter by Xu et al.) and we thank them for the opportunity to stand corrected when that is the case. Nevertheless, caution must be taken when interpreting the comments made by Xu et al. on the basis of some of the apparent methodological and logical misinterpretations (e.g., suggesting we should have included a lactate-threshold running study [28] within a sprint training meta-analysis). Finally, it is important to view all results, including our own, through a lens of caution and nuance and we thank the authors for their thoughts. We also stress the importance of not viewing data through a vacuum so as to not lose sight of the forest for the trees.
留言 (0)