
記住我


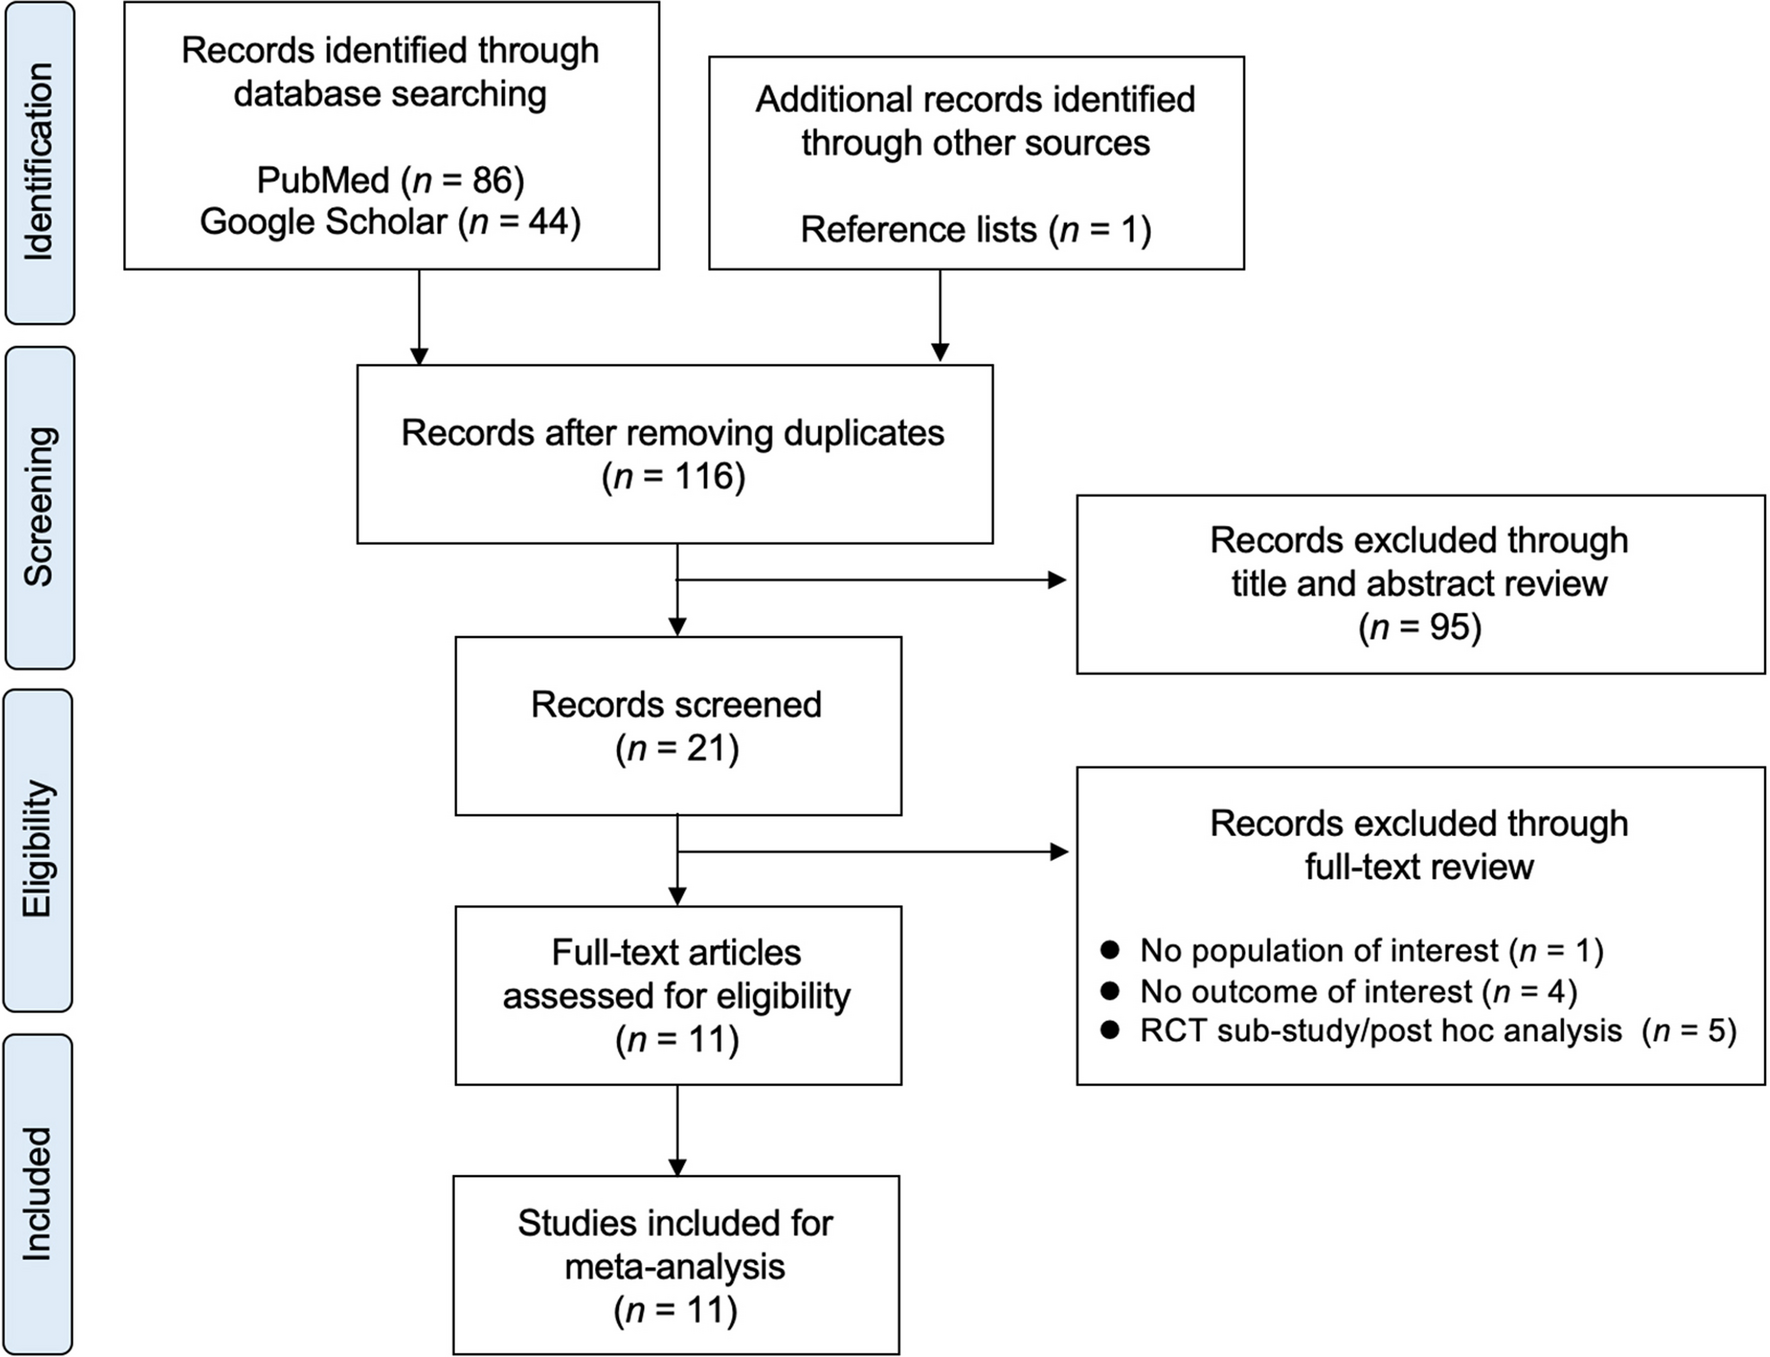


A Markov microsimulation model was employed to estimate the cost-effectiveness of romosozumab-to-alendronate in comparison to alendronate monotherapy and teriparatide-to-alendronate. In a microsimulation model, each patient was evaluated individually, and a record of their previous health states was created within the model. The patients were tracked through health states, for which costs and benefits accumulated over time. These models are appropriate when many health states are relevant, and patients are assumed to be at a changing risk of incurring multiple events with long-term consequences, such as osteoporosis. The model has been previously described in detail by Söreskog et al. [9].
The model comprised five health states: “At risk of fracture,” “Hip fracture,” “Vertebral fracture,” “Non-hip, non-vertebral fracture (NHNV),” and “Death.” The model cycle length was 6 months, which is commonly used in cost-effectiveness models for osteoporosis treatments [10]. In the model, all patients began in the “At risk of fracture” health state, and at the end of each 6-month cycle, they had a probability of incurring new hip, vertebral, or NHNV fractures, remaining in a health state without a new fracture, or dying. In the case of death, the patient transitioned to the “Death” state and remained there for the remainder of the simulated time horizon, incurring no further events or costs (absorbing health state). Figure 4 in supplementary materials summarizes the health states and possible transitions.
Due to the chronic nature of osteoporosis, a lifetime horizon was chosen in the base-case analysis. All patients were followed on an individual basis from their age at start of treatment until the age of 100 years or death, whichever came first.
Target patient populationThe target population for romosozumab was postmenopausal women with osteoporosis, who were at high risk of fracture. The inclusion criteria for this population were women aged 50 years and above, with a T-score of ≤ − 2.5 and a recent MOF, within the last 24 months. These population criteria are broadly aligned with the reimbursement criteria for romosozumab in Belgium which allow specialists in rheumatology, physiotherapy, and internal medicine including geriatricians to request reimbursement for romosozumab [11]. Age at treatment start for the base case was set at 74 years which was the mean age in the phase III clinical trial ARCH [7].
Treatment comparatorsThe model simultaneously compared sequential treatment of romosozumab (i.e., romosozumab treatment followed by antiresorptive treatment) with another active comparator arm. Romosozumab-to-alendronate was compared with alendronate monotherapy and with teriparatide followed by alendronate.
The antiresorptive treatment chosen to follow romosozumab is alendronate, as clinical evidence of alendronate following romosozumab is available from the ARCH trial [7]. Alendronate is also one of the cheapest osteoporosis treatments in Belgium without restrictive reimbursement criteria [11]. Alendronate was also the active comparator arm in the pivotal phase III study ARCH [7] and is recommended as treatment by the BBC treatment guideline for patients at high fracture risk [5]. Alendronate was therefore considered the most appropriate comparator.
Teriparatide was the first bone-building therapy approved for the treatment of severe osteoporosis and is recommended as second-line treatment for patients at very high fracture risk in Belgium [5]. The reimbursement criteria for teriparatide in Belgium include a maximum treatment length of 18 months [11].
Treatment duration and persistenceIn the economic analyses, it was assumed that patients receiving romosozumab-to-alendronate treatment would be treated with romosozumab for a maximum of 1 year followed by 4 years of alendronate, whereas patients receiving alendronate monotherapy would remain on alendronate for a maximum of 5 years. Patients receiving teriparatide-to-alendronate treatment would be treated with teriparatide for a maximum of 1.5 years (in line with Belgian reimbursement criteria for teriparatide) followed by 3.5 years of alendronate [11]. Only patients who persisted with romosozumab for the initial year or with teriparatide for the initial 1.5 years were switched to alendronate.
The persistence to romosozumab in clinical practice is unknown. Treatment completion rates for the phase III clinical trial ARCH were approximately 90% at 12 months with romosozumab and approximately 77% at primary analysis with sequential alendronate [7]. Persistence for teriparatide was derived from a Swedish study with a 6-month and 12-month persistence of approximately 74% and 61%, respectively [12]. Since romosozumab is administered less frequently than teriparatide (monthly vs. daily), it was assumed that patients treated with romosozumab would have better persistence compared to those treated with teriparatide. The magnitude of the difference, however, is unknown. It was assumed that 90% of patients would persist throughout the 12-month treatment length. A scenario analysis was performed with persistence at 80%.
Since there is a lack of data on the persistence with alendronate as a follow-on therapy after bone-building agents, a DELPHI survey was conducted. Sixteen Belgian physicians with experience in treating osteoporosis participated in the survey [13]. According to the survey results, alendronate as a sequential therapy would have a persistence rate of 65% at year 1 and 30% at year 4. These rates were used for alendronate as a follow-on therapy after both romosozumab and teriparatide in the analysis. Sensitivity analyses using persistence rates sourced from Morley et al. [14] were also performed.
The persistence with alendronate as monotherapy was sourced from Li et al. [15]. Persistence for each time point and treatment is shown in Supplementary Table 5.
Fracture riskThe fracture risk in the model was based on a composite of three elements: the general population fracture incidence, the increased risk of fracture associated with severe osteoporosis (the relative risk) compared to the general population, and the effect of treatment on fracture risk.
Fracture incidence in the populationThe incidences of hip fractures were obtained from a national hospital database that covers all annual hospital stays in Belgium [16]. Comprehensive data on the risk of clinical vertebral and NHNV fractures in Belgium are scarce. However, the proportionality between fracture types is believed to be similar across the Western world [17]. Therefore, the incidence of fractures in Belgium was estimated by assuming the same ratio of clinical vertebral and NHNV fractures to hip fractures as observed in several studies [17,18,19]. The age-adjusted incidence of fractures per 100,000 person-years in Belgium is presented in Supplementary Table 1.
Fracture risk estimation for target patient populationsThe model was designed to accommodate both traditional and FRAX®-based risk assessment methods for calculating the relative risk of fractures for target patient populations compared to the general population risk, as described in Ström et al. [20]. The traditional method calculates relative risks using three clinical risk factors, namely age, BMD, and the prevalence of vertebral fractures [21], while the FRAX® tool takes into account ten clinical risk factors (CRFs) [22]. In estimating the relative risk using FRAX®, all CRFs need to be specified, whereas in the traditional method, all risk factors except age, BMD, and prevalent vertebral fracture are assumed to be prevalent at the same level as in the general population. Additionally, the traditional method can estimate relative risks below a certain T-score, whereas FRAX® estimates relative risk at a certain T-score. Since the two approaches reflect different types of patient populations, it is not always appropriate to compare their estimated relative risks.
In the base-case simulations, the traditional approach was used as it was submitted and accepted by the Belgian health technology assessment (HTA) authority for the reimbursement approval of romosozumab. However, a sensitivity analysis explored the FRAX®-based approach.
The model also captured the time-dependent increase in fracture risk after a fracture occurrence, which is not considered in either the traditional method or FRAX®. To estimate the time-dependent relative fracture risk in patients after a fracture, the model used algorithms based on Swedish retrospective data [23]. Figure 1 provides an example of how the fracture risk trajectory was estimated in the model using the traditional approach at different time points in a patient without a fracture at baseline.
Fig. 1
Trajectory of fracture risk
Treatment efficacyEfficacy of romosozumab-to-alendronate vs. alendronate monotherapy on the risk of hip, vertebral, and NHNV fractures was sourced from the phase III trial ARCH that studied the efficacy of romosozumab followed by alendronate compared with alendronate monotherapy [7]. Hazard ratios for romosozumab-to-alendronate vs. placebo were needed for the model because it was based on fracture risk for an untreated population. These were calculated by multiplying the hazard ratios of romosozumab-to-alendronate vs. alendronate monotherapy with hazard ratios of alendronate vs. placebo based on a published NMA [8]. The efficacy of teriparatide-to-alendronate has not been studied in a RCT as it has been for sequential romosozumab. Therefore, the efficacy of teriparatide to alendronate was derived from a NMA [8]. The observed cumulative effect in the NMA of teriparatide compared to placebo over 0–12 and 0–24 months and the cumulative effect of alendronate compared to placebo over 0–36 months was used for the teriparatide to alendronate treatment sequence. For alendronate as monotherapy, the cumulative effect over 0–12, 0–24, and 0–36 months compared to placebo was used. As data for 0–18 for teriparatide vs. placebo was not included in the NMA, 0–24 was conservatively used.
The treatment effects on fracture risk used in the model are described in Table 1. Treatment effect on fracture risk persists for a time (offset time) following treatment discontinuation, but few studies have directly evaluated the duration of offset after stopping treatment [24, 25]. The results of those studies vary but indicate that the residual efficacy may persist for at least as long as the time on treatment, except for denosumab. In line with previous research, following treatment discontinuation, treatment efficacy was assumed to linearly decline to zero over a period corresponding to the time a patient remained on treatment.
Table 1 Fracture hazard ratio (95% confidence interval) by fracture type and time point of romosozumab, alendronate, and teriparatide vs. placeboMortalityThe age and gender specific mortality rates for the general population in Belgium were based on the mortality rate in 2021 sourced from Statistics Belgium [26].
Hip and vertebral fractures are associated with an increase in mortality [27]. The relative risk of mortality compared to population mortality by age and over time after hip and vertebral fracture was derived from two Swedish studies [10, 27]. No excess mortality was assumed for NHNV-fractures.
Patients with osteoporosis have a higher degree of frailty compared to the general population, and excess mortality after a fragility fracture is not entirely attributable to the fracture event. In agreement with previous health economic studies, it was assumed that 30% of excess mortality after a fracture is associated with the fracture event [21, 28]. The increased mortality was assumed to persist for 8 years, in line with a pervious study [28].
Costs and quality of lifeCost of hip fractures in the first year was taken from two Belgian publications [29, 30]. Cost of vertebral fractures were calculated as a fraction of hip fracture cost for Belgium, according to the number of hip fracture morbidity equivalents at age of 70 [31]. These costs are conservative as they do not take into account the increased fracture costs with increasing age, as described in other publications [31]. Cost of NHNV fractures only considered the initial phase of the medical management of fractures, excluding re-hospitalisations and nursing home stays [32, 33]. Studies measuring resources consumed in the following year after the fracture [34, 35] showed an additional cost of 34–73% of the initial management cost, which was added to the initial costs of NHNV fractures. Resource utilization, the corresponding unit costs, and sources are described in Supplementary Table 2. All costs are stated in euro (€) 2022 prices. When needed, the costs were inflated to 2022 prices using Belgian Health Index, using reference year 2013 [36]. A yearly discount rate of 3% was used for costs and a rate of 1.5% for effects in line with current recommendations [37].
The impact on quality of life during the first and subsequent years after hip, vertebral, and NHNV fractures was based on data from the International Costs and Utilities Related to Osteoporotic Fractures Study (ICUROS) [4]. The multipliers (Supplementary Table 3) were used together with population tariff values for Belgium (Supplementary Table 4).
AnalysisThe main outcome was the incremental cost-effectiveness ratio (ICER) representing the additional costs required to gain one additional quality-adjusted life year (QALY) with romosozumab followed by alendronate against alendronate monotherapy and against teriparatide followed by alendronate treatment.
Deterministic sensitivity analyses (DSA) were conducted to estimate the impact on the ICER of changing one parameter input at a time. Additionally, the impact of changing persistence rate, treatment efficacy, utility multiplier, and treatment start age was tested.
Two different scenarios using the FRAX® approach for estimating fracture risk were tested. In the first scenario, the T-score was set to − 2.5, while in the second scenario, the T-score was set to − 3.2, which approximately corresponds to the average T-score for postmenopausal women with a T-score of − 2.5 and below [23].
Probabilistic sensitivity analyses (PSA) were conducted by simultaneous sampling from estimated probability distributions of model parameters to obtain 1000 sets of model input estimates. A willingness-to-pay (WTP) per QALY gained threshold of €35,000 was applied.
留言 (0)