
記住我


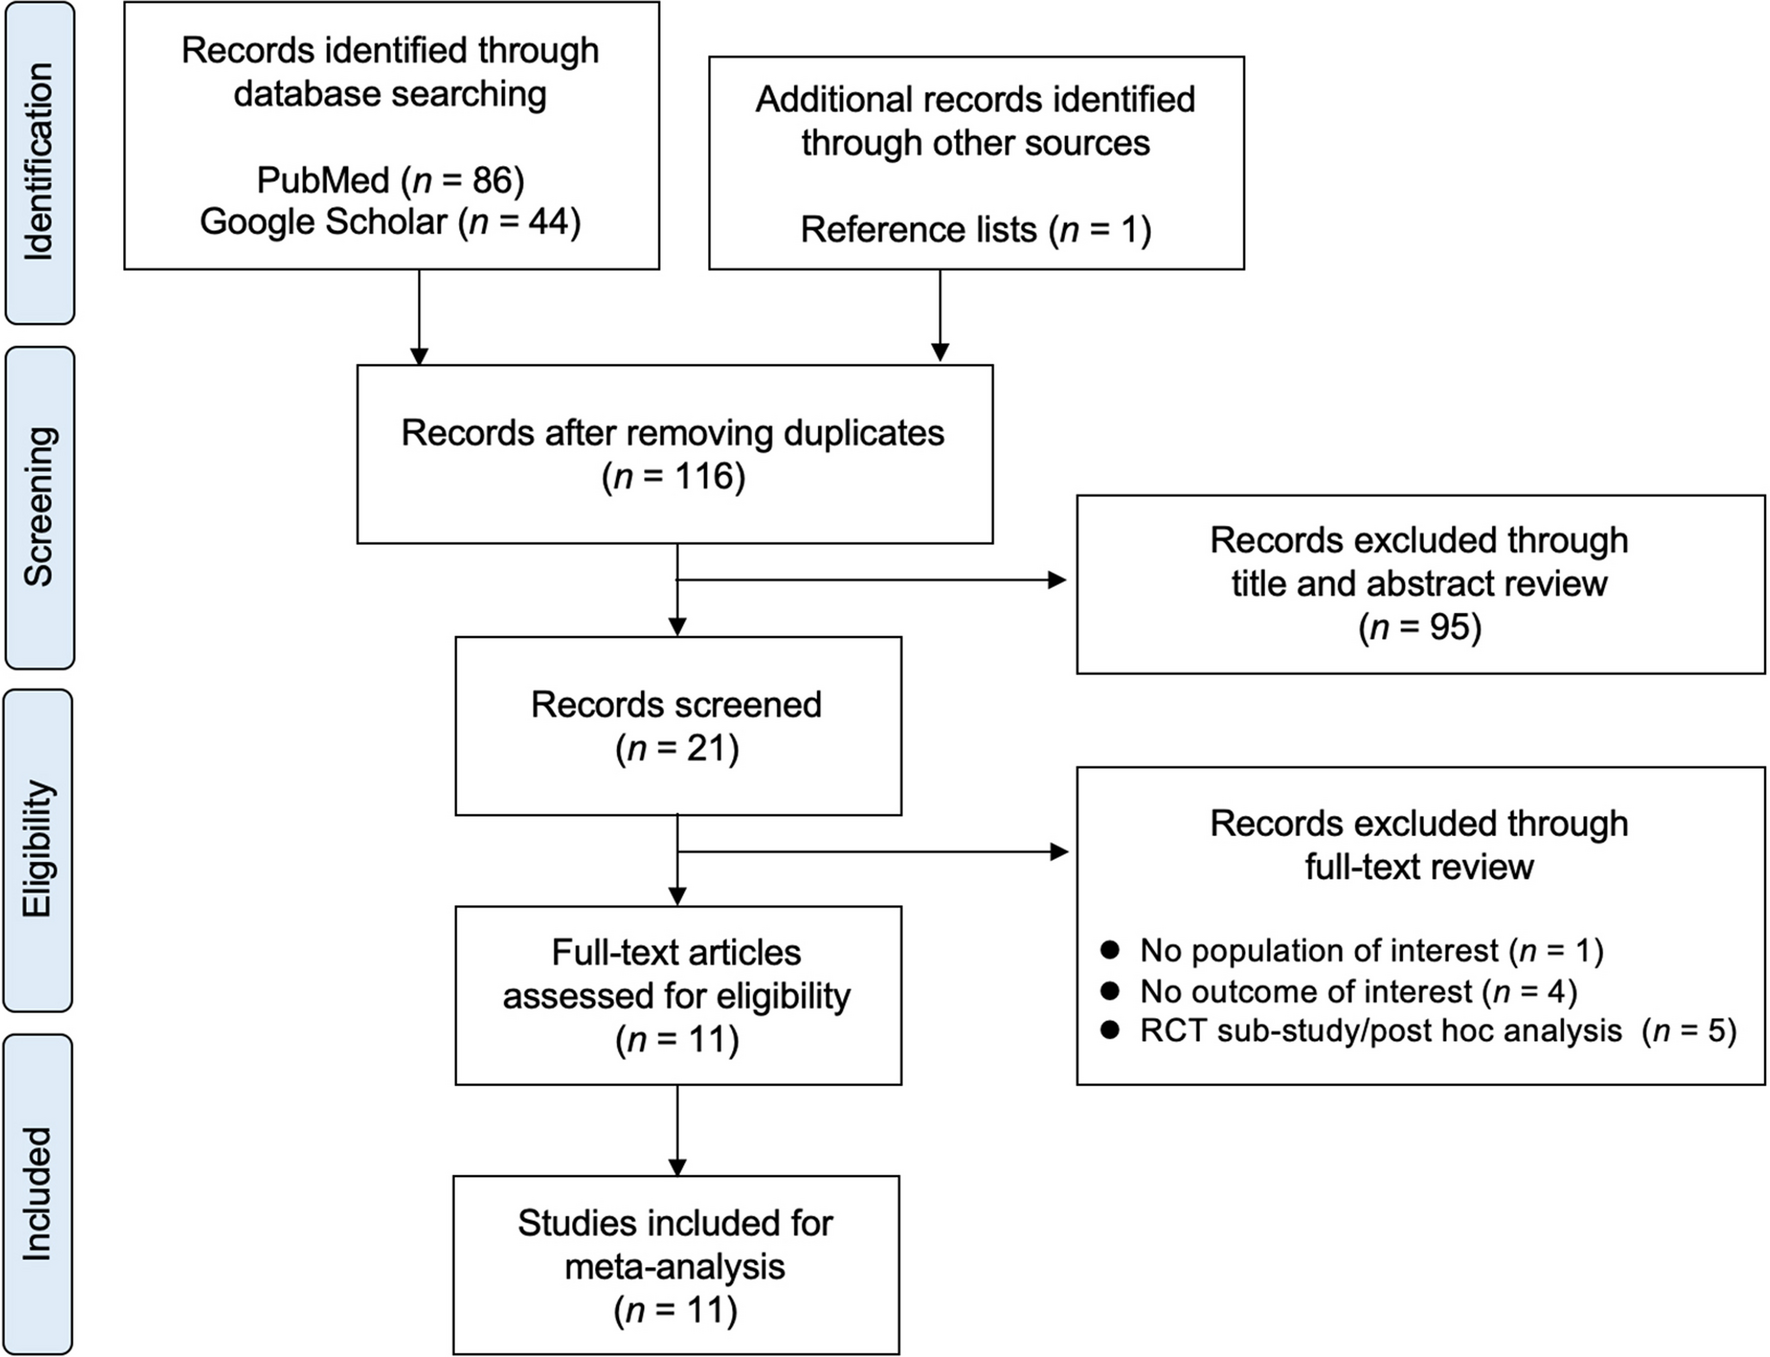


The initial search provided 1,959 results after excluding duplicates, 96 of which were reviewed for full-text eligibility. Of those, 76 articles were excluded with reasons (Supplementary Table 1). Finally, 20 studies were selected for qualitative and 12 for quantitative analysis [7,8,9,10, 12, 13, 17,18,19,20,21,22] (eight studies [11, 23,24,25,26,27,28,29] were excluded from the meta-analysis due to a lack of extractable data for comparisons). Notably, the study by Nudy et al. [11], and Hippisley-Cox et al. [29], were excluded since they did not provide the exact number of patients with VMS, either as hot flushes or night sweats. A flow chart diagram is illustrated in Fig. 1.
Fig. 1
Five [7, 8, 12, 19, 22] studies investigated the association between VMS and fracture risk, whereas five [7, 10, 12, 13, 21] addressed the occurrence of low BMD (osteopenia or osteoporosis). Furthermore, eight [8, 9, 12, 17,18,19,20, 22], seven [8, 9, 12, 18,19,20, 22] and four [9, 18, 20, 22] studies provided data regarding the difference in LS, FN, TH BMD, respectively, between patients with and without VMS. Overall, 49,659 patients were included in the analysis.
VMS and risk of fractureThe five studies [7, 8, 12, 19, 22] assessing the association between VMS and fractures, found no increased risk in women with VMS compared with those without VMS (OR 1.04, 95% 0.93–1.16, I2 16%) (Fig. 2). Regarding the type of fracture, three studies provided data on vertebral fractures showing again no association with VMS (OR 0.95, 95% CI 0.77–1.19, I2 0%) [7, 8, 19]. Only the study by Crandall et al., published in 2015 [8], provided data on hip fractures, showing increased risk in women with moderate/severe VMS (compared with no VMS) [hazard ratio (HR) 1.78, 95% CI 1.20–2.64].
Fig. 2
Forest plot of the fracture risk between women with and without vasomotor symptoms (VMS)
VMS and risk of low BMD (osteopenia or osteoporosis)Since only three studies provided data for the diagnosis of osteoporosis and two studies for osteopenia, these were combined into one category termed “low BMD” [7, 10, 12, 13, 21]. The presence of VMS was associated with an increased risk of low BMD compared with the absence of VMS (OR 1.55, 95% CI 1.43–1.68, I2 0%) (Fig. 3).
Fig. 3
Forest plot of the low BMD risk (osteopenia or osteoporosis) between women with and without vasomotor symptoms (VMS)
VMS and mean difference in BMDRegarding LS BMD, patients with VMS had lower values compared with those without VMS (n=8, MD -0.019 g/cm2, 95% CI -0.03 to -0.008, I2 85.2%) [8, 9, 12, 17,18,19,20, 22]. In contrast, there was no difference in FN (n=7) [8, 9, 12, 18,19,20, 22] or TH BMD (n=4) [9, 18, 20, 22] between women with and without VMS [MD -0.010 g/cm2 (95% CI -0.021 to 0.001, I2 78.2%) and -0.040 g/cm2 (95% CI -0.0 to 0.008, I2 94.2%, respectively)]. The difference in LS and FN BMD between women with and without VMS is presented in Fig. 4.
Fig. 4
Forest plot of the difference in A) lumbar spine (LS) and B) femoral neck (FN) BMD between women with and without vasomotor symptoms (VMS)
Subgroup analysisThe effect of VMS severity on fracture risk and BMDThree studies [7, 8, 12] were eligible for comparing moderate/severe VMS and no VMS, while two studies [8, 12] provided data on mild VMS. No association with the risk of fracture was found when the analysis was confined to these subgroups [OR 1.08 (95% CI 0.79–1.46, I2 40%) and 1.08 (95% CI 0.60–1.94, I2 64%) for moderate/severe and mild VMS, respectively, compared with no VMS]. However, both moderate/severe (n=4) [7, 10, 12, 13] and mild VMS (n=2) [10, 12] were associated with an increased risk of low BMD compared with no VMS [OR 1.79 (95% CI 1.63–1.96, I2 0%) and 1.28 (95% CI 1.15–1.41, I2 0%), respectively].
Moreover, women with moderate/severe VMS demonstrated lower LS (n=4, MD -0.025 g/cm2, 95% CI -0.042 to -0.008, I2 72.9%) [8, 12, 17, 20] and FN BMD (n=3, MD -0.011 g/cm2, 95% CI -0.02 to -0.004, I2 0%), respectively) than those without VMS [8, 12, 20]. Mild VMS were also associated with lower BMD in LS, but not FN, compared with no VMS. There were no available data regarding the effect of VMS severity on TH BMD.
The effect of study design on the risk of fracture and BMDRegarding fracture risk, there was still no association with VMS, when the analysis was limited to cohort studies (n=2, OR 1.11, 95% CI 0.98–1.28) [8, 22] or case-control studies (n=2, OR 0.86, 95% CI 0.61–1.22) [7, 12]. Furthermore, when data from case-control studies [7, 12, 13] were analyzed separately, the risk of low BMD still was increased in women with a history of VMS (OR 1.39, 95% CI 1.06–1.82) similarly to cross-sectional studies (OR 1.56, 95% CI 1.43–1.69) [10, 21]. Regarding BMD, cohort and cross-sectional studies showed similar differences for LS and FN between groups.
The effect of age on fracture risk and BMDOnly one study provided sufficient data for different age groups regarding the fracture risk [8], showing an increased risk of hip fracture in patients with VMS only for the older age group (70-79 years old; HR 1.93, 95% CI 1.11–3.53). No such risk was demonstrated for vertebral and non-vertebral fractures [8].
Notably, meta-regression analysis showed that age was not a predictor neither for fracture risk (p=0.11) nor for low BMD (p=0.707). Age also did not affect MD in LS (p=0.807) and FN BMD (p=0.498) between groups.
Sensitivity analysisA sensitivity analysis was performed according to study quality and MHT use. Classification of studies according to NOS is presented in Supplementary Table 2. After excluding two fair-quality studies [12, 18], the risk estimation for fractures, low BMD and LS or FN BMD remained unaltered.
Concerning MHT use, there were four studies [13, 17, 19, 22] in which MHT was used by a variable proportion of patients (although MHT was included in the multivariable-adjusted models). However, the association between VMS and low BMD and MD in LS BMD between groups remained significant after restricting the analysis to studies where MHT was an exclusion criterion, but presence of VMS and fracture risk remained not significant (OR 1.12, 95% CI 0.98–1.28).
Publication biasPublication bias was not evident regarding the risk of fracture (p=0.546) or low BMD (p=0.435), and TH BMD (p>0.20). However, Egger’s test showed significance for MD in LS (p=0.09) and FN BMD (p=0.06), possibly due to the effect of small sample size on study outcomes (Supplementary Figure 1).
留言 (0)