
記住我
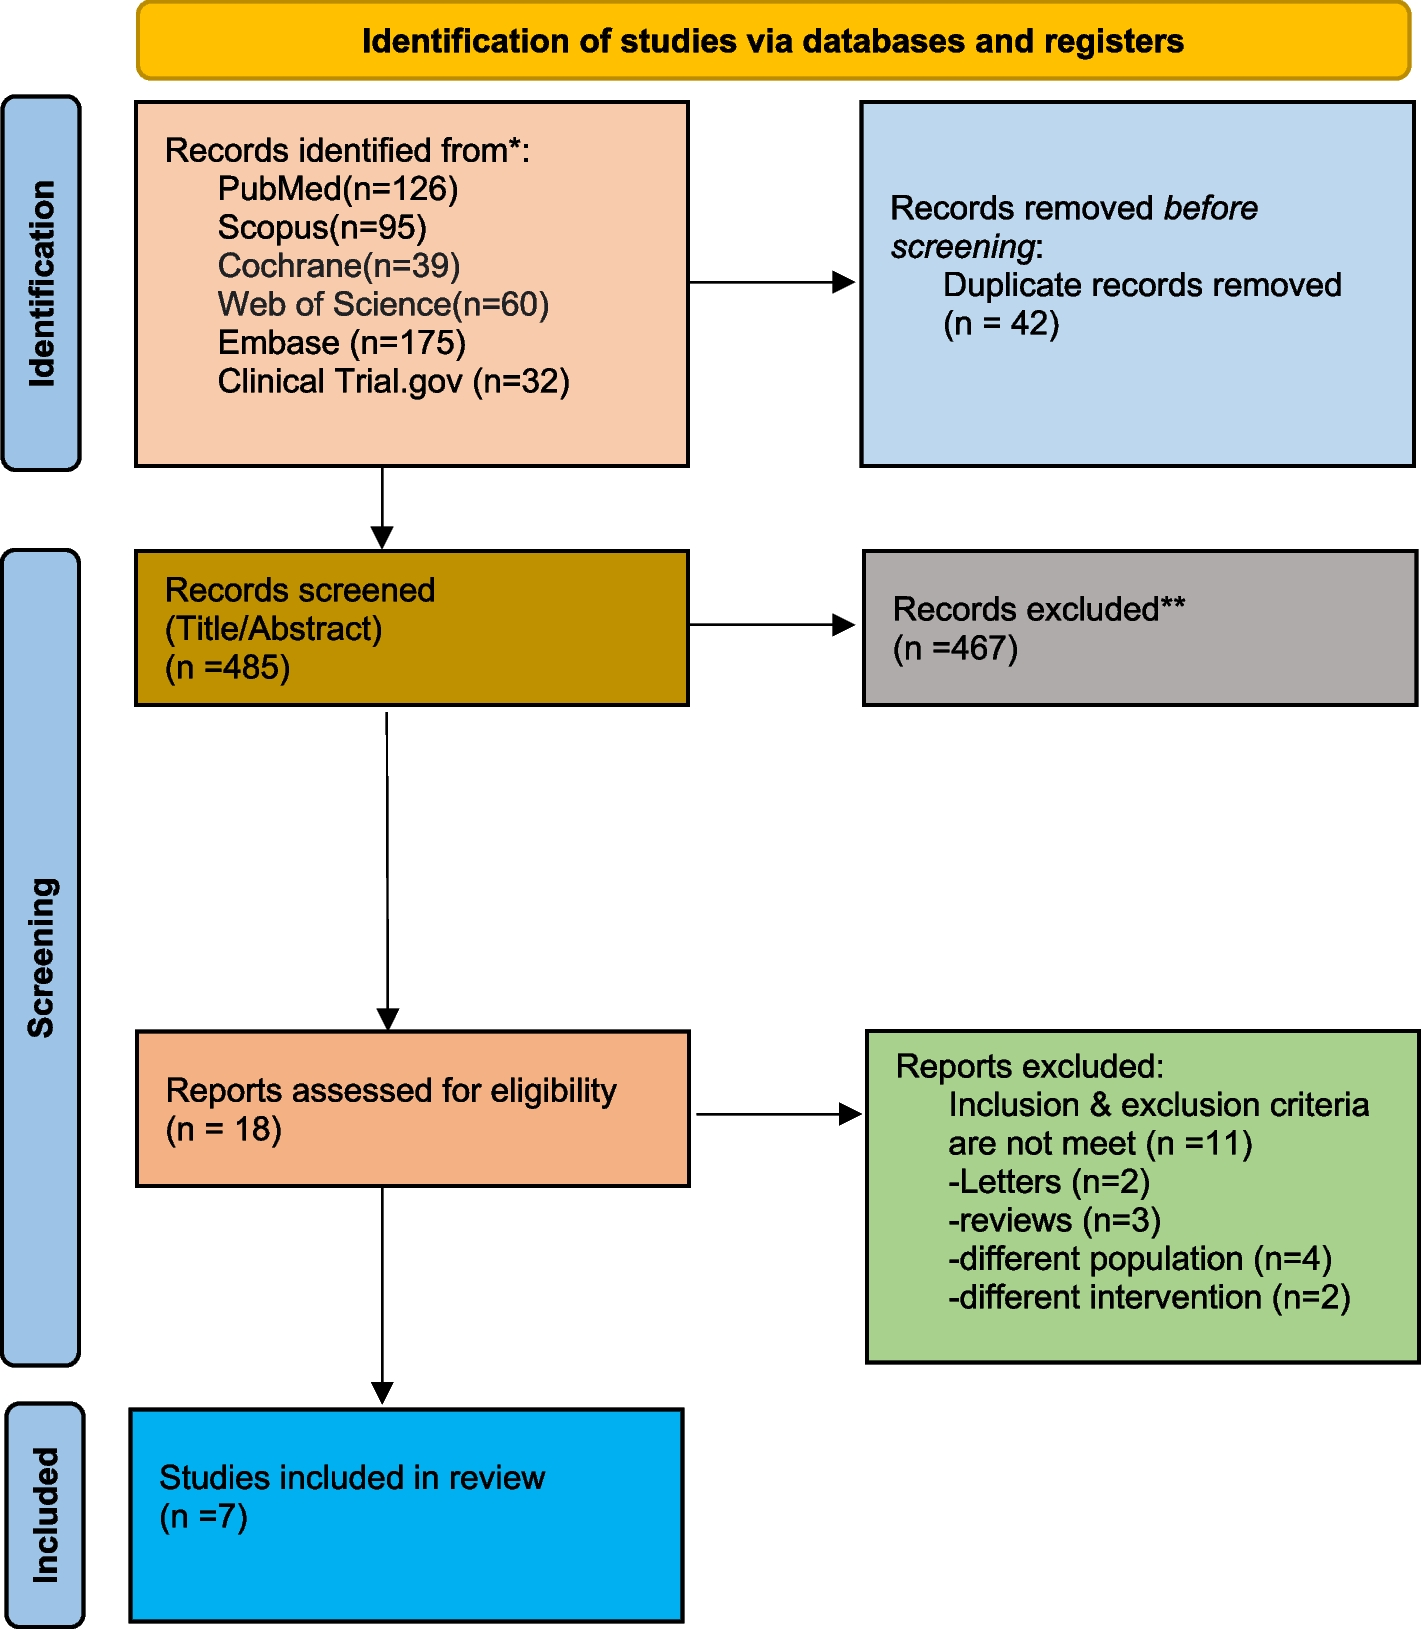


The initial search strategy returned 526 studies of which 13 were found to be relevant and incorporated into the final analyses (Fig. 1). These 13 studies were retrospective in design, and included 11 and 2 studies respectively conducted in China and Spain. For further study-specific details, see Table 1.
Fig. 1
The study selection process for this meta-analysis
Table 1 Characteristics of studies included in meta-analysisA total of 1,731 and 693 malignant and benign PNs were ultimately included in these studies. Numbers of predictors included in individual predictive models ranged from 2 to 7 (Table 2). Except for PET/CT, age was the predictor in 12 of the 13 models. The common malignant CT features, such as lobulation, spiculation, and pleural retraction, occurred in 6, 5, and 3 models. Different models could provide different performances and therefore a different number of TP, TN, FP, FN. For details regarding raw TP, FP, TN, and FN data, see Table 3.
Table 2 The details of each predictive modelTable 3 Raw Data of diagnostic performance of studies included in this meta-analysisBias analysesThe potential for bias was examined using the QUADAS-2 tool (Fig. 2). This approach revealed that 9 of the 13 studies did not indicate whether patients were consecutively enrolled [12, 15,16,17,18,19,20, 22, 23], and a partially overlapping set of 9 studies did not provide sufficient clarity regarding blinding status [11,12,13,14, 16,17,18,19,20]. Reference standards were used for diagnostic confirmation in all studies.
Fig. 2
(A) The quality assessment of each included study. (B) The summary of the quality assessment
PET/CT-based model diagnostic performanceTP, FP, TN, and FN data for PET/CT-based models were provided in all 13 studies. The respective pooled sensitivity, specificity, PLR, and NLR values for these models were 88% (95%CI: 0.86–0.91, Fig. 3a), 78% (95%CI: 0.71–0.85, Fig. 3b), 4.10 (95%CI: 2.98–5.64, Fig. 3c), and 0.15 (95%CI: 0.12–0.19, Fig. 3d), with all four being subject to significant heterogeneity (I2 = 69.25%, 78.44%, 71.42%, and 67.18% respectively). The AUC value was 0.91 (95%CI: 0.88–0.93, Fig. 3e), and the SROC curve deviated substantially from a shoulder-like appearance, indicating that a threshold effect is unlikely to influence these results. A Fagan plot with a 20% pre-test probability exhibited respective 51% and 4% post-test PLR and NLR probabilities (Fig. 3f), with no evidence of significant publication bias (P = 0.996).
Fig. 3
The results of (A) sensitivity, (B) specificity, (C) PLR, (D) NLR, (E) SROC, and (F) Fagan diagram for PET/CT based model
The diagnostic utility of PET results aloneRaw TP, FP, TN, and PN data for diagnoses made solely based on PET-derived SUVmax values were provided by 6 studies [14, 16, 17, 20,21,22]. The respective pooled sensitivity, specificity, PLR, and NLR values for diagnoses made based only on these values were 92% (95%CI: 0.85–0.96, Fig. 4a), 51% (95%CI: 0.37–0.66, Fig. 4b), 1.89 (95%CI: 1.36–2.62, Fig. 4c), and 0.16 (95%CI: 0.07–0.35, Fig. 4d), with all four values again being subject to significant heterogeneity (I2 = 88.08%, 82.63%, 80.19%, and 86.38%). The corresponding AUC value was 0.82 (95%CI: 0.79–0.85, Fig. 4e), and the appearance of the SROC curve did not reveal any evidence of a threshold effect. A Fagan plot with a 20% pre-test probability exhibited respective 32% and 4% post-test PLR and NLR probabilities (Fig. 4f), with no evidence of significant publication bias (P = 0.566).
Fig. 4
The results of (A) sensitivity, (B) specificity, C) PLR, (D) NLR, (E) SROC, and (F) Fagan diagram for PET/CT alone
SUVmax valuesThe mean SUVmax values for benign and malignant PNs were reported in 4 total studies [13, 15, 20, 21]. Significantly higher pooled SUVmax values were observed for malignant PNs as compared to benign nodules (P < 0.00001, Fig. 5a), although significant heterogeneity was detected (I2 = 60%). Sensitivity analyses suggested that the study conducted by Liu et al. [16] was the greatest source of heterogeneity, but even with the removal of this study the pooled SUVmax of malignant PNs remained higher than that of benign PNs (P < 0.00001). Funnel plots revealed a low risk of publication bias (Fig. 5b).
Fig. 5
(a) The forest plot of the pooled SUVmax values between malignant and benign PNs. (b) The assessment of the publication bias of SUVmax values
留言 (0)