
記住我
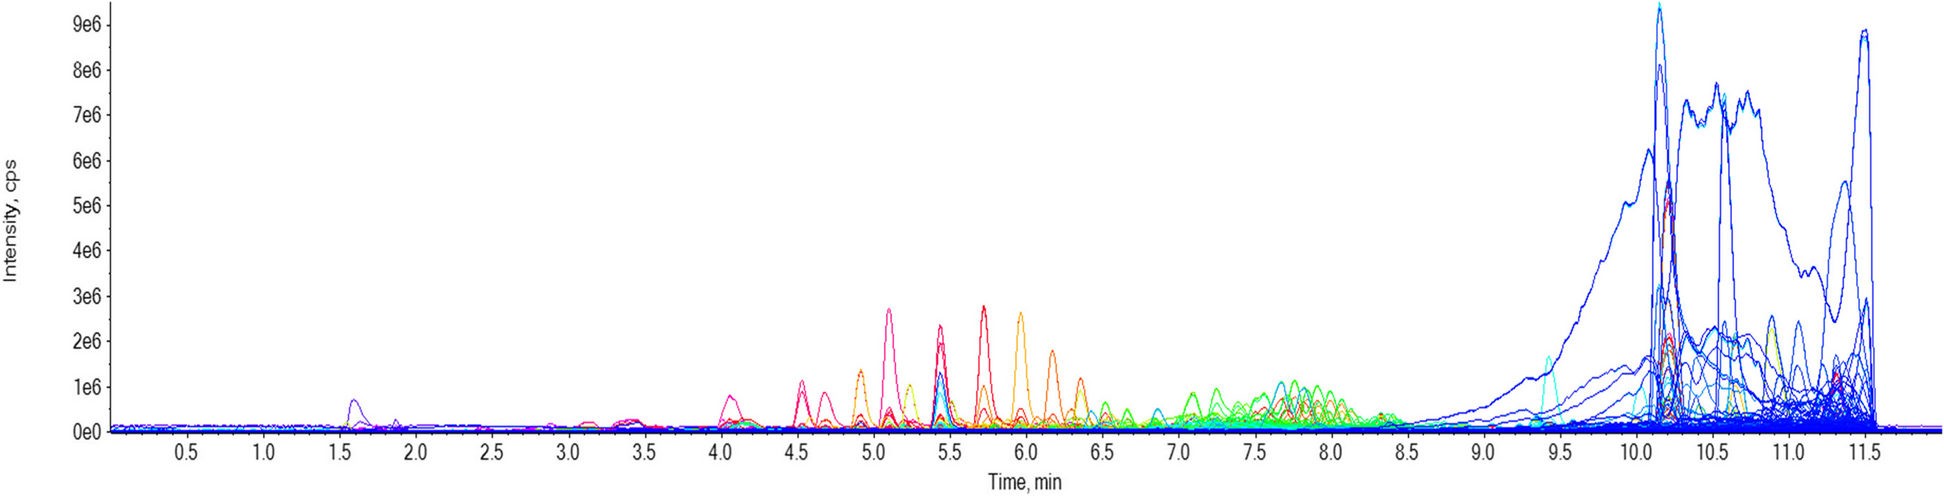
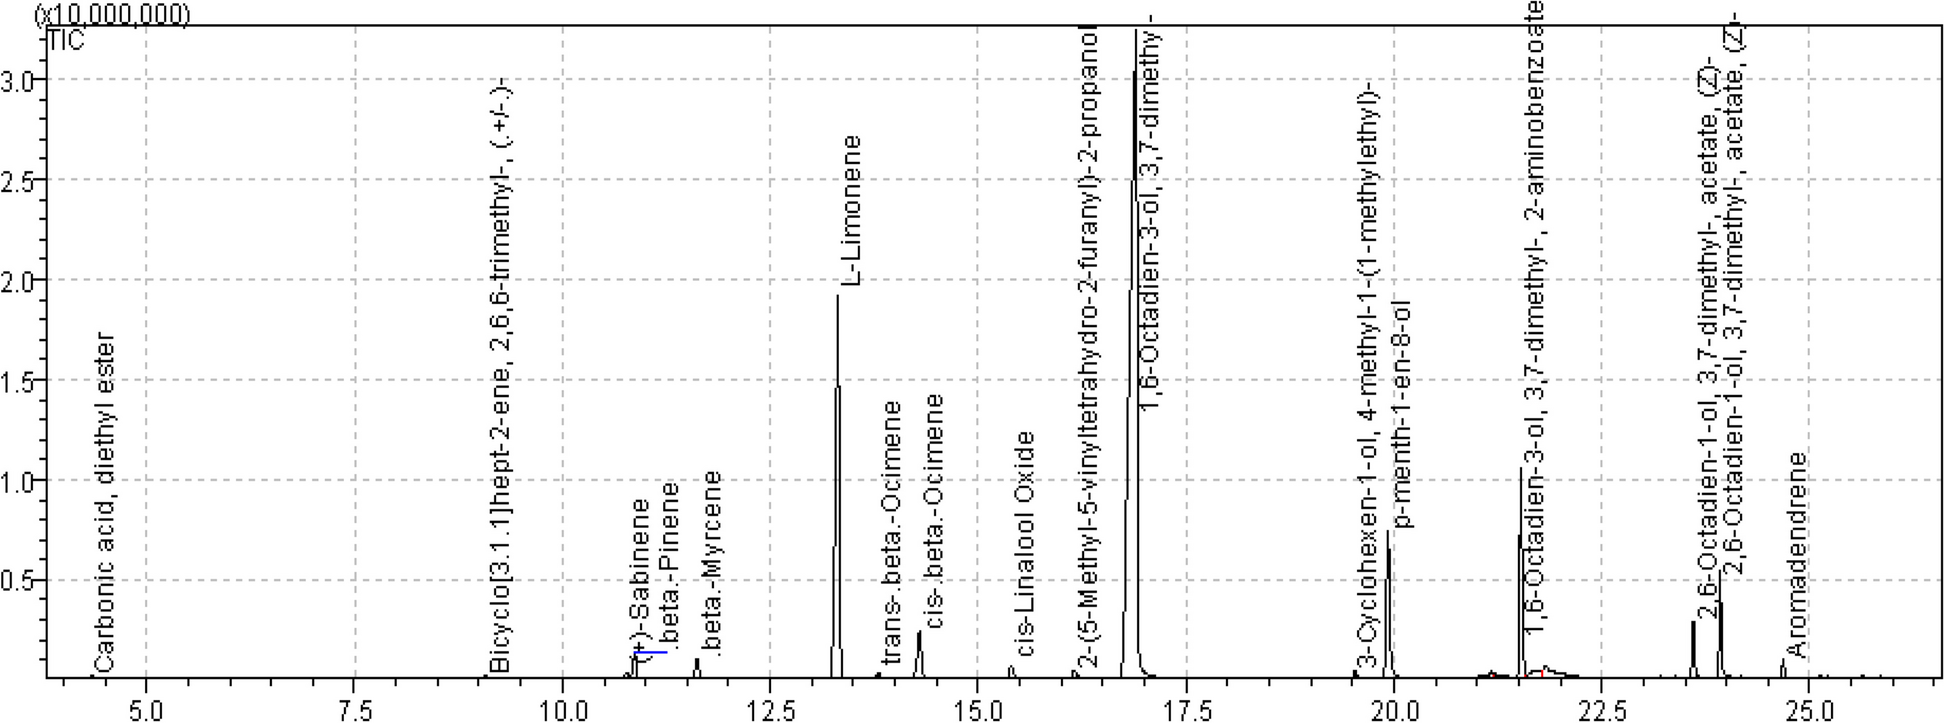
The analysis of unsaponifiable fraction (UF) can provide valuable insights into the composition and potential health and industrial applications of various lipids and oils. Gas chromatography/mass spectrometry (GC/MS) was utilized to analyze the unsaponifiable fraction of C. equistefolia needles. The total ion chromatogram and the various components of the unsaponifiable fraction were shown in Fig. 1. The unsaponifiable fraction's GC/MS analysis (Table 1) revealed that it included a combination of triterpenes, sterols, and hydrocarbons. The hydrocarbons ranged from C6 to C35, with C7 (16.15%) being the predominant hydrocarbon. The sterol α-sitosterol was also present (0.53%). The triterpenes α-amyrin, germanicol, and lupenone were present, with lupeol being the primary triterpene (9.09%).
Fig. 1
GC/MS chromatogram of the unsaponifiable fraction of C. equistefolia needles
Table 1 GC/MS of the unsaponifiable fraction of C. equistefolia needlesFatty acid methyl estersThe GC/MS technique was used to examine the fatty acid methyl esters of C. equistefolia. The chromatogram (Fig. 2), depicted the analysis and presenting the fatty acid composition. The findings from the analysis of fatty acids using GC/MS (Table 2) showed that there were 13 fatty acid methyl esters present, which accounted for 89.44% of the overall acids. The primary fatty acid was palmitic acid methyl ester (C16:0), which constituted 54.75%, followed by arachidic acid methyl ester at 10.27%.
Fig. 2
GC/MS Chromatogram of fatty acid methyl esters fraction of C. equistefolia needles
Table 2 GC/MS of fatty acid methyl esters fraction of C. equistefolia needlesIdentification of the phenolic componentsEight flavonoidal compounds and two phenolic acids were isolated from different column chromatography techniques of chloroform, ethyl acetate, and butanol extracts see Fig. 3. The chloroform extract led to the identification of two phenolic acids and one flavonoidal compound, while the ethyl acetate and butanol extracts resulted in the isolation of four and three flavonoidal compounds, respectively. The structures of these compounds were determined through color reactions, Rf values, chemical investigations such as acid and enzymatic hydrolysis, and spectral measurements including UV, NMR, and EI/MS. The spectroscopic data were compared with previously published values to confirm their identities [23, 24]. The compounds were identified as caffeic acid (1), ferulic acid (2), apigenin (3), quercetin (4), kaempferol (5), 3,5-dihydroxy-7,3′,4′-trimethoxyflavone (6), apigenin-7-O-glucoside (7), kaempferol-3,7-O-dirhamnoside (8), luteolin 6,8-di-C-glucoside (9), and quercetin-3-O-α-rhamnosyl (1′′′→6′′) β-glucoside (10).
Fig. 3
Chemical structures of the phenolic compounds isolated from different extracts of Casuarina equistefolia needles
A yellowish-brown powder compound C1, was obtained in a quantity of 43 mg, has an Rf value of 0.70 in BAW and an Rf value of 0.55 in 15% acetic acid. The UV λmax (nm) of C1 in MeOH is 270 and 268, indicating that it has a phenolic nature when sodium methoxide (NaOMe) is added. The molecular formula of C-1 is C9H8O4, as confirmed by EI/MS with an m/z of 180. The 1H-NMR (500 MHz, CD3OD) spectrum of C1 shows peaks at δppm 7.65 (1H, d, J = 2.0 Hz, H-2), 6.24 (1H, d, J = 9.2 Hz, H-5), 6.38 (1H, dd, J = 8.2, 2.0 Hz, H-6), 7.21 (1H, d, J = 15.9 Hz, H-7), and 6.12 (1H, d, J = 15.9 Hz, H-8). By comparing this data with literature data [25], C1 was confirmed to be caffeic acid.
A colorless powder compound C2, was obtained in a quantity of 15 mg, with an Rf value of 0.48 in BAW and an Rf value of 0.8 in 15% acetic acid. The molecular formula of C2 is C10H10O4, as confirmed by EI/MS with an m/z of 194. The 1H-NMR (500 MHz, CD3OD) spectrum of C2 shows peaks at δppm 7.67 (1H, d, J = 2.0 Hz, H-2), 9.12 (C-3, OH, s, H-4), 6.42 (1H, d, J = 8.0 Hz, H-5), 6.65 (1H, dd, J = 8.0, 2.0 Hz, H-6), 6.98 (1H, d, J = 16.0 Hz, H-7), 6.12 (1H, d, J = 16.0 Hz, H-8), and 3.60 (3H, s, O-Me). The 13C-NMR (125 MHz, CD3OD) spectrum of C2 shows peaks at δppm 127.1, 110.8, 148.7, 150.0, and 115.7 for C (1, 2, 3, 4, 5), and 123.5, 146.2, 116.1, and 170.8 for C (6, 7, 8, 9), and 56.2 for O-Me. By comparing this data with literature data [26], C2 was confirmed to be ferulic acid.
A yellow shapeless compound C3, was found and its Rf values were measured in two solvents, 15% acetic acid and BAW (3:1:1), showing that it is an aglycone. The data gathered from UV, MS, and 1H-NMR analyses were identical to the data reported for apigenin in a previous study by [27].
A yellow powder, compound C4 (also known as quercetin) was obtained in a quantity of 25 mg. Its behavior in various solvent systems was analyzed through chromatography on PC, which showed that it is an aglycone (with Rf values of 0.69 in BAW and 0.21 in 15% acetic acid). The spectra measured for the compounds were consistent with those reported for quercetin in a previous study conducted by [27].
A yellow shapeless substance, C5, was obtained in a quantity of 30 mg. Its behavior in different solvent systems was analyzed through chromatography on PC, which revealed that it is an aglycone (with Rf values of 0.72 in BAW and 0.11 in 15% acetic acid). The compound's UV spectra were measured in various solvents (MeOH, NaOMe, AlCl3, AlCl3/HCl, NaOAC, NaOAC/H3BO3), and its EI/MS and 1H-NMR spectra were obtained as well. Based on the obtained data, the compound was identified as kaempferol and the data was consistent with that reported in a previous study by [28].
A yellow powder, compound C6, was obtained in a quantity of 20 mg. Its behavior in different solvent systems was analyzed through chromatography on PC, which revealed that it has Rf values of 0.85 in BAW and 0.28 in 15% acetic acid. The compound's UV spectra were measured in various solvents (MeOH, NaOMe, AlCl3, AlCl3/HCl, NaOAC, NaOAC/H3BO3), and its EI/MS and 1H-NMR spectra were obtained as well. Based on the obtained data, the compound was identified as 3,5 dihydroxy- 7,3', 4'-tri methoxy flavone, and the data was consistent with that reported in a previous study by Elgindi et al. in 2016. The compound has a molecular formula of C18H16O7, and its 1H-NMR spectra showed signals at 7.50, 7.22, 7.08, 6.80, and 6.53 ppm, which are attributed to various protons in the molecule. The compound also showed three signals corresponding to three methoxy groups at 3.70, 3.66, and 3.63 ppm [29]. Compound C7 was identified as apigenin-7-O-glucoside, a yellow amorphous powder weighing 35 mg. Its chromatographic behavior on PC in different solvent systems indicated that it is glycosidic, with Rf values of 0.36 in BAW and 0.28 in 15% acetic acid. Complete acid hydrolysis yielded apigenin as an aglycone and glucose as the sugar moiety. UV analysis showed λmax values of 268, 291, and 333 nm in MeOH, and 269, 314, and 382 nm in NaOMe, among others. EI/MS analysis revealed a primary ion with m/z 432 and a secondary ion with m/z 270 for the aglycone apigenin, indicating the formula C21H20O10. 1H-NMR analysis showed peaks at δ ppm 7.92 (2H,d, J = 8.2 Hz H-2,6), 6.90 (2H, d, J = 8.15 Hz, H-3', H-5'), 6.82 (1H, d, J=2.2 Hz, H-8), 6.43(1H, d, J= 2.2 Hz, H-6), 5.44 (1H, d, J=7.4 Hz, H-1"), and 3.17-3.47 (5H, m, H-3"–H-6"). The data matched the characteristics reported in the literature [27]. The compound C8, also known as kaempferol-3,7-O-dirhamnoside, is a yellow amorphous powder with a weight of 16 mg and a yield of 25 mg. It exhibits glycosidic behavior based on its chromatographic properties in various solvent systems, with an Rf value of 0.36 in BAW (3:1:1) and 0.70 in 15% acetic acid. Upon complete acid hydrolysis, kaempferol is released as the aglycone, while rhamnose is the sugar moiety. Its UV spectrum shows absorption peaks at 254, 264, and 350 nm in MeOH, 254, 269, and 412 nm in NaOMe, 261, 305, 364, and 400 nm in AlCl3, and 253, 270, and 349 nm in NaOAc/H3BO3, among others. Its EI/MS spectrum exhibits a molecular ion peak at m/z 610 corresponding to the molecular formula C27H30O16, with secondary ions at m/z = 432 and m/z = 286 corresponding to the loss of rhamnose moieties. Its 1H-NMR spectrum in CD3OD shows signals at δ ppm 7.77, 6.9, 6.7, 6.45, 5.5, 5.32, 1.3, and 0.9, which are consistent with the published data [30]. The compound C9, luteolin 6,8-di-C-glucoside, also known as Lucenin-2, is a yellowish powder with a glycosidic nature. Its behavior on paper shows an Rf value of 0.30 in BAW (3:1:1) and an Rf value of 0.62 in 15% acetic acid. Its UV spectrum in various solvents such as MeOH, NaOMe, AlCl3, AlCl3/HCl, NaOAC, and NaOAC/H3BO3 shows absorption maxima at different wavelengths. Its molecular formula is C27H30O16, and its EI/MS spectrum shows a molecular ion peak at m/z 610. Its 1H-NMR spectrum in DMSO-d6 shows signals at δ ppm 7.55, 7.48, 6.88, 6.69, 4.76, and 4.81. It is identified as luteolin 6,8-di-C-glucoside (Lucenin-2) by responding to enzymatic hydrolysis with β-glucosidase and resisting acid hydrolysis, indicating it is in C-glycosidic linkage. This identification is consistent with previously reported data [15]. The compound C10, Quercetin-3-O-α-rhamnosyl (1'''→6''') β-glucoside, also known as rutin, is a yellow amorphous powder weighing 25 mg. Its chromatographic behavior on PC in different solvent systems shows an Rf value of 0.38 in BAW (3:1:1) and an Rf value of 0.66 in 15% acetic acid, indicating its glycosidic nature. Upon complete acid hydrolysis, it yields quercetin as an aglycone, rhamnose, and glucose as sugar moieties. Its UV spectrum in various solvents such as MeOH, NaOMe, AlCl3, AlCl3/HCl, NaOAc, and NaOAc/H3BO3 shows absorption maxima at different wavelengths. Its molecular formula is C27H30O16, and its EI/MS spectrum shows a molecular ion peak at m/z 610. Its 1H-NMR spectrum in DMSO-d6 shows signals at δ ppm 7.50, 6.80, 6.34, 6.15, 5.11, 4.33, 3.90-3.20, and 0.95. It is identified as quercetin-3-O-α-rhamnosyl (1'''→6''') β-glucoside (rutin), which is consistent with previously reported data [31].
Quantitative analysis of the phytochemicalsTable 3 presents the findings on the total phenolic and flavonoid contents, as well as antioxidant activity, of various extracts of C. equistefolia needles. The methanolic extract (10 CE) had the highest total phenolic content (58.44±0.37 mg/g gallic acid eq.), followed by the ethyl acetate extract (8 CE) (49.33±0.32 mg/g gallic acid eq.) and butanol extract (9 CE) (45.02±0.30 mg/g gallic acid eq.). The total phenolic contents of the chloroform extract (7 CE), mother liquor (11 CE), and hexane extract (12 CE) were (41.21±0.29, 35.71±0.25, and 27.53±0.18 mg/g gallic acid eq.), respectively. Meanwhile, the methanolic extract (10 CE) had the highest total flavonoid content (32.05±0.30 mg/g quercetin eq.), while the hexane extract (12 CE) had the lowest total flavonoid content (15.73±0.22 mg/g quercetin eq.). The results also revealed that antioxidant activity increased as the absorption at 517 nm decreased. The methanolic extract (10 CE) demonstrated the most potent antioxidant activity, accounting for about 86.32%, followed by the ethyl acetate extract (8 CE) at 82.65%.
Table 3 TPC, TFC and antioxidant activity of different extracts of C. equisetifoliaAntimicrobial activityThe researchers screened six extracts for their antimicrobial activity against six microorganisms, including two Gram-positive bacteria, two Gram-negative bacteria, and two fungal species, and recorded the size of the inhibition zones in Table 4 and Fig. 4. The ethyl acetate extract (8 CE) demonstrated a larger inhibition zone ranging from 13 to 16 mm against Gram-positive (Bacillus subtilis and Staphylococcus aureu) respectively, and Gram-negative bacteria (P. aeruginosa and E. coli), with a clear zone diameter ranging from 12 to 13 mm. respectively. The hexane extract (12 CE) demonstrated effective antimicrobial activity against Gram-positive bacteria with a range of clear zone diameters between 13 to 15 mm, and against Gram-negative bacteria with a range of 12 to 13 mm. Additionally, with a zone of inhibition of 12 mm. ranging from 13 to 14 mm against both Gram-positive and Gram-negative bacteria, the butanol extract (9 CE) also demonstrated antibacterial activity. The chloroform extract (7 CE) also showed antibacterial activity, with clear zone widths of 12 to 13 mm against Gram-negative bacteria and 13 to 14 mm against Gram-positive bacteria (with a zone of inhibition of 12 mm). The study found no inhibitory action against Gram-negative bacteria (E. coli), but found modest antibacterial activity against Gram-positive bacteria (S. aureus) and Gram-negative bacteria (P. aeruginosa) with methanolic extract (10 CE) of Casuarina equisetifolia needles. The mother liquor extract (11 CE) showed less inhibitory activity compared to other extracts against both Gram-positive and Gram-negative bacteria. None of the extracts showed inhibitory activity against fungal species Aspergillus flavus and Candida albicans.
Table 4 Antimicrobial activity of the different extracts of C. equistefolia needles against Staphylococcus aureus (ATCC 12600) and Bacillus subtilis (ATCC 6051) were used as Gram-positive bacteria; Escherichia coli (ATCC 11775) and Pseudomonas aeruginosa (ATCC 10145) were used as Gram-negative; Candida albicans (ATCC 7102) and Aspergillus flavus (ATCC 9643) were used as fungal speciesFig. 4
Different C. equistefolia extracts were tested using a modified Kirby-Bauer disc diffusion method for their antimicrobial effects against Gram-positive bacteria like Staphylococcus aureus (ATCC 12600) and Bacillus subtilis (ATCC 6051), as well as Gram-negative bacteria like Escherichia coli (ATCC 11775) and Pseudomonas aeruginosa (ATCC 10145) and Candida albicans (ATCC 7102)
Cytotoxic activityThe resulting IC50 values, presented in Table 5, reveal that these extracts displayed an inhibitory effects on the viability of the two cell lines at different concentrations. As the IC50 values decreased, the inhibitory activity of the extracts increased. Notably, the methanol extract (10 CE) exhibited the most potent cytotoxic effect on both cell lines, with the lowest IC50 values recorded at 3.68 µg/mL and 5.59 µg/mL for HepG-2 and HCT-116, respectively, that should be recommended for further clinical studies. The chloroform extract (7 CE) displayed high cytotoxic activity on both the HepG-2 and HCT-116 cancer cell lines, with low IC50 values of 11.2 µg/mL and 14.6 µg/mL, respectively.
Table 5 Cell Viability Inhibition (IC50 ± S.D., µg/mL) of different extracts on HepG-2 (liver carcinoma cell line) and HCT-116 (colon carcinoma cell line)The ethyl acetate extract (8 CE) showed moderate cytotoxic activity on both cell lines, with IC50 values of 15.3 µg/mL and 27.5 µg/mL for HepG-2 and HCT-116, respectively. The butanol extract (9 CE) exhibited the least cytotoxic activity on both cell lines, with IC50 values of 28.9 µg/mL and 44.5 µg/mL for HepG-2 and HCT-116, respectively.
In contrast, the hexane extract (12 CE) displayed minimal cytotoxic activity on both the HepG-2 and HCT-116 cancer cell lines, with IC50values of 204 µg/mL and 153 µg/mL, respectively. Similarly, the mother liquor fraction (11 CE) exhibited feeble cytotoxic activity against both cell lines, with IC50values of 239 µg/mL and 208 µg/mL for HepG-2 and HCT-116, respectively.
Table 6 presents the results of this study, demonstrating the inhibitory impact of the different extracts against HepG-2 cell line. The chloroform extract (7 CE), ethyl acetate extract (8 CE) and butanol extract (9 CE) from C. equistefolia showed 98.03%, 97.46% and 96.18% inhibition of the HepG-2 cells respectively, as shown in Fig. 5, which illustrate the relationship between sample concentrations and cell viability, revealing a gradual reduction in cell viability as the extract concentration increases.
Table 6 Inhibition of HepG-2 cells by chloroform extract (7 CE), ethyl acetate extract (8 CE) and butanol extract (9 CE) of C. equistefoliaFig. 5
Inhibition of HepG-2 cells by chloroform extract (7 CE), ethyl acetate extract (8 CE) and butanol extract (9 CE) of C. equistefolia. A represents the relationship between sample concentrations vs the cell viability, and the relationship between sample concentrations vs the inhibitory percentages, and (B) represents the relationship between sample concentrations vs the standard deviations
The results of this study, as presented in Table 7, provide evidence of the inhibitory effects of the methanol extract (10 CE), mother liquor (11 CE) and hexane extract (12 CE) of C. equistefolia on HepG-2 cells in comparable with the standard vinblastine sulfate. The methanol extract (10 CE), from C. equistefolia showed 98.57% inhibition of the HepG-2 cells as shown in Fig. 6. The mother liquor (11 CE) and hexane extract (12 CE) of C. equistefolia on HepG-2 cells displayed 73.62% and 80.38% inhibition of the HepG-2 cells respectively, as shown in Fig. 7.
Table 7 Inhibition of HepG-2 cells by methanol extract (10 CE), mother liquor (11 CE), hexane extract (12 CE) of C. equistefolia and standard vinblastine sulfateFig. 6
Inhibition of HepG-2 cells by methanol extract (10 CE) of C. equistefolia. A represents the relationship between sample concentrations vs the cell viability, and the relationship between sample concentrations vs the inhibitory percentages, and (B) represents the relationship between sample concentrations vs the standard deviations
Fig. 7
Inhibition of HepG-2 cells by mother liquor (11 CE), hexane extract (12 CE) and standard vinblastine sulfate of C. equistefolia. A represents the relationship between sample concentrations vs the cell viability, and the relationship between sample concentrations vs the inhibitory percentages, and (B) represents the relationship between sample concentrations vs the standard deviations
The findings suggest that the feeble potential inhibitory effects of mother liqour (11 CE) and hexane extract (12 CE) of C. equistefolia on HepG-2 cells (Table 7, Fig. 7), in comparable with the standard vinblastine sulfate may hold promise as a potential inhibitor of HepG-2 cell proliferation, with increasing concentrations of the extract. Nonetheless, vinblastine sulfate is a well-known chemotherapeutic drug with documented efficacy against various cancer types, including liver cancer (Table 7, Fig. 7).
The results of this study demonstrated the inhibitory effects of the chloroform extract (7 CE), ethyl acetate extract (8 CE) and butanol extract (9 CE) of C. equistefolia on HCT-116 cells (Table 8). The chloroform extract (7 CE), ethyl acetate extract (8 CE) and butanol extract (9 CE) from C. equistefolia showed 97.85%, 96.33% and 95.64% inhibition of the HCT-116 cells respectively, as shown in Fig. 8, which illustrate the relationship between sample concentrations and cell viability, revealing a gradual reduction in cell viability as the extract concentration increases.
Table 8 Inhibition of of HCT-116 cells by chloroform extract (7 CE), ethyl acetate extract (8 CE) and butanol extract (9 CE) of C. equistefoliaFig. 8
Inhibition of HCT-116 ells by chloroform extract (7 CE), ethyl acetate extract (8 CE) and butanol extract (9 CE) of C. equistefolia. A represents the relationship between sample concentrations vs the cell viability, and the relationship between sample concentrations vs the inhibitory percentages, and (B) represents the relationship between sample concentrations vs the standard deviations
The results of this study, as presented in Table 9, provide evidence of the inhibitory effects of the methanol extract (10 CE), mother liquor (11 CE) and hexane extract (12 CE) of C. equistefolia on HCT-116 cells. The methanol extract (10 CE), from C. equistefolia showed 98.21% inhibition of the HepG-2 cells as shown in Fig. 9. The mother liquor (11 CE) and hexane extract (12 CE) of C. equistefolia on HCT-116 cells displayed 81.33% and 85.66% inhibition of the HCT-116 cells respectively, as shown in Fig. 10.
Table 9 Inhibition of HCT-116 cells by methanol extract (10 CE), mother liquor (11 CE), and hexane extract (12 CE) of C. equistefolia and standard vinblastine sulfateFig. 9
Inhibition of HCT-116 cells by methanol extract (10 CE) of C. equistefolia. A represents the relationship between sample concentrations vs the cell viability, and the relationship between sample concentrations vs the inhibitory percentages, and (B) represents the relationship between sample concentrations vs the standard deviations
Fig. 10
Inhibition of HCT-116 cells by mother liquor (11 CE), hexane extract (12 CE) and standard vinblastine sulfate of C. equistefolia. A represents the relationship between sample concentrations vs the cell viability, and the relationship between sample concentrations vs the inhibitory percentages, and (B) represents the relationship between sample concentrations vs the standard deviations
The findings suggest that the feeble potential inhibitory effects of mother liqour (11 CE) and hexane extract (12 CE) of C. equistefolia on HCT-116 cells (Table 9, Fig. 10), in comparable with the standard vinblastine sulfate.
留言 (0)