
記住我


Cardiovascular diseases constitute the leading cause of global mortality, with increasing prevalence due to the aging population worldwide and changes in lifestyle. The primary pathological basis for cardiovascular diseases is atherosclerosis.[1] Myocardial infarction (MI) is a chronic inflammatory disease that primarily affects medium and large arteries. Plaque formation results from a combination of factors, including endothelial injury, lipid infiltration, and smooth muscle cell proliferation and migration. The continuous progression and enlargement of plaques can cause arterial lumen narrowing or interruption of blood flow due to plaque instability and rupture, which are the main reasons for cardiovascular diseases. Currently, the primary treatments for atherosclerosis include the use of statin drugs to lower lipids and stabilize plaques, along with antithrombotic therapy. Therefore, further research into the pathogenesis and progression mechanisms of MI remains an urgent and challenging task.
Neutrophil extracellular traps (NETs) are considered a form of cell death mechanism, similar to apoptosis, pyroptosis, or necrosis, belonging to a unique type of cell demise.[2,3] NETs are extracellular net-like structures composed of neutrophil elastase, cathepsin G, and DNA-histone complexes, released upon neutrophil activation.[4] The formation process of NETs is referred to as NETosis. These net-like structures consist of chromatin filaments, with numerous proteins of various properties distributed along the filaments. These proteins originate from all types of neutrophil granules (i.e., azurophilic granules, specific granules, and tertiary granules), as well as neutrophil cytoplasm and cytoskeleton.[5,6] NETs have been found in thrombi and plaques at atherosclerotic vascular lesions, but their mechanism of action has not yet reached a consensus.[7,8]
Current bioinformatics methods are widely used for developing biomarkers related to diagnosis or prognosis, but considering the high false-positive rate caused by limited sample sizes, it may be challenging to obtain reliable results within single-chip data analyses.[9] Therefore, this study employs a bioinformatics multi-chip joint analysis approach to comprehensively search for transcriptional changes of NET-related genes in the blood of existing MI patients within the Gene Expression Omnibus (GEO) database. It also attempts to combine machine learning algorithms to judge and screen core genes while investigating specific enrichment pathways and immune infiltration mechanisms of related genes. By assessing risk factors in conjunction with correlations of clinical features, the aim is to unveil the molecular mechanisms involved in the pathological and physiological processes related to NETs in the development of MI. This exploration of potential biomarkers will provide theoretical references and scientific basis for the early diagnosis and targeted therapy of MI.
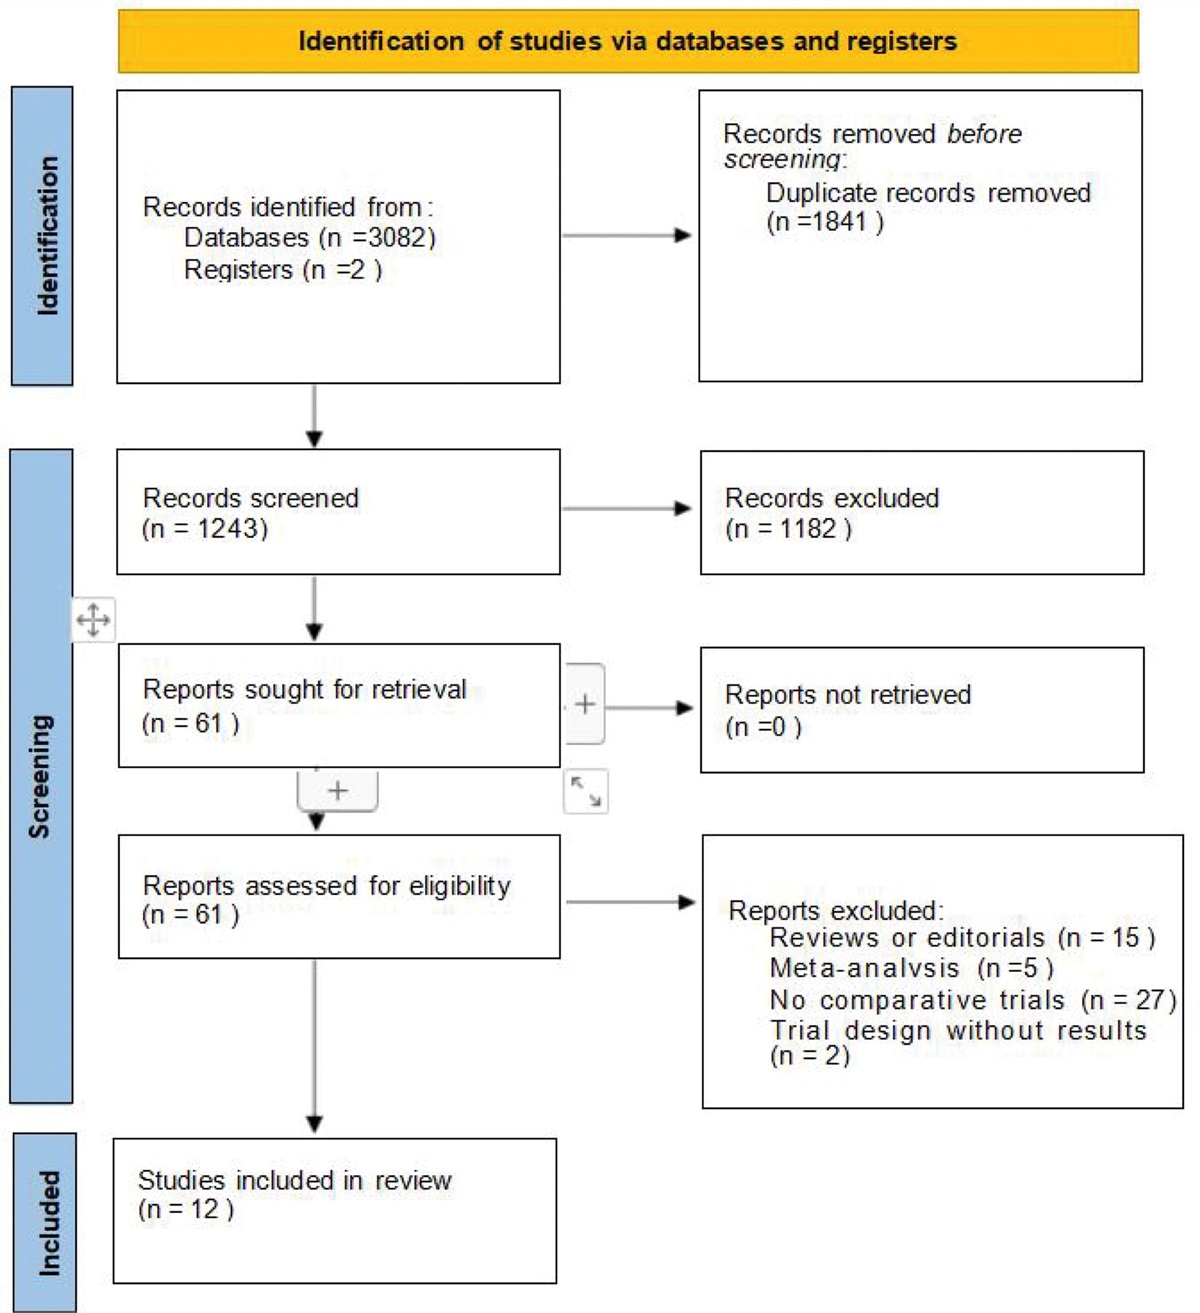
2. Method 2.1. Differential analysis of NETs-associated genesIn the initial phase of the study, we retrieved the GSE66360 and GSE48060 datasets relevant to early and late-stage carotid atherosclerosis investigations from the GEO database. GSE66360 was executed using the GPL570 [HG-U133_Plus_2] Affymetrix Human Genome U133 Plus 2.0 Array platform, comprising 49 control and 50 MI patient groups. Similarly, GSE48060, employing the GPL570 [HG-U133_Plus_2] Affymetrix Human Genome U133 Plus 2.0 Array platform, included 21 control and 31 MI patient groups. Following the acquisition of the datasets, we meticulously annotated the raw files based on the configuration files provided by their respective platforms, resulting in the creation of 2 gene expression matrix files. Subsequently, we processed and analyzed the raw data of pertinent genes using R software. The GSE66360 and GSE48060 datasets served as the training set, with GSE48060 employed as an independent validation set. Probes underwent standardization and filtering to exclude samples with nonexpressive probes, missing values, or multiple probes corresponding to a single gene. The identification of neutrophil-related NET genes was based on information from previously published studies.[10] Moreover, we conducted a differential analysis of NETs genes within the training set utilizing the limma package.
2.2. Machine learning model construction and validationMachine learning[11] is a field that investigates how computers emulate human learning processes for data analysis, presenting significant advantages over traditional methods, especially in handling high-dimensional, large-scale datasets. Four widely used machine learning algorithms – Random Forest (RF), Extreme Gradient Boosting (Xgboost, XGB), Generalized Linear Model (GLM), and Support Vector Machine-Recursive Feature Elimination (SVM-RFE) – are extensively applied for clinical variable selection.[12] By conducting multiple machine learning computations on differentially expressed genes, we identify feature genes most relevant to the disease. Subsequently, we formulate and validate a diagnostic model using external datasets.[12] To improve interpretability, we generate line charts based on disease-specific genes, facilitating the prediction of atherosclerosis occurrence. The reliability and practicality of the diagnostic model are further assessed through the examination of calibration curves, decision curve analysis (DCA), and clinical impact curves.[13]
2.3. Feature gene correlation and immune efficacyEmploy the “RCircos” tool for visualizing the relative positions of feature genes on chromosomes. Calculate the relative expression levels of the identified feature genes. The computational methodology utilized by CIBERSORT incorporates a gene expression-based deconvolution algorithm designed to assess genomic variation relative to other genes within the specimen.[14] By applying CIBERSORT, immune responses from 22 distinct immune cells are delineated, facilitating an evaluation of the association between these immune cells and key gene expressions in both normal and MI samples.
2.4. Biological effects of different NETs subtypesConduct a differential analysis and generate expression heatmaps for neutrophil-related NET genes based on subtype results obtained from K-means consensus clustering.[15,16] Employ the limma package to analyze variations in immune effects facilitated by different clusters, and utilize the GSVA package to assess distinctions in analyses mediated by these different clusters.
2.5. Weighted gene co-expression network analysis (WGCNA) and enrichment analysisConstruct a gene co-expression network using the “WGCNA” package in the R programming language.[17] Begin by meticulously selecting an appropriate weighting coefficient (β or soft threshold) to establish a scale-free co-expression network. Convert the correlation matrix into a topological overlap matrix using the chosen weighting coefficient, followed by the calculation of dissimilarity. Implement the dynamic pruning method for the initial division of modules, generating a gene dendrogram for modules with a size (N) greater than or equal to 30. Evaluate the node degree (k) of the co-expression network to identify key genes within different clusters. Conclude the analysis by applying the “clusterProfiler” package to conduct gene ontology[18] and Kyoto Encyclopedia of Genes and Genomes[19] pathway enrichment analyses, specifically focusing on neutrophil-related NET genes.
2.6. Mendelian randomization analysis of model gene expression and MI onsetExpression quantitative trait loci (eQTLs) are a type of genetic loci that can influence gene expression. Using the eQTLs of a gene as instrumental variables allows for the observation of phenotype changes mediated by gene expression variations. In this study, the eQTL data of the model gene and the genetic data of MI were both derived from the IEU Open GWAS database of the MRC Integrative Epidemiology Unit. This database primarily contains publicly accessible GWAS summary data. A GWAS of MI was searched for in the data, and considering sample size, sequencing depth, ethnicity, and data update time, the study selected the MI dataset with the ID “finn-b-I9_ATHSCLE” as the outcome data. In this research, a 2-sample MR method was adopted through R software, and the causal association between the eQTLs of each model gene and the onset of MI was validated using the IVW method,[20] weighted median (WM), simple median (SM), weighted median estimator (WME), and MR-Egger regression. Cochran Q test was employed to evaluate the heterogeneity of the results.[21] If P < .05, heterogeneity exists between single nucleotide polymorphisms (SNPs), and the causal inference was then conducted using the random effects model of IVW. To determine potential pleiotropy, an MR-Egger intercept test was performed in the end.[22] The P-value of the regression intercept was used to estimate the degree of horizontal pleiotropy effects, with P > .05 indicating no horizontal pleiotropy. Lastly, a leave-one-out sensitivity test was conducted to assess whether the combined IVW estimate was influenced by any individual SNP. If the MR results estimated by other instrumental variables after excluding a certain instrumental variable differ greatly from the total results, it indicates that the MR results are sensitive to this instrumental variable. Results are presented as odds ratios (OR) and 95% confidence intervals (95% CI), with P < .05 indicating statistically significant differences.
3. Results 3.1. Analysis of NETs-related gene differencesAfter eliminating batch effects from the 2 datasets and merging them, 68 NET-related genes were extracted. Through differential analysis, it was found that 47 NET genes exhibited expression differences between healthy individuals and MI patients (Fig. 1A and B).
 Figure 1.:
 (A) Heatmap of differential expression of NET genes in myocardial infarction patients. (B) Histogram of NET gene expression in the blood of healthy individuals and myocardial infarction patients. NET = neutrophil extracellular trap.
3.2. Machine learning model construction and validationUtilizing the expression levels of differentially expressed genes in NETs across various samples, 4 machine learning algorithms, including random forest and SVM, were employed to identify genes exhibiting distinct characteristics. These genes were selected as model genes for subsequent model construction. The residual box plot and the reverse cumulative distribution plot of residuals show that the error of SVM is smaller compared to the other 3 models (Fig. 2A and B). It is worth mentioning that the control group, model group, and overall error rate decrease with an increase in the number of training iterations (Fig. 2C). Moreover, the receiver operating characteristic curve indicates that SVM has a better diagnostic performance than the other 3 models (Fig. 2D and E).
 Figure 2.:
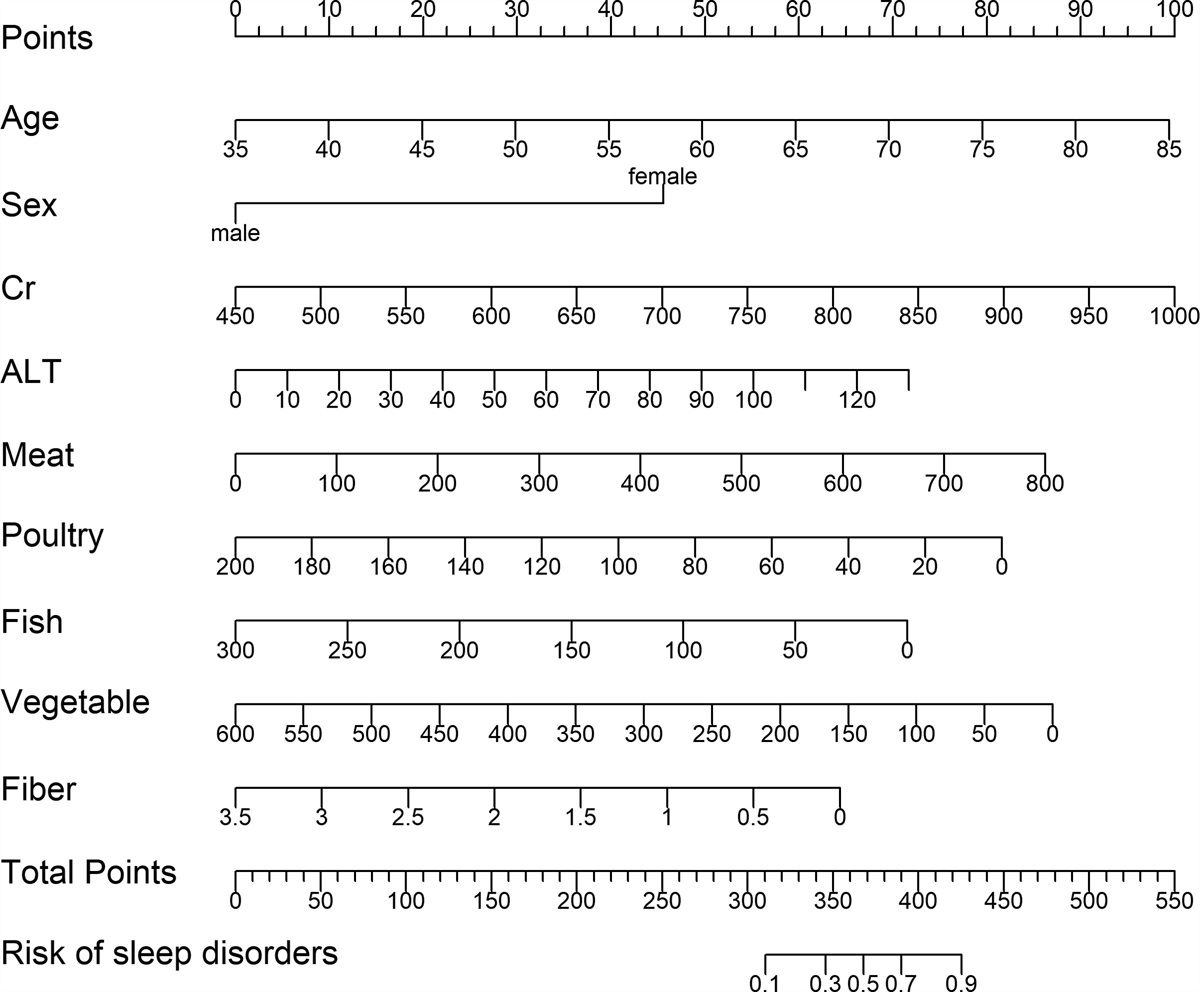
 (A) Residual box plot. (B) Feature distribution plot. (C) Inverse cumulative distribution residual plot. (D) Training set ROC curve. (E) Validation set ROC curve. (F) Calibration curve. (G) DCA evaluation curve. (H) Nomogram evaluation model. DCA = decision curve analysis, ROC = receiver operating characteristic.
Using importance values, 5 genes (ATG7, MMP9, interleukin 6 [IL6], DNASE1, and PDE4B) were chosen to construct a nomogram model for predicting the occurrence of atherosclerosis (Fig. 2H). These genes hold higher priority in the model. Stability and clinical impact of the model were assessed through calibration curves, DCA, and clinical impact curves. The calibration curve demonstrates relative stability (Fig. 2F). The consistently highest height of the red line in the DCA demonstrates that using the nomogram model to assess MI patients’ conditions is more beneficial (Fig. 2G). The clinical impact curve also displays a commendable prediction ability of the nomogram model (Fig. 3D).
 Figure 3.:
 (A) Distribution diagram of NET genes on chromosomes. (B) Gene correlation circle diagram. (C) Gene correlation heatmap. (D) Heatmap of the correlation between immune cells and NET genes. NET = neutrophil extracellular trap.
3.3. Correlation between feature genes and immune efficacyThe “RCircos” package was used to plot the positions of NET genes on chromosomes (Fig. 3A). Correlation analysis demonstrated strong relationships between NET-related genes (Fig. 3B and C). Specifically, MMP9 expression was positively correlated with ATG7 and PDE4B. High correlations were observed between MMP9, ATG7, and neutrophil infiltration (Fig. 3D).
3.4. Biological effects of different NET subtypesBased on the expression levels of NET genes, samples were divided into 2 clusters, C1 and C2 (Fig. 4A). From the heatmap of NET genes, it was found that the expression of proinflammatory genes such as ATG7, MMP9, and PDE4B was higher in cluster C1, suggesting that cluster C1 might have a worse prognosis (Fig. 4B). Compared to C1, cluster C2 displayed higher CD4 T cell infiltration but relatively lower neutrophil infiltration (Fig. 4C). Clusters C1 and C2 exhibited varying degrees of enrichment in pathways such as nitrogen metabolism, complement and coagulation cascades, cytokine-cytokine receptor interaction, renin-angiotensin system, and steroid biosynthesis (Fig. 4D).
 Figure 4.:
 (A) Classification matrix of NET genes. (B) Expression differences of NET genes between subtypes A and B. (C) Distribution differences of immune cells between subtypes A and B. (D) Gene enrichment differences between subtypes A and B.
3.5. WGCNA and enrichment analysisAfter mitigating batch effects in the 2 datasets and merging them, the study identified 68 NET-related genes. Differential analysis revealed that 47 of these genes exhibited significant expression discrepancies between healthy individuals and patients with MI (Fig. 5B and C). To explore the relationship between co-expression modules and clinical features, a heatmap illustrating the correlation between gene modules and clinical characteristics was generated (Fig. 5A). The numbers above the parentheses represent the correlation coefficients between the modules and sample traits, while the numbers inside the parentheses indicate the significance values (P value). Among the co-expression modules, the green module demonstrated the highest correlation with the NET subtype (cor = 0.56, P < .01). Kyoto Encyclopedia of Genes and Genomes pathway analysis revealed that the genes in the green module actively participated in the pathogenesis of AS by being enriched in several pathways, including NF-κB signaling pathway, cytokine-cytokine receptor interaction, hematopoietic cell lineage, TNF signaling pathway, lipid and atherosclerosis, and IL-17 signaling pathway. After mitigating batch effects and merging the 2 datasets, 68 NET-related genes were identified. Our differential analysis showed that 47 of these genes exhibited significant expression discrepancies between healthy individuals and patients with MI (Fig. 5B and C).
 Figure 5.:
 (A) Heatmap of gene module and clinical information correlations. (B) GO analysis of characteristic gene modules. (C) KEGG analysis of characteristic gene modules. GO = gene oncology, KEGG = Kyoto Encyclopedia of Genes and Genomes.
3.6. Mendelian randomization analysis of model gene expression and MI occurrenceThe results of the Mendelian randomization analysis suggest that only the eQTL of ATG7, among the genes involved in the model construction, has a causal relationship with the occurrence of MI (Fig. 6A and B). This implies that the expression of ATG7 is a primary risk factor for the onset of MI, while other model genes might merely be biological markers emerging post-MI. The forest plot displays the effect sizes of various SNPs in the eQTL of ATG7 (Fig. 6C). The scatter plot shows the regression trends of multiple methods, with most trends being consistent except for the Simple mode method (Fig. 6D). The funnel plot exhibits the distribution of causal effects (Fig. 6E). The leave-one-out analysis reveals the impact of individual nucleotide polymorphisms on the overall causal estimate (Fig. 6F). The MR-Egger-intercept analysis of ATG7’s eQTL detected no potential horizontal pleiotropy (P = .41), indicating that the instrumental variables do not significantly influence the outcome through pathways other than the exposure. In Cochran Q heterogeneity test, no significant heterogeneity was observed in ATG7’s eQTL (P = .31).
 Figure 6.:
 (A) Scatterplot of effect sizes for model genes. (B) Forest plot of Mendelian randomization results for ATG7 and MI. (C) Forest plot of eQTL effect sizes for ATG7. (D) Scatterplot of effect sizes for causal association from Mendelian randomization. (E) Funnel plot for causal relationship. (F) Leave-one-out plot to assess whether a single variant drives the association. eQTL = expression quantitative trait loci.
4. DiscussionNeutrophils are the most abundant immune effector cells in the innate immune system, and play an important role in defending against infections through phagocytosis, degranulation, and respiratory bursts.[23] In addition to these functions, they also have a unique impact on the pathophysiology of many cardiovascular diseases through a specialized form of cell death called NETosis.[24] It has been demonstrated that neutrophils can release web-like structures called NETs through NETosis, which are composed mainly of DNA, histones, neutrophil granule enzymes (such as MPO and NE), lysozymes, and antimicrobial peptides.[4] NETs are believed to play a significant role in the pathophysiology of cardiovascular diseases, particularly in light of recent research findings that demonstrate the presence of NETs in coronary artery thrombi of patients with ST-elevation myocardial infarction.[25] In addition to containing NETs, these thrombi also exhibit prothrombotic characteristics, such as platelet activation and coagulation cascade promotion. This discovery has drawn widespread attention in the medical and scientific communities due to its potential implications for understanding the complex processes underlying cardiovascular disease and identifying effective therapeutic strategies.[26,27]
This study had shown that NETs-related genes, such as ATG7, MMP9, IL6, DNASE1, and PDE4B, hold considerable diagnostic value in the development and progression of MI. ATG7, an E-1 enzyme, is involved in activating ubiquitin-like proteins and transforming them to E-2 enzymes, which impacts autophagosome formation and is associated with neutrophil membrane rupture.[28] MMP9, a member of the MMP family, is closely related to intravascular plaque instability. In unstable plaque regions, MMP9 expression levels are elevated, enzyme activity is significantly increased, and plaque rupture can be more easily induced.[29] MMP9 is essential for vascular smooth muscle cell proliferation and migration, playing a key role in the development and maintenance of fibrous caps, especially in late-stage plaques where MMP9 levels are significantly increased and associated with macrophage aggregation. These enzymes may promote plaque rupture by inducing intraplaque hemorrhage.[30] Research has reported that IL6 is highly expressed in atherosclerotic tissues, particularly in foam cells that have transformed after certain phagocytes engulf cholesterol particles.[31] IL6 is considered one of the risk factors for coronary artery disease, with its elevation potentially increasing the probability of MI.[32] While the role and mechanism of IL6 as an atherosclerotic marker or pathogenic factor in the development of coronary artery disease remain unclear, its correlation with carotid artery intima-media thickness has been confirmed in previous studies. In patients with coronary artery disease, serum IL6 levels increase with the severity of coronary atherosclerosis and are positively correlated, indicating that IL6 may be used for the assessment and evaluation of coronary artery atherosclerosis and its severity.[33] Phosphodiesterase 4 is known to directly degrade cAMP, thus participating in the regulation of cardiac functions.[34] Additionally, research suggests PDE4B plays a crucial role in enhancing neutrophil inflammation and microvascular dysfunction.[35] As such, these genes may have a significant impact on the development of MI and can be utilized for early diagnostics. Particularly, ATG7 manifests a strong causal relationship in the Mendelian randomization analysis associated with the occurrence of MI, potentially serving as a significant risk factor for MI.
NETs-related genes can also induce alterations in a variety of pathways, such as NF-κB signaling pathway, cytokine-cytokine receptor, hematopoietic cell lineage, TNF signaling pathway, lipid and atherosclerosis, and IL-17 signaling pathway. NF-κB activation is one of the initial mechanisms of vascular endothelial cell injury. Activation of NF-κB upregulates the expression of VCAM-1, ICAM-1, and ELAM-1 to mediate monocyte adhesion to endothelial cells and transmigration into the subendothelium; blocking the NF-κB signaling pathway can downregulate the expression of cell adhesion factors induced by cytokines.[36] Antigen expression of ICAM-1 and VCAM-1 can serve as a co-stimulatory signal for T lymphocytes, further inducing lymphocyte secretion of proinflammatory cytokines.[37] In addition, multiple cytokines and their receptors are involved in the development and progression of atherosclerosis.[38] TNF-α, a proinflammatory cytokine, is involved in cellular homeostasis and immune response regulation and has been found to play a pivotal role in the development of atherosclerosis.[39] TNF-α is produced by CD4+ T cells and myeloid cells. The progression of atherosclerosis is directly related to the increase of TNF-α in local plaques and the level of TNF-α in blood.[40] IL-17 is mainly secreted by Th17 cells, which can not only secrete proinflammatory cytokines such as IL6 but also proteases while also recruiting neutrophils, thus participating in the inflammatory process to a certain extent.[41] Elevated levels of IL-17 in peripheral blood are expressed in patients with acute coronary syndromes, suggesting that IL-17 plays a significant role in coronary atherosclerotic diseases.[42] The combined action of these factors can further induce lipid peroxidation stress and inflammatory responses, resulting in structural damage to endothelial cells, triggering inflammatory-fibroproliferative responses, impairing endothelial cell function, and participating in the initiation and progression of coronary atherosclerosis.[43,44]
5. ConclusionIn summary, this study employed bioinformatics methods to reveal a close relationship between NETs and atherosclerosis and related immune responses. Moreover, 5 potential genes involved in the pathogenesis of atherosclerosis were identified: ATG7, MMP9, IL6, DNASE1, and PDE4B. It is proposed that these genes could serve as potential targets for future research on the molecular mechanisms and treatment of atherosclerosis.
AcknowledgmentsWe thank the authors who provided the GEO public datasets.
Author contributionsConceptualization: Meng Sheng.
Writing – original draft: Meng Sheng, Xueying Cui.
Writing – review & editing: Meng Sheng.
References [1]. Francula-Zaninovic S, Nola IA. Management of measurable variable cardiovascular disease’ risk factors. Curr Cardiol Rev. 2018;14:153–63. [2]. Hellebrekers P, Vrisekoop N, Koenderman L. Neutrophil phenotypes in health and disease. Eur J Clin Invest. 2018;48:e12943. [3]. Kenny EF, Herzig A, Krüger R, et al. Diverse stimuli engage different neutrophil extracellular trap pathways. Elife. 2017;6:e24437. [4]. Brinkmann V, Reichard U, Goosmann C, et al. Neutrophil extracellular traps kill bacteria. Science. 2004;303:1532–5. [5]. Lehman HK, Segal BH. The role of neutrophils in host defense and disease. J Allergy Clin Immunol. 2020;145:1535–44. [6]. Khan MA, Ali ZS, Sweezey N, et al. Progression of cystic fibrosis lung disease from childhood to adulthood: neutrophils, Neutrophil Extracellular Trap (NET) Formation, and NET Degradation. Genes (Basel) 2019;10:183. [7]. Döring Y, Manthey HD, Drechsler M, et al. Auto-antigenic protein-DNA complexes stimulate plasmacytoid dendritic cells to promote atherosclerosis. Circulation. 2012;125:1673–83. [8]. Knight JS, Luo W, O’Dell AA, et al. Peptidylarginine deiminase inhibition reduces vascular damage and modulates innate immune responses in murine models of atherosclerosis. Circ Res. 2014;114:947–56. [9]. Hunt GP, Grassi L, Henkin R, et al. A webserver for gene expression analysis and visualisation. Nucleic Acids Res. 2022;50:W367–74. [10]. Li R, Jiang X, Wang P, et al. Prognostic value of neutrophil extracellular trap signature in clear cell renal cell carcinoma. Front Oncol. 2023;13:23. [11]. Erickson BJ. Basic artificial intelligence techniques: machine learning and deep learning. Radiol Clin North Am. 2021;59:933–40. [12]. Iasonos A, Schrag D, Raj GV, et al. How to build and interpret a nomogram for cancer prognosis. J Clin Oncol. 2008;26:1364–70. [13]. Le Thi HA, Le HM, Phan DN, et al. Stochastic DCA for minimizing a large sum of DC functions with application to multi-class logistic regression. Neural Netw. 2020;132:220–31. [14]. Chen B, Khodadoust MS, Liu CL, et al. Profiling tumor infiltrating immune cells with CIBERSORT. Methods Mol Biol. 2018;1711:243–59. [15]. Brière G, Darbo E, Thébault P, et al. Consensus clustering applied to multi-omics disease subtyping. BMC Bioinf. 2021;22:361. [16]. Wilkerson MD, Hayes DN. ConsensusClusterPlus: a class discovery tool with confidence assessments and item tracking. Bioinformatics. 2010;26:1572–3. [17]. Langfelder P, Horvath S. WGCNA: an R package for weighted correlation network analysis. BMC Bioinf. 2008;9:559. [18]. Gene Ontology Consortium. Gene Ontology Consortium: going forward. Nucleic Acids Res. 2015;43:D1049–56. [19]. Kanehisa M, Goto S. KEGG: kyoto encyclopedia of genes and genomes. Nucleic Acids Res. 2000;28:27–30. [20]. Burgess S, Dudbridge F, Thompson SG. Combining information on multiple instrumental variables in Mendelian randomization: comparison of allele score and summarized data methods. Stat Med. 2016;35:1880–906. [21]. Bowden J, Del Greco MF, Minelli C, et al. A framework for the investigation of pleiotropy in two-sample summary data Mendelian randomization. Stat Med. 2017;36:1783–802. [22]. Burgess S, Thompson SG. Interpreting findings from Mendelian randomization using the MR-Egger method. Eur J Epidemiol. 2017;32:377–89. [23]. Borregaard N. Neutrophils, from marrow to microbes. Immunity. 2010;33:657–70. [24]. Bonaventura A, Montecucco F, Dallegri F, et al. Novel findings in neutrophil biology and their impact on cardiovascular disease. Cardiovasc Res. 2019;115:1266–85. [25]. Metzler KD, Fuchs TA, Nauseef WM, et al. Myeloperoxidase is required for neutrophil extracellular trap formation: implications for innate immunity. Blood. 2011;117:953–9. [26]. Döring Y, Soehnlein O, Weber C. Neutrophils cast NETs in atherosclerosis: employing peptidylarginine deiminase as a therapeutic target. Circ Res. 2014;114:931–4. [27]. Castanheira FVS, Kubes P. Neutrophils and NETs in modulating acute and chronic inflammation. Blood. 2019;133:2178–85. [28]. Zhu J, Tian Z, Li Y, et al. ATG7 Promotes bladder cancer invasion via autophagy-mediated increased ARHGDIB mRNA stability. Adv Sci (Weinh). 2019;6:1801927. [29]. Brown BA, Williams H, George SJ. Evidence for the involvement of matrix-degrading metalloproteinases (MMPs) in atherosclerosis. Prog Mol Biol Transl Sci. 2017;147:197–237. [30]. Fiotti N, Altamura N, Orlando C, et al. Metalloproteinases-2, -9 and TIMP-1 expression in stable and unstable coronary plaques undergoing PCI. Int J Cardiol. 2008;127:350–7. [31]. Holte E, Kleveland O, Ueland T, et al. Effect of interleukin-6 inhibition on coronary microvascular and endothelial function in myocardial infarction. Heart. 2017;103:1521–7. [32]. Simon TG, Trejo MEP, McClelland R, et al. Circulating Interleukin-6 is a biomarker for coronary atherosclerosis in nonalcoholic fatty liver disease: results from the multi-ethnic study of atherosclerosis. Int J Cardiol. 2018;259:198–204. [33]. Hartl J, Serpas L, Wang Y, et al. Autoantibody-mediated impairment of DNASE1L3 activity in sporadic systemic lupus erythematosus. J Exp Med. 2021;218:e20201138. [34]. Epstein PM. Different phosphodiesterases (PDEs) regulate distinct phosphoproteomes during cAMP signaling. Proc Natl Acad Sci U S A. 2017;114:7741–3. [35]. Wan Q, Xu C, Zhu L, et al. Targeting PDE4B (phosphodiesterase-4 subtype B) for cardioprotection in acute myocardial infarction via neutrophils and microcirculation. Circ Res. 2022;131:442–55. [36]. Armengol Lopez S, Botham KM, Lawson C. The oxidative state of chylomicron remnants influences their modulation of human monocyte activation. Int J Vasc Med. 2012;2012:942512. [37]. Chen Z, Xu H. Anti-inflammatory and immunomodulatory mechanism of tanshinone IIA for atherosclerosis. Evid Based Complement Alternat Med. 2014;2014:1–6. [38]. Linder T, Liu R, Atanasov AG, et al. Leoligin-inspired synthetic lignans with selectivity for cell-type and bioactivity relevant for cardiovascular disease. Chem Sci. 2019;10:5815–20. [39]. Kalliolias GD, Ivashkiv LB. TNF biology, pathogenic mechanisms and emerging therapeutic strategies. Nat Rev Rheumatol. 2016;12:49–62. [40]. Fatkhullina AR, Peshkova IO, Koltsova EK. The role of cytokines in the development of atherosclerosis. Biochemistry (Mosc). 2016;81:1358–70. [41]. Wei Z, Spizzo I, Diep H, et al. Differential phenotypes of tissue-infiltrating T cells during angiotensin II-induced hypertension in mice. PLoS One. 2014;9:e114895. [42]. Erbel C, Dengler TJ, Wangler S, et al. Expression of IL-17A in human atherosclerotic lesions is associated with increased inflammation and plaque vulnerability. Basic Res Cardiol. 2011;106:125–34. [43]. Lai J, Akindavyi G, Fu Q, et al. Research progress on the relationship between coronary artery calcification and chronic renal failure. Chin Med J (Engl). 2018;131:608–14. [44]. Buccheri D, Zambelli G. The link between spontaneous coronary artery dissection and takotsubo cardiomyopathy: analysis of the published cases. J Thorac Dis. 2017;9:5489–92.
留言 (0)