
記住我
Atopic dermatitis (AD) is a common skin disease that usually begins during infancy. The lesions of AD are characterised by pruritic erythematous, papules, papulovesicles, and lichenification which may become excoriated and tend to have a flexural distribution such as the neck, cubital fossa, and popliteal fossa. AD generally occurs due to a combined effect of immune dysregulation, skin barrier dysfunction, alterations in the skin bacterial microbiome, and genetic factors.1 Genetic factors are very important in the pathogenesis of AD, which is supported by the facts that the concordance rate for AD is much higher in identical twins than in fraternal twins,2 AD patients or their first-degree relatives often have a history of atopic diseases, such as AD, allergic rhinitis, allergic conjunctivitis, asthma, food allergy, and eosinophilic esophagitis. Recent studies have shown that more than 70 genes may be related to the pathogenesis of AD.3
Recent data from both clinical trials and real-world studies indicate that dupilumab, a biological agent targeting interleukin 4 receptor-α is a very effective drug for the treatment of AD, emphasising the role of IL-13 and IL-4 in the pathogenesis.4 The objective of this study was to evaluate the association between IL-13, IL-4, and their receptor gene polymorphisms and the susceptibility to AD in a Chinese Han population.
Methods Study populationThe required sample size was calculated using the Raosoft sample size calculator,5 based on a significance level of 5%, confidence interval of 90%, population size of 2,00,000, and the prevalence of each mutation [Table 1]. Inclusion criteria were a confirmed diagnosis of AD based on Hanifin and Rajka criteria, absence of other skin diseases, and Chinese Han ethnicity. Patients with mixed ethnicities were excluded. All patients were enrolled from October 2021 to July 2022 in Xiamen Children’s Hospital. Healthy controls were enrolled from children undergoing a routine physical examination in the same hospital, and all of them had no personal and/or family history of AD, allergic rhinitis, asthma, and other allergic diseases based on the questionnaire and previous diagnoses. The study was approved by the Ethics Committee of Xiamen Children’s Hospital (Approval no. [2022]04) and all patients and controls signed informed consent before data collection.
Table 1: The required sample size calculated using Raosoft sample size calculator
SNP Minor allele Minor allele frequency Sample size required rs30913076 G 0.213 182 rs22546726 G 0.407 261 rs22657536 G 0.408 262 rs205416 A 0.360 250 rs18009257 T 0.215 183 rs22432508 T 0.165 149 rs22272848 T 0.341 243 rs18050118 C 0.173 155 rs18012759 G 0.188 166 rs18050109 G 0.500 271 rs6646259 A 0.500* 271 rs2243274 G 0.500* 271 Primer design, data collection, and genotypingBlood was collected from each patient and control and immediately stored at –80°C. We searched the website of The National Center for Biotechnology Information (NCBI) to identify Single Nucleotide Polymorphisms (SNPs) in IL-13, IL-4, and their receptor genes, reviewed relevant literature, and in total choose 12 SNPs from the four genes as listed, IL-13 -rs3091307, rs2054, and rs1800925, IL-13 receptor - rs2265753, rs6646259 and rs2254672, IL-4 - rs2243250, rs2227284 and rs2243274 and IL-4 receptor - rs1801275, rs1805010 and rs1805011. Genotypes of samples were detected by SNaPshot assay, polymerase chain reaction (PCR) primers used for amplification, and minisequencing primers used for SNaPshot reactions of the 12 gene regions as shown in Table 2.
Table 2: PCR primers used for the amplification and minisequencing primers used for the SNaPshot reactions of the 12 gene regions
PCR primers used for the amplification of the 12 gene regions Genes SNPs Primer sequence Product (bp) IL-4 rs2243250F: AAGGGCTTCCTTATGGGTAAGG
R:GCATCTTGGAAACTGTCCTGTC
208 rs2227284 F:CTGTCTGAGGAACAGCAAAGTG R:GAACTGCTTAGGGAGTGACTCA 386 rs2243274F:AAGGAGATTCTCACTCCGCATC
R:TCTCAGTCAGGTTCTGCTCTTG
345 IL-13 rs3091307F:AGATACAGAGGTGTTATAGTG
R:AGTTCCTGAGCATTCTTG
343 rs20541F:CTTCCGTGAGGACTGAATGAGA
R:CACAGGCTGAGGTCTAAGCTAA
360 rs1800925F:TGGGTAGGGGAGAAATCTTGAC
R:ACGTGTCTGGCCCCTTTAAT
360 IL-4R rs1805010F:ATCTGTCCTCACATCCGTGATC
R:CTTCCTCCTGCTGTTGCTATGA
393 rs1805011F:AGATCAGCAAGACAGTCCTCTG
R:AGGAACAGGCTCTCTGTTAGC
202 rs1801275F:AGAGTCCAGACAACCTGACTTG
R:CTTGAGAAGGCCTTGTAACCAG
394 IL-13R rs2265753F:CATTTGAGGAGAGACTCCCAGT
R:CCAAGTCAGTTCTTCACTCAGC
329 rs6646259F:AGCCTGGACCTCTATTACTCCT
R:TCGTTGAAGAGGCTGTTGGT
356 rs2254672F:GTCATCATTCCCTTCGACAGC
R:GGCCTAGCACAAACCAAAGAC
257 Minisequencing primers used for the SNaPshot reactions of the 12 gene regions Genes SNPs Primer sequence IL-4 rs2243250 TTTTTTTTTTTTTTTTTTTTTTTTTTCACCTAAACTTGGGAGAACATTGT rs2227284 TTTTTTTTTTTAGCTCTCTTTGGTAAATAGGAAAT rs2243274 TTTTTTTTTTTTTTTTAAAATGTCTTAGCTCCTCACTTGG IL-13 rs3091307 TTTTTTTTTTTTTTTTTTTTGTTTGTGTTTATTCCATTGTTTTCA rs20541 TTTTTTTTTTTTTTTTTTTTTTTTTTTTGCTTTCGAAGTTTCAGTTGAAC rs1800925 TTTTTTTTTTTTTTTTTTTTCCTTTTCCTGCTCTTCCCTC IL-4R rs1805010 TTTTTTTTTTTTTTTTTTTTTTTTTTTTTTTTTTTTCCTCCGTTGTTCTCAGGGA rs1805011 TTTTTTTTTTTTTTTTTTTTTTTTTTTTTTTTTTTTTTTTGACTTCCAGGAGGGAAGGG rs1801275 TTTTTTTTTTTTTTTTTTTTTTTTTTTTTTTTCCCCCACCAGTGGCTATC IL-13R rs2265753 TTTTTTTTTTTTTTTTTTTTTTTTTTTTGCCATGGCCTGCGTGAT rs6646259 TTTTTTTTTTTTTTTTTTTTTTTTTTTTTTGTTGTCGCGGACACTCCATA rs2254672 TTTTTTTTTTTTTTTTTTTTTTTTTTTTTTTTTTTCCACTGCCCCTAACAGCCTA Statistical analysisSPSS 21.0 software was applied to analyse all the experimental data. The age of the patients and controls were analysed by Student’s t-test. The gender of the two groups and the deviation of Hardy–Weinberg equilibrium (HWE) were analysed by the chi-square test. Differences in allelic frequency and genotypic distribution including dominant, codominant, over dominant, and recessive genetic models between AD patients and healthy controls were evaluated using logistic regression analyses, and the odd ratios (OR) with the 95% confidence interval (95% CI) were obtained accordingly.
ResultsWe enrolled 130 patients with AD (64 males and 66 females, mean age 39.74 ± 31.49 months) and 141 healthy controls (72 males and 69 females, mean age 41.45 ± 29.68 months) less than 18 years of age. No significant differences were observed concerning gender and age between patients and controls (P > 0.05). All 271 samples were successfully genotyped for the selected 12 SNPs, and they did not deviate from the distribution of Hardy–Weinberg equilibrium [Table 3]. Representative electropherograms of the 12 SNPs are shown in Figure 1. Table 3 lists the minor allele frequency of the 12 SNPs with a 95% CI level. Table 4 lists the allele and genotype frequencies of the 12 SNPs in the AD patient group and the control group. There were no statistically significant differences between AD patients and controls in genotype and allele frequencies at SNPs of IL-13, IL-4, and IL-4 receptor genes. There were no statistically significant differences between AD patients and controls in allele frequencies at SNPs of the IL-13 receptor gene. There were statistically significant differences between AD patients and controls in genotype distribution at rs2265753, rs6646259, and rs2254672 of the IL-13 receptor gene (P all < 0.001). Subjects with CG at rs2265753, AG at rs6646259, and TG at rs2254672 had increased risks for AD (P all < 0.001), and subjects with GG at rs2265753, rs6646259, and rs2254672 had reduced risks for AD (P all < 0.001).
Table 3: Hardy–Weinberg equilibrium test and minor allele frequency with 95% CI level of the 12 SNPs
Hardy–Weinberg equilibrium test Minor allele frequency with 95% CI SNPs Genotype distribution χ2 P Minor allele Minor allele frequency 95% CI rs2265753 CC CG GG 4.08 0.13 G 0.446 0.385–0.507 48 48 34 rs6646259 AA AG GG 3.19 0.20 G 0.419 0.359–0.480 51 49 30 rs2254672 TT TG GG 4.97 0.08 G 0.423 0.363–0.484 52 46 32 rs3091307 AA AG GG 2.94 0.23 G 0.219 0.169–0.270 75 53 2 rs20541 GG AG AA 1.19 0.55 A 0.362 0.303–0.420 49 68 13 rs1800925 CC CT TT 0.63 0.73 T 0.188 0.141–0.236 84 43 3 rs2243250 TT CT CC 0.01 1.00 C 0.185 0.137–0.232 86 40 4 rs2227284 TT GT GG 0.27 0.87 G 0.131 0.090–0.172 99 28 3 rs2243274 AA AG GG 0.00 1.00 G 0.192 0.144–0.241 85 40 5 rs1801275 AA GA GG 0.24 0.89 G 0.169 0.123–0.215 91 34 5 rs1805010 GG GA AA 0.88 0.65 A 0.477 0.416–0.538 32 72 26 rs1805011 AA CA CC 0.25 0.99 C 0.073 0.041–0.105 112 17 1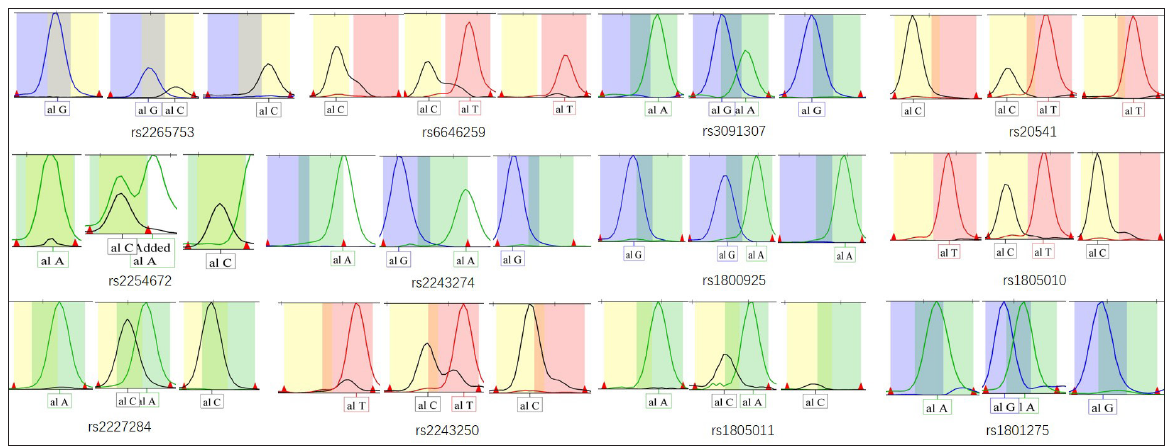
Export to PPT
Table 4: Genotypes and alleles frequencies of the 12 SNPs in AD patients and normal controls
SNP Genetic model Genotype/allele Patients N = 130(%) Controls N = 141(%) Logistic regression OR (95% CI) P value IL-13R rs2265753 Codominant CC 48 (36.9) 62 (44) 1 <0.001 CG 48 (36.9) 14 (9.9) 0.226 (0.112–0.457)) GG 34 (26.2) 65 (46.1) 1.480 (0.845–2.592) Dominant CC 48 (36.9) 62 (44) 1 0.238 CG+GG 82 (63.1) 79 (65.1) 0.746(0.458–1.214) Recessive CC+CG 96 (73.8) 76 (53.9) 1 0.001 GG 34 (26.2) 65 (46.1) 2.415 (1.447–4.031) Over dominant CC+GG 82 (63.1) 127 (90.1) 1 <0.001 CG 48 (36.9) 14 (9.9) 0.188 (0.098–0.363) Alleles C 144 (55.4) 138 (48.9) 1 0.133 G 116 (44.6) 144 (51.1) 1.295 (0.924–1.186) rs6646259 Codominant AA 51 (39.2) 66 (48.8) 1 <0.001 AG 49 (37.7) 13 (9.2) 0.205 (0.101–0.418) GG 30 (23.1) 62 (44.0) 1.597 (0.904–2.820) Dominant AA 51 (39.2) 66 (48.8) 1 0.208 AG+GG 79 (60.8) 75 (53.2) 0.734 (0.453–1.189) Recessive AA+AG 100 (76.9) 79 (56.0) 1 <0.001 GG 30 (23.1) 62 (44.0) 2.616 (1.545–4.428) Over dominant AA+GG 81 (62.3) 128 (90.1) 1 <0.001 AG 49 (37.7) 13 (9.1) 0.168 (0.086–0.329) Alleles A 151 (58.1) 145 (51.4) 1 0.120 G 109 (41.9) 137 (48.6) 1.309 (0.932–1.838) rs2254672 Codominant TT 52 (40) 63 (44.7) 1 <0.001 TG 46 (35.4) 13 (9.2) 0.233 (0.114–0.478) GG 32 (24.6) 65 (46.1) 1.677 (0.957–2.936) Dominant TT 52 (40) 63 (44.7) 1 0.436 TG+GG 78 (60.0) 78 (55.3) 0.825 (0.509–1.338) Recessive TT+TG 98 (75.4) 76 (57.6) 1 <0.001 GG 32 (24.6) 65 (42.4) 2.619 (1.559-–4.339) Over dominant TT+GG 84 (64.6) 128 (90.8) 1 <0.001 TG 46 (35.4) 13 (9.2) 0.185 (0.094–0.364) Alleles T 150 (57.7) 139 (49.3) 1 0.050 G 110 (42.3) 143 (50.7) 1.403 (0.999–1.969) IL-13 rs3091307 Codominant AA 75 (57.7) 91 (64.5) 1 0.139 AG 53 (40.8) 44 (31.2) 0.684 (0.414–1.132) GG 2 (1.5) 6 (4.3) 2.473 (0.485–12.610) Dominant AA 75 (57.7) 91 (64.5) 1 0.248 AG+GG 55 (42.3) 50 (35.5) 0.749 (0.459–1.223) Recessive AA+AG 128 (98.5) 135 (95.7) 1 0.176 GG 2 (1.5) 6 (4.3) 2.844 (0.564–14.351) Over dominant AA+GG 77 (59.2) 97 (68.8) 1 0.101 AG 53 (40.8) 44 (31.2) 0.659 (0.400–1.086) Alleles A 203 (78.1) 226 (80.1) 1 0.555 G 57 (21.9) 56 (19.9) 0.882 (0.583–1.336) rs20541 Codominant GG 49 (37.7) 64 (45.4) 1 0.434 AG 68 (52.3) 64 (45.4) 0.721 (0.435–1.194) AA 13 (10.0) 13 (9.2) 0766 (0.326–1.799) Dominant GG 49 (37.7) 64 (45.4) 1 0.199 AG+AA 81 (62.3) 77 (54.6) 0.728 (0.448–1.183) Recessive GG+AG 117 (90.0) 128 (90.8) 1 0.828 AA 13 (10.0) 13 (9.2) 0.914 (0.407–2.052) Over dominant AA+GG 62 (47.7) 77 (54.6) 1 0.255 AG 68 (52.3) 64 (45.4) 0.758 (0.470–1.222) Alleles A 94 (36.2) 90 (31.9) 1 0.298 G 166 (63.8) 192 (68.1) 1.208 (0.846–1.725) rs1800925 Codominant CC 84 (64.6) 94 (66.7) 1 0.938 CT 43 (33.1) 44 (31.2) 0.914 (0.547–1.527) TT 3 (2.3) 3 (2.1) 0.894 (0.176–4.548) Dominant CC 84 (64.6) 94 (66.7) 1 0.722 CT+TT 46 (35.4) 47 (33.3) 0.913 (0.553–1.508) Recessive CC+CT 127 (97.7) 138 (97.9) 1 0.920 TT 3 (2.3) 3 (2.1) 0.920 (0.182–4.643) Over dominant CC+TT 87 (66.9) 97 (68.8) 1 0.742 CT 43 (33.1) 44 (31.2) 0.918 (0.551–1.529) aAlleles C 211 (81.2) 232 (82.3) 1 0.737 T 49 (18.8) 50 (17.7) 0.928 (0.600–1.435) IL-4 rs2243250 Codominant TT 86 (66.1) 91 (64.5) 1 0.818 CT 40 (30.8) 45 (31.9) 1.063 (0.633–1.785) CC 4 (3.1) 5 (3.6) 1.575 (0.365–6.792) Dominant TT 86 (66.1) 91 (64.5) 1 0.780 CT+CC 44 (33.9) 50 (35.5) 1.074 (0.651–1.772) Recessive TT+CT 126 (96.9) 136 (96.4) 1 0.830 CC 4 (3.1) 5 (3.6) 1.158 (0.304–4.409) Over dominant CC+TT 90 (69.2) 96 (68.1) 1 0.839 CT 40 (30.8) 45 (31.9) 1.055 (0.631–1.763) Alleles C 48 (18.5) 55 (19.5) 1 0.757 T 212 (81.5) 227 (80.5) 0.934 (0.608–1.437) rs2227284 Codominant TT 99 (76.2) 115 (81.6) 1 0.382 GT 28 (21.5) 25 (17.7) 0.769 (0.421–1.404) GG 3 (2.3) 1 (0.7) 0.287 (0.029–2.803) Dominant TT 99 (76.2) 115 (81.6) 1 0.275 GT+GG 31 (23.8) 26 (18.4) 0.722 (0.402–1.298) Recessive GG 3 (2.3) 1 (0.7) 1 0.276 GT+TT 127 (97.7) 140 (99.3) 3.307 (0.340–32.199) Over dominant GG+TT 102 (78.5) 116 (82.3) 1 0.430 GT 28 (21.5) 25 (17.7) 0.785 (0.430–1.432) Alleles T 226 (86.9) 255 (90.4) 1 0.197 G 34 (13.1) 27 (9.6) 0.704 (0.412–1.203) rs2243274 Codominant AA 85 (65.4) 89 (63.1) 1 0.872 AG 40 (30.8) 45 (31.9) 1.074 (0.639–1.806) GG 5 (3.8) 7 (5.0) 1.337 (0.409–4.375) Dominant AA 85 (65.4) 89 (63.1) 1 0.698 AG+GG 45 (34.6) 52 (39.9) 1.104 (0.671–1.815) Recessive GG 5 (3.8) 7 (5.0) 1 0.655 AG+AA 125 (96.2) 134 (95.0) 0.766 (0.237–2.475) Over dominant AA+GG 90 (69.2) 96 (68.1) 1 0.568 AG 40 (30.8) 45 (31.9) 1.160 (0.697–1.932) Alleles A 210 (80.8) 223 (79.1) 1 0.624 G 50 (19.2) 59 (20.9) 1.111 (0.729–1.693) IL-4R rs1801275 Codominant AA 91 (70.0) 103 (73.1) 1 0.440 GA 34 (26.2) 36 (25.5) 0.935 (0.541–1.617) GG 5 (3.8) 2 (1.4) 0.353 (0.067–1.866) Dominant AA 91 (70.0) 103 (73.1) 1 0.578 GA+GG 39 (30) 38 (26.9) 0.861 (0.508–1.460) Recessive GG 5 (3.8) 2 (1.4) 1 0.208 GA+AA 125 (96.2) 139 (98.6) 2.780 (0.530–14.585) Over dominant AA+GG 96 (73.8) 105 (74.5) 1 0.907 GA 34 (26.2) 36 (25.5) 0.968 (0.562–1.668) Alleles A 216 (83.1) 242 (85.8) 1 0.379 G 44 (16.9) 40 (14.2) 0.811 (0.509–1.293) rs1805010 Codominant GG 32 (24.6) 33 (23.4) 1 0.473 GA 72 (55.4) 71 (50.4) 0.956 (0.532–1.719) AA 26 (20.0) 37 (26.2) 1.380 (0.686–2.775) Dominant GG 32 (24.6) 33 (23.4) 1 0.816 GA+AA 98 (75.4) 108 (76.6) 1.069(0.612–1.867) Recessive AA 26 (20.0) 37 (26.2) 1 0.224 GA+GG 104 (80.0) 104 (73.8) 0.703 (0.397–1.243) Over dominant GG+AA 58 (44.6) 70 (49.6) 1 0.407 GA 72 (55.4) 71 (50.4) 0.817 (0.507–1.318) Alleles G 136 (52.3) 137 (48.6) 1 0.386 A 124 (47.7) 145 (51.4) 1.161 (0.828–1.626) rs1805011 Codominant AA 112 (86.2) 120 (85.8) 1 0.964 CA 17 (13.1) 20 (14.2) 1.098 (0.547–2.202) CC 1 (0.7) 1 (0.0) 0.933 (0.058–15.101) Dominant AA 112 (86.2) 120 (85.8) 1 0.806 CA+CC 18 (13.8) 21 (14.2) 1.089 (0.552–2.150) Recessive CC 1 (0.7) 1 (0.0) 1 0.954 CA+AA 129 (99.3) 140 (100.0) 1.085 (0.067–17.530) Over dominant AA+CC 113 (86.9) 121 (85.8) 1 0.791 CA 17 (13.1) 20 (14.2) 1.099 (0.548–2.203) Alleles A 241 (92.7) 260 (92.9) 1 0.828 C 19 (7.3) 22 (7.1) 1.073 (0.567–2.032) DiscussionAs most patients with AD have eosinophilia and elevated serum total IgE, AD is currently considered to be a Th2 cells-mediated inflammatory disease. In the Th2 inflammatory process of AD, Th2 cells-derived cytokines, especially IL-4 and IL-13 play a crucial role because both can stimulate eosinophil recruitment and IgE production, and contribute to decreased antimicrobial peptide production, increase keratinocyte proliferation and impairment of skin barrier function.10
In most patients with AD, the serum total IgE level is significantly elevated. Therefore, IL-4 has long been considered the most critical cytokine involved in the pathogenesis of AD, because it plays a crucial role in the regulation of IgE synthesis. However, in recent years, strong evidence has shown that IL-13 is more important than IL-4 in AD inflammation.11–13
In recent years, advances in biologics also suggest that IL-13 plays a more important role than IL-4 in the pathogenesis of AD. As mentioned above, clinical and real-world data indicate that dupilumab which blocks the biological functions of both IL-4 and IL-13 has shown very good efficacy in the treatment of AD.4 Lebrikizumab and tralokinumab which blocks the biological function of IL-13 alone, have also shown promising efficacy in the treatment of AD,14,15 and tralokinumab has been approved by FDA for the treatment of moderate to severe AD in 2022.16 However, till date there is no evidence to prove that a biological agent that exclusively blocks IL-4 is effective in the treatment of AD.
In recent years, studies have increasingly focused on the relationship between genetic factors and susceptibility to AD. These studies have shown that more than 70 genes could be involved in the pathogenesis of AD, especially the filaggrin gene.3 Because IL-13 plays a crucial role in the pathogenesis of AD, the polymorphism of IL-13 and its receptor genes could be associated with the genetic susceptibility and severity of AD. In recent years, many researchers have shown that the SNPs of the IL-13 gene, such as rs20541, rs1800925, rs3091307, and rs1295685 are associated with AD. The association between rs20541 and AD susceptibility and total serum IgE level in a German population was reported by Liu et al.17 Lee et al. reported that rs20541 and rs1295685 of the IL-13 gene showed significant associations with AD risk and the total serum IgE level.7 The frequency of allele and genotypes of rs1800925 was found to be associated with the incidence and severity of AD, and total serum IgE level in Polish patients in the research of Gleń et al.18 In a research by Namkung et al., there were significant differences in the genotypic and allelic distributions of rs20541, rs3091307, rs2254672 and rs2265753 between AD patients and normal controls in a Korean population.6 In recent years, many studies have also shown that gene polymorphisms of IL-4 and IL-4 receptor are also related to AD susceptibilities, such as rs2243250, rs2243248, rs2243274 and rs2227284 of IL-4,19–21 and rs1805015, rs1805010, rs1805011 and rs1801275 of IL-4R.22–25
LimitationsThis was a single-centre and single-race study with a small sample size. We did not apply the Bonferroni correction in the present study to control the multiple comparisons.
ConclusionsThis study researched the association between the polymorphism of IL-4 and IL-13, and their receptor genes, and the genetic susceptibility of AD patients in a Chinese Han Population. The results suggested that the rs2265753, rs6646259, and rs2254672 of the IL-13 receptor gene are associated with susceptibility to AD. Subjects with CG at rs2265753, AG at rs6646259, and TG at rs2254672 had increased risks for AD, while patients with GG at rs2265753, rs6646259 and rs2254672 showed a protective effect. These findings may have a role in the development of future precision therapy and targeted drugs in the treatment of AD. Other functional SNPs of the IL-13 receptor gene need to be explored. Large-scale, multi-centric studies including patients from different ethnicities are required to further clarify the role of the IL-13 receptor gene in the pathogenesis of AD.
留言 (0)