This was a multicenter study conducted in three centers in the city of Medellín, Colombia (Hospital San Vicente Fundación, Hospital Mental de Antioquia, and Hospital Alma Máter de Antioquia). It complies with the Declaration of Helsinki and was approved by the Bioethics Committee of the School of Medicine of Universidad de Antioquia (Approval Act 016 of 2021) and by the participating institutions. All participants signed the informed consent form. The first stage consisted of translation, adaptation, and the pilot test, and the second stage was for the evaluation of psychometric properties.
Translation and adaptation
We obtained permission from the lead author (Dr. Luisa Weiner) to use the scale. The objective of this stage was to produce a Spanish version of the RCTQ-13 that would be linguistically and culturally equivalent to the original English version. The scale was translated and adapted following the translation and back-translation process. Initially, two translators independently translated the items from English to Spanish. The two translators and a review board consisting of three psychiatrists, a psychiatry resident, and a professor from the School of Languages reviewed both translations and agreed on a unified Spanish version of the instrument. This version was then translated back into English by two different translators who were not familiar with the original version of the scale. The review board and the translators compared both back-translations and resolved the inconsistencies to produce a single back-translated scale, which was then compared with the original. The found inconsistencies were modified until all board members agreed that the original and translated versions had identical meaning and content, only with the particularities specific to the Colombian population.
Pilot test
It was conducted on 14 subjects diagnosed with BD. The aim was determining the ease of administration of the questionnaire, the average time of administration, and the difficulties that could arise during answering. Afterwards, they were subjected to a cognitive interview as recommended by the International Society for Pharmacoeconomics and Outcomes Research (ISPOR) [12] to evaluate the comprehensibility, comprehensiveness, and relevance of the items, instructions, and response options. These interviews were recorded and transcribed verbatim for later analysis by the research team.
Validation stageParticipants
We included patients diagnosed with bipolar I disorder, in maniac or depressive episode or in full remission (considered euthymic), and patients with major depressive disorder following the criteria of the Diagnostic and Statistical Manual of Mental Disorders, Fifth Edition (DSM-5) [13], who were under inpatient and outpatient care in the participating institutions. Patients with cognitive impairment, intellectual disability, psychosis, and a level of education under 5 years were excluded. We calculated the sample size for each of the evaluated psychometric properties. We considered 250 people for internal consistency following Streiner’s recommendations [14] for scales with over 10 items, with an expected Cronbach’s alpha of 0.7 and a 95% confidence interval (95% CI) width of 0.1. We used the same number of patients for structural validity. We included 100 participants for the test-retest reliability, as recommended by De Vet [15] with an expected intraclass correlation coefficient (ICC) of 0.7 and a 95% CI width of 0.1. For convergent construct validity, we calculated a sample size of 55 people using the sample size formula for determining the correlation coefficient, with a type I error of 0.05, a type II error of 0.20, an alternative hypothesis correlation coefficient of 0.5 (as moderate correlations were expected with other related but not identical constructs), and a null hypothesis correlation coefficient of 0.2, as well as a one-tailed hypothesis test. For discriminant construct validity we included 63 patients in each group, calculating a sample size for the mean difference between independent groups, with a type I error of 0.05, a type II error of 0.2, an expected standardized mean difference of 0.5 and a 1:1 ratio of affected vs. unaffected [16]. For responsiveness, a sample size of 72 was calculated using the Hanley and McNeil formula [17] with an expected area under the ROC curve (AUROC) of 0.7, a type I error of 0.05, a type II error of 0.20, a null hypothesis AUROC of 0.5 and an expected 2:1 ratio between subjects who do not change and those who do.
Procedures
Each subject received information about the study, and they were asked to complete the questionnaire after signing the informed consent form. A subsample was newly administered the RCTQ-13 5 days after the first administration to evaluate test-retest reliability. To evaluate construct validity through hypothesis testing, a subsample of 55 people was administered the Young Mania Rating Scale (YMRS) [18], the Montgomery–Åsberg Depression Rating Scale (MADRS) [19], the Ruminative Response Scale (RRS) [20], the Penn State Worry Questionnaire (PSWQ) [21], and the State-Trait Anxiety Inventory (STAI) [22]. Discriminant validity was initially approached by comparing the RCTQ-13 scores of the following relevant patient groups: [1] with hypomanic episodes, [2] with manic episodes, 3) with manic episodes with mixed features [4] with depressive episodes, [5] with depressive episodes with mixed features, and [6] euthymic patients (in full remission). However, the hypomanic episode group was not included in the final analysis due to the small number of individuals (n = 3) and there were no patients with mania with the mixed symptoms specifier. Therefore, only the euthymia, mania, depression and depression with mixed symptoms groups were left in the final analysis. Classification into each of the groups was determined by an interview conducted by an experienced psychiatrist, using DSM-5 criteria and the results of the Young Mania Rating Scale and the Montgomery–Åsberg Depression Rating Scale. For determining responsiveness, we used a criterion-based approach using the Clinical Global Impression (CGI) rating scale as the reference standard [15]. The RCTQ-13 was administered a second time on a sample of 72 patients 4 weeks after the first administration with CGI for determining change.
Instruments
Short version of the Racing and Crowded Thoughts Questionnaire (RCTQ-13): 13-item self-report questionnaire that evaluates thought overactivity during the past 24 h [10]. The first 4 items belong to the thought overactivation subscale. The following 4 items belong to the burden of thought overactivation subscale, and the last 5 items correspond to the thought overexcitability subscale.
Young Mania Rating Scale (YMRS): it consists of 11 items, which are individually scored on a 5-option response scale corresponding to different degrees of severity of the mania. They are explicitly defined for each item [18]. For each item, the response options are rated with 0, 1, 2, 3, or 4 points. However, the five response options for items 5, 6, 8, and 9 are scored with double points. The final total score of the scale is obtained by adding up all the points, indicating the degree of severity of the patient’s manic state from least to most severe. The scale takes about 15-30 minutes to be administered, and the general recommendation is to mark the highest score applicable to the patient for each item. For this study, we used a cutoff score of > 5 points to determine whether a patient presents hypomania or mania. The scale is not validated for Colombia, but it has been validated in Spanish [18].
Montgomery-Åsberg Depression Rating Scale (MADRS): hetero-administered questionnaire consisting of 10 statements for major depressive episode diagnosis, which focuses on cognitive, affective, and somatic aspects. It has been validated in Spanish and for Colombia [19]. Additionally, 7 degrees of severity (0-6) are considered for each item, which associate the even values (0, 2, 4, 6) to statements. The scale allows for intermediate scores between two statements when it is uncertain which statement applies. The total score of the scale is obtained by adding the values selected for each item, with an interval of 0-60 points.
Ruminative Response Scale (RRS): it is a 22-item self-report questionnaire that evaluates two aspects of rumination during the last 7 days, including the past 24 h: “brooding” (5 items), which refers to the tendency for brooding and mood pondering, is related to a negative mood, and is considered to be maladaptive; and “reflection” (5 items), which refers to active efforts to understand one’s negative feelings, and is considered adaptative. The items are classified on a scale from 1 “almost never” to 4 “almost always.” It is validated for Colombia [20].
Penn State Worry Questionnaire (PSWQ): it is a measure of anxiety designed to evaluate the general tendency to experience worry [20]. It consists of 16 items to which participants respond according to a 5-point scale, ranging from 1 (“not at all typical of me”) to 5 (“very typical of me”). The possible range of scores is 16-80: 16-39 = low worry, 40-59 = moderate worry, and 60-80 = high worry. The questionnaire is currently validated for Colombia [21].
State-Trait Anxiety Inventory (STAI): instrument based on a theoretical model of anxiety as a state and as a trait [22]. State anxiety is a transient emotional condition characterized by consciously perceived subjective feelings of tension and apprehension, as well as by hyperactivity of the autonomic nervous system. Trait anxiety is a relatively stable personality attribute whereby subjects tend to perceive situations as threatening, consequently raising their anxiety level. The time frame of reference for state anxiety is “right now” (20 items) and was the one used in this study. Each subscale is made up of 20 items on a 4-point Likert scale system based on intensity (0 = almost never/not at all; 1 = somewhat/sometimes; 2 = moderately so/often; 3 = very much so/almost always). The total score in each subscale ranges from 0 to 60 points [21]. It is validated in Spanish and for Colombia [22].
Clinical Global Impressions (CGI) scale: it refers to the global impression of the patient and therefore requires clinical experience [23]. It is a descriptive scale that provides qualitative information regarding the severity of the condition and the change seen in the patient compared to the baseline state. It is comprised of two subscales that evaluate the severity of the condition and the improvement of the condition due to treatment. The notion of improvement refers to the distance between the patient’s current condition and the condition recorded at the start of the treatment. Both scales consist of a single item, which in this case was answered by a clinician who evaluated the patients at the time the scales were applied. It is validated in Spanish [23].
Statistical analysis
To describe the sociodemographic and clinical characteristics of the participating subjects, we used frequencies and percentages for qualitative variables, and medians and interquartile ranges for quantitative variables, since they did not present a normal distribution according to the Shapiro–Wilk test. We also determined the frequency of items with missing data and the frequency of use of each response option.
For structural validity, we conducted a confirmatory factor analysis (CFA) of the three-factor model proposed by the authors using the diagonally weighted least square mean and variance estimator (WLSMV) [11]. The following goodness-of-fit statistics were used: RMSEA (Root Mean Square Error of Approximation), CFI (Comparative Fit Index), TLI (Tucker-Lewis Index), and SRMSR (Standardized Root Mean Square Residual). The fit of the model was considered adequate if: RMSEA = 0.06-0.08 and CFI and TLI > 0.95 [24]. We also evaluated internal consistency using Cronbach’s alpha and McDonald’s omega [25] as well as the correlations between each item and the total score. Test-retest reliability was also determined by means of the ICC with a 95% CI. Also, the Bland–Altman plot was used to represent the limits of agreement between the two measurements for the total score and each factor.
Regarding construct validity through hypothesis testing, convergent validity was assessed by calculating the Spearman correlation coefficient of the RCQT-13 scores with item 7 of the YMRS, which assesses language-thought disorders; a moderate positive correlation was expected. For divergent validity, we calculated the Spearman correlation coefficient between RCTQ-13 and the MADRS, the state subscale of the STAI, and the PSWQ, expecting it to be low as they do not specifically include racing thoughts. While the statistical significance of the Spearman coefficients was calculated, the interpretation was primarily based on the strength of the association. Correlations with values greater than 0.6 are considered as “strong,” those falling between 0.30 and 0.60 are considered “moderate”, and any value below 0.30 suggests a low or weak correlation [26].
For discriminant validity, we compared total and subscale scores between the different patient groups using the Kruskal–Wallis test, as data distribution was not normal. Likewise, ordinal epsilon squared (ε2) was calculated for comparing 2 or more groups as a nonparametric effect size measure, with values interpreted as small (0.01-0.06), moderate (0.08-0.26), and large (≥0.26) [27]. Post-hoc pairwise comparison were performed after significant effects with Dunn test with multiple comparison adjustment with Bonferroni method. A level of statistical significance was defined as a p-value of less than 0.05.
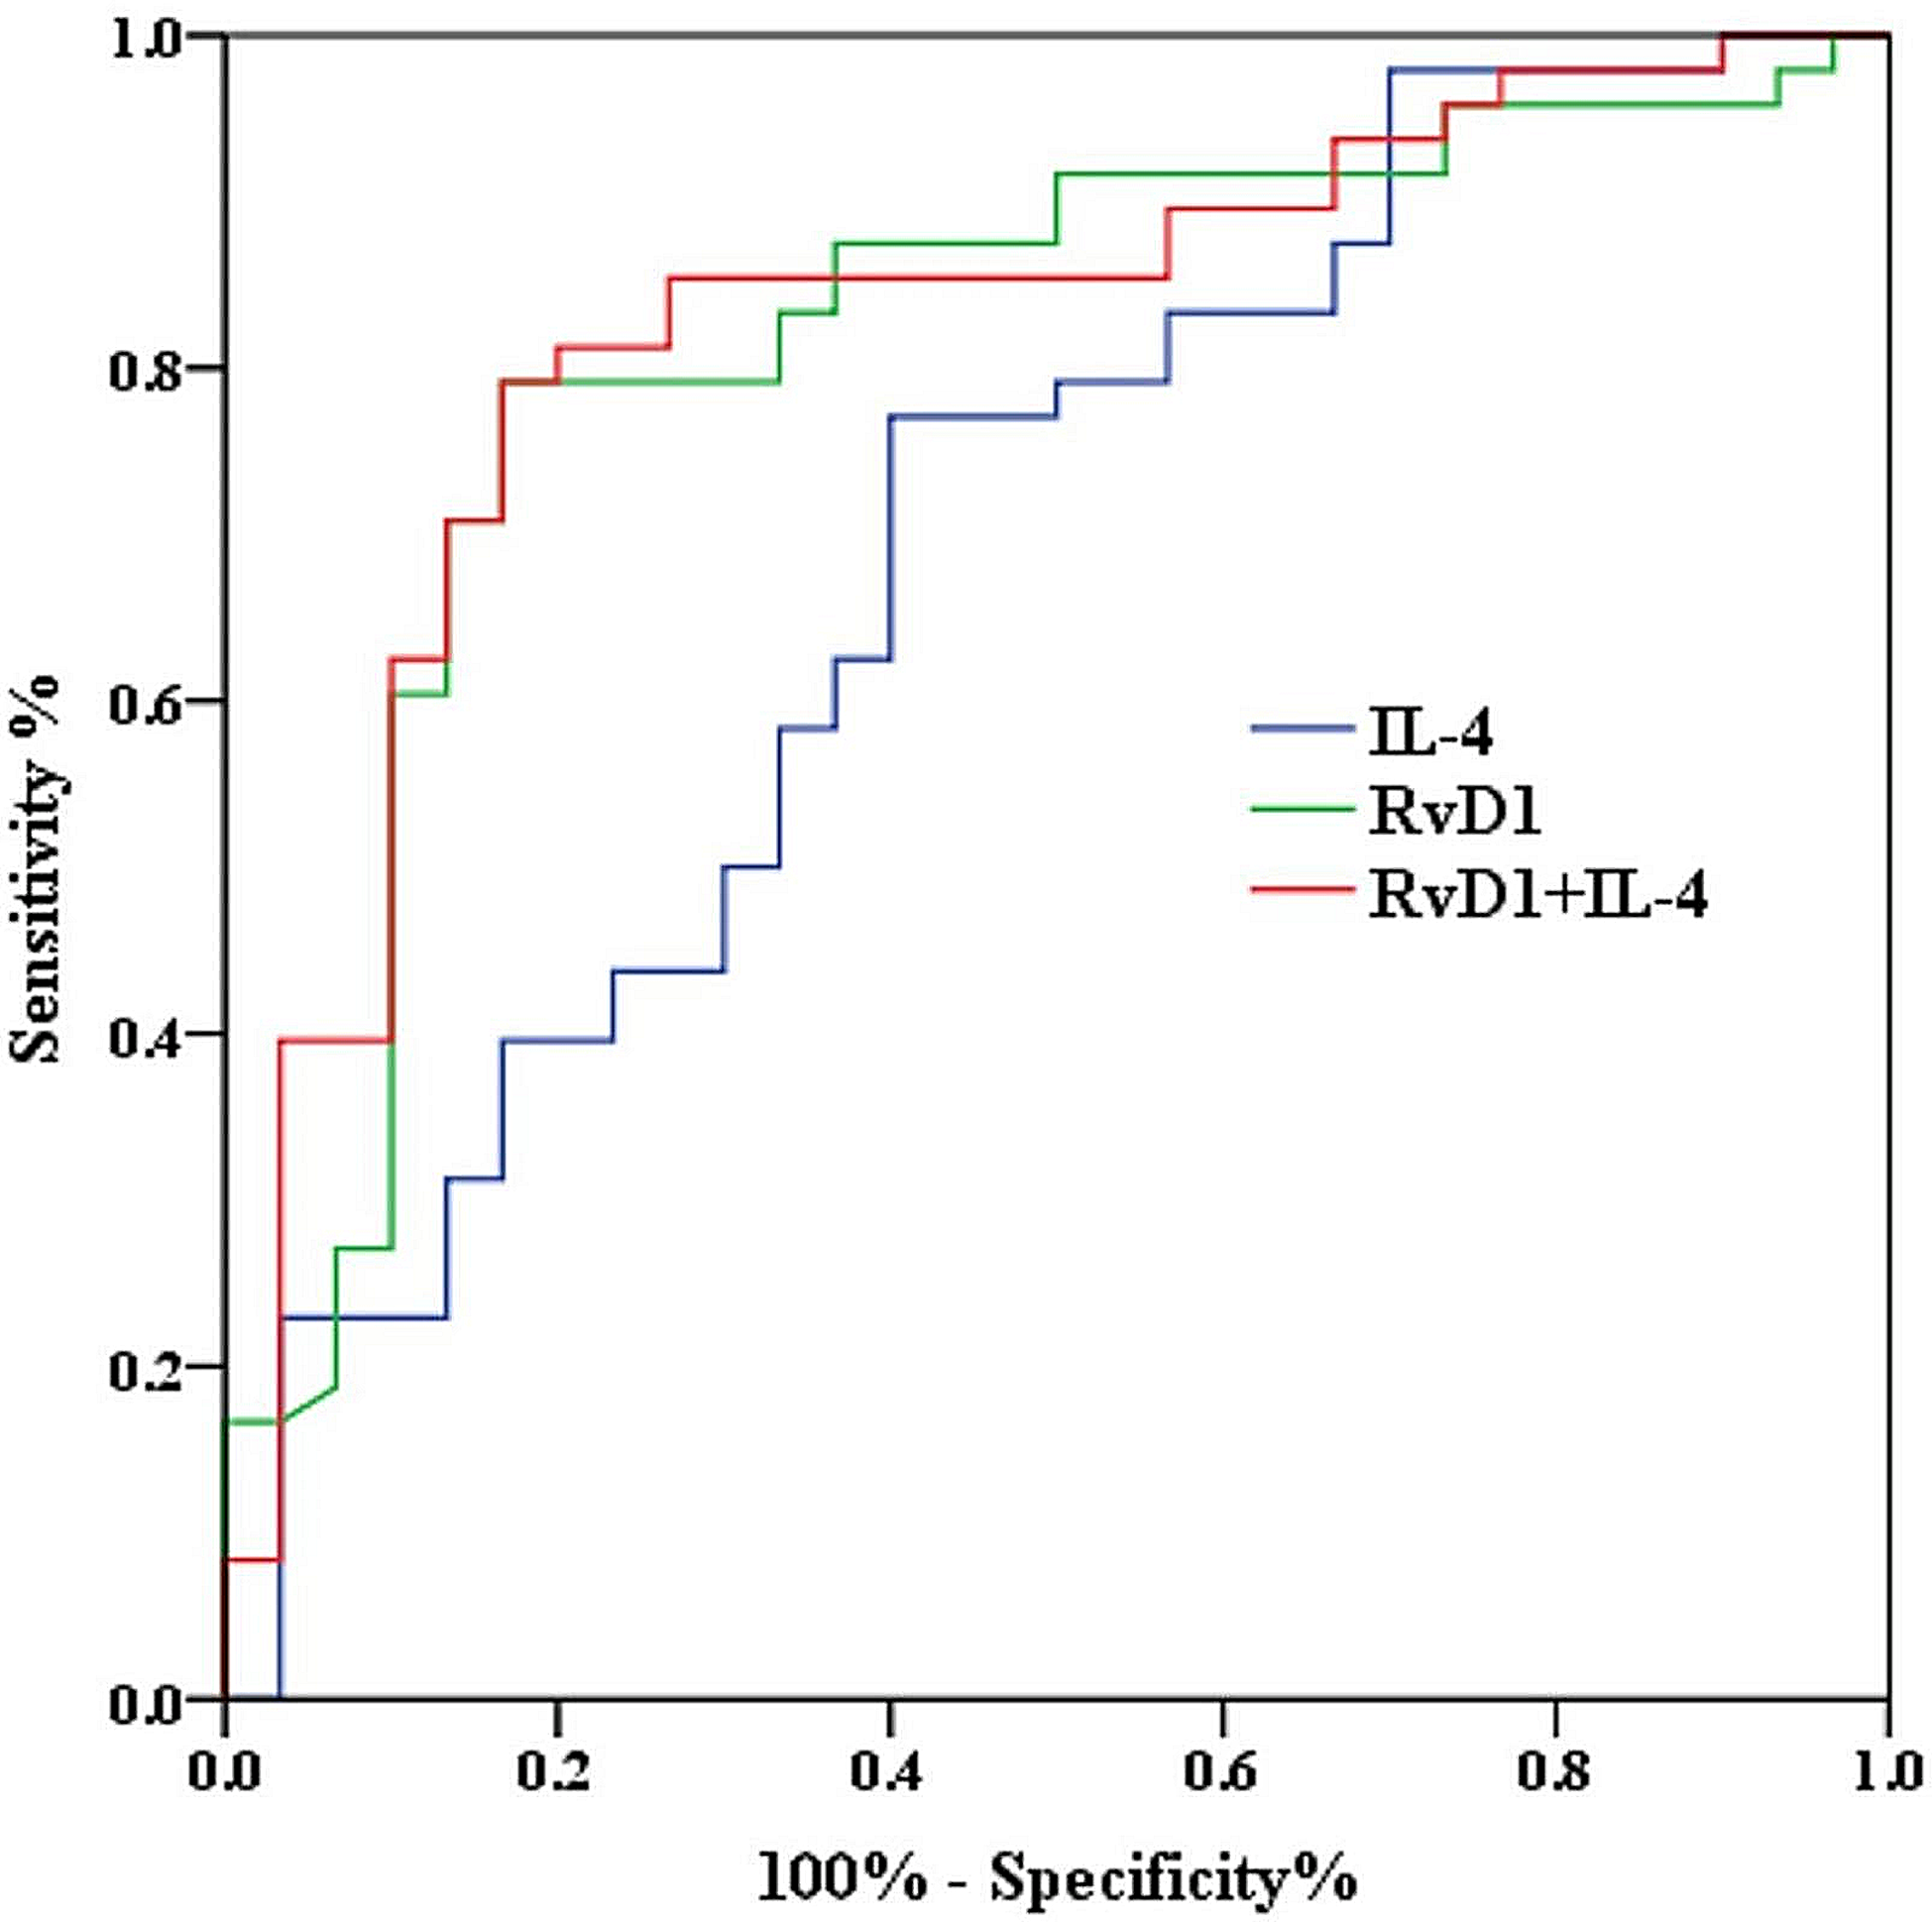
For responsiveness, we calculated the Spearman correlation coefficient between the change classification indicated in the CGI and the mean difference of the scores obtained in the two measurements of each RCTQ-13 subscale. In addition, the AUROC was calculated for the entire scale, using as a reference the presence of change; it was considered adequate if it presented values > 0.7 [17].
Item response theory was used to estimate the difficulty and discrimination for each item by applying a generalized partial credit model (GPCM) [28, 29]. The category characteristic curve (CCC) was also obtained for each item. The fit was evaluated for each item based on the values of the infit and outfit statistics, which were considered acceptable if they were between 0.5 and 1.5 [30].
The statistical analysis was conducted using Stata 15. For factor analysis and evaluation based on item response theory, we used R [31] and R Studio [32] with the lavaan [33] and ltm [34] packages, respectively.


留言 (0)