Study design and participants
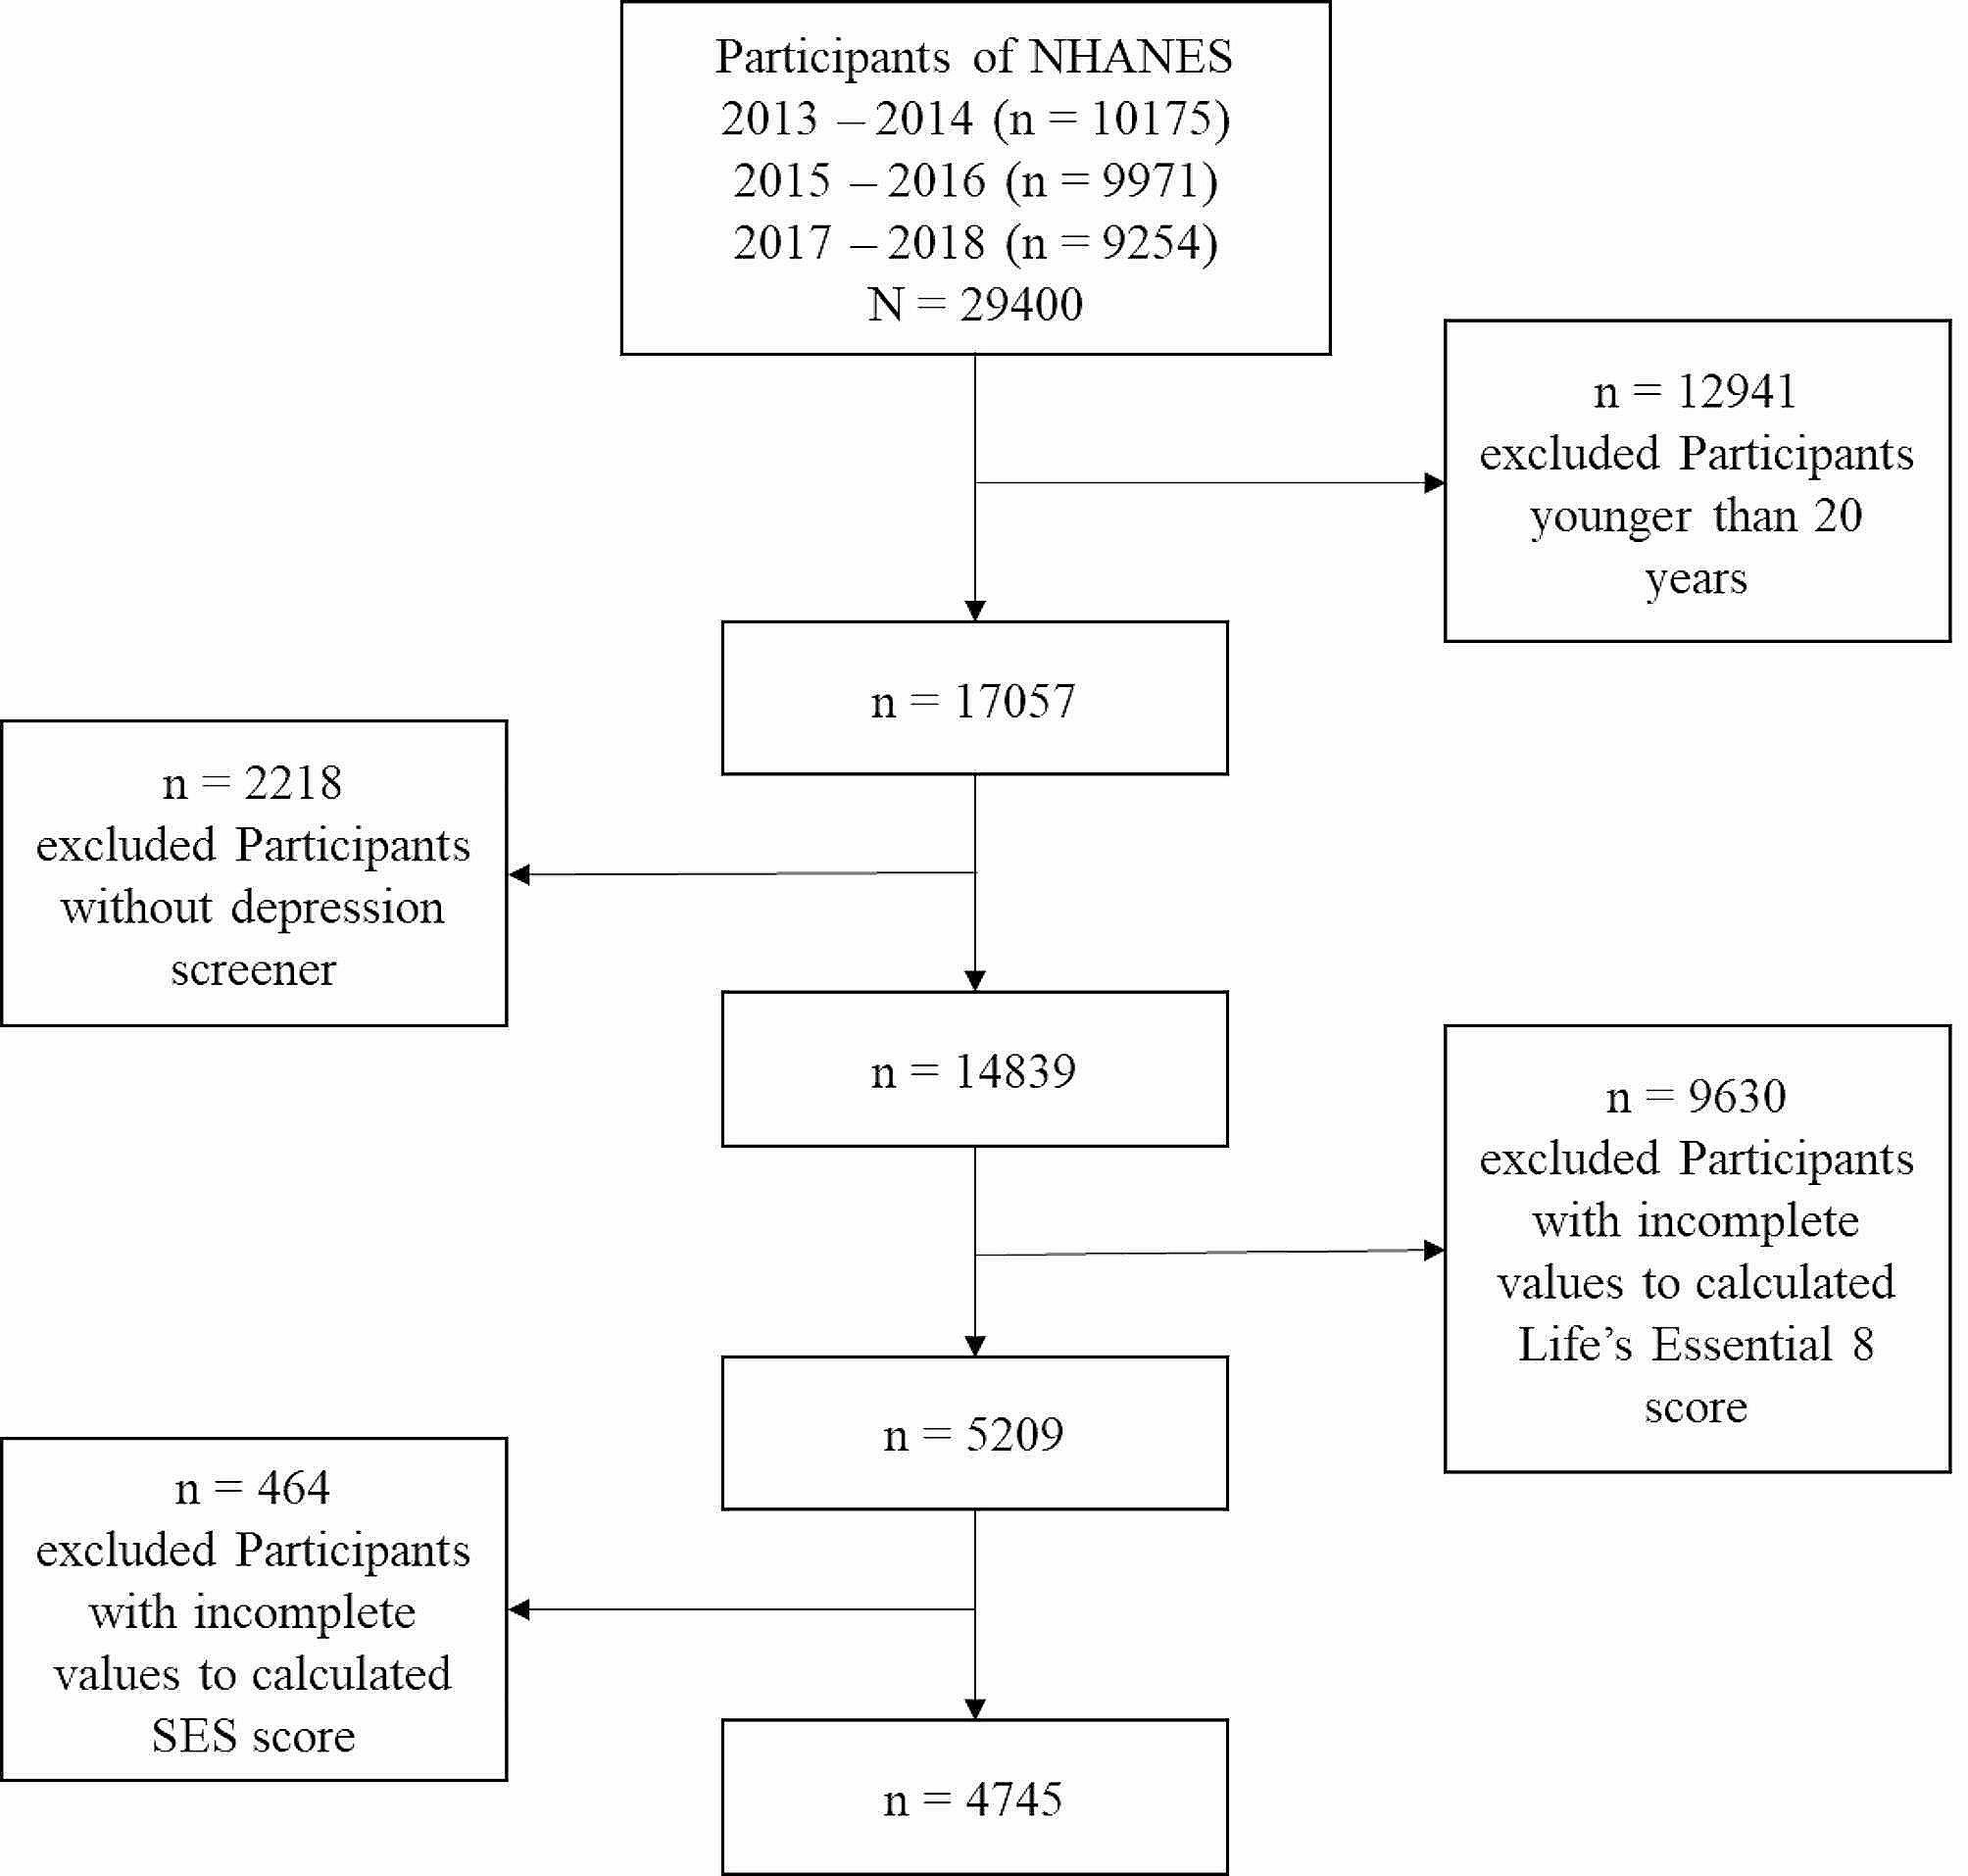
The participants included a random sample of U.S. adults aged ≥ 18 years who were recruited in a national anonymous online cross-sectional survey. The survey participants’ recruitment and distribution, sponsored by the National Institute of Health, were executed by Qualtrics LLC between May 13, 2021, and January 9, 2022. The survey was developed and conducted in English. Qualtrics LLC oversampled low-income and rural individuals within US-born White, Black, Hispanic, and foreign-born populations to enhance the study participants’ representativeness. The survey was distributed to 10,000 participants, and 5,938 of them completed the survey, with 5,413 participants providing valid responses. The invalid responses included data we were unable to ascertain or incomplete surveys. We conducted a complete case analysis; therefore, 5,140 individuals with complete cases were included in the analysis. We assessed the differences in the sociodemographic characteristics of the complete cases and those excluded from the analysis; we found no significant differences in their sociodemographic characteristics. Besides, we had only 5% missingness, which is less than the 10% missingness threshold to result in bias estimates [24,25,26]. The Patient Health Questionnaire-4 (PHQ-4) scale was used to assess anxiety and depression among the participants. The survey also assessed the participants’ sociodemographic characteristics and loneliness. Ethical approval was obtained for the study on December 23, 2020, from the National Institutes of Health’s Institutional Review Board ([IRB] #000308).
MeasuresMain outcomes
The PHQ-4 is a 4-item unipolar self-reported scale comprising the PHQ-2 and the GAD-2 subscales [12, 13]. The PHQ-2 items are: (1) little interest or pleasure in doing things and (2) feeling down, depressed, or hopeless. The GAD-2 items are: (1) feeling nervous, anxious or on edge and (2) not being able to stop or control worrying. The items are based on how often the participants have been bothered in the last two weeks, and the response options include not at all = 0, several days = 1, more than half the days = 2, and nearly every day = 3. The total PHQ-2 and GAD-2 scores range from 0 to 6, and the PHQ-4 total score ranges from 0 to 12 [12, 13]. Total scores of ≥ 3 on any of the scales indicate anxiety (GAD-2), depression (PHQ-2), and both anxiety and depression (PHQ-4) symptoms.
Exposures
The 3-item UCLA Loneliness scale (short version) was used to measure loneliness among our survey participants [23, 27, 28]. The participants were asked to respond to the following three questions: (1) How often do you feel that you lack companionship? (2) How often do you feel left out? and (3) How often do you feel isolated from others? The response options for each question include 1 = hardly ever, 2 = some of the time, 3 = often). The total possible scores range from 3 to 9 [23, 27, 28]. The previous studies provided evidence of the reliability (alpha values ranged from 0.72 to 0.91) and validity (r = 0.82) of the 3-item UCLA Loneliness scale (short version) [23, 27, 28]. We found a similar alpha value of 0.88 for our study’s 3-item UCLA Loneliness scale.
Existing studies found that sociodemographic characteristics such as age, nativity, race/ethnicity, sexual and gender identity, level of education, marital status, employment, and income are known risk factors for anxiety and depression [6, 13, 22, 29]. Hence, we included these sociodemographic characteristics in our study to evaluate their associations with the PHQ-4 scale and its subscales of PHQ-2 and GAD-2.
Statistical analysis
STATA/SE version 16 [30] and Mplus version 8.6 [31] were used to perform this study’s statistical analyses. STATA was used to conduct all the analyses, while both STATA and Mplus were used to conduct the one-factor and two-factor structure analyses. We analyzed the items’ frequency distributions and descriptive statistics for PHQ-4, PHQ-2, and GAD-2. We conducted summary statistics to determine each item’s means, standard deviations, skewness, and kurtosis. We used the skewness, kurtosis, quantile-quantile plot (Q-Q plot), and standardized normal probability or probability–probability plot (P-P plot) to examine the normality of the distributions. We also evaluated the items for missing data. Furthermore, we examined the internal consistencies of the PHQ-4, PHQ-2, and GAD-2 using Cronbach’s alpha (i.e., α) to determine their reliability [32, 33]. The alpha values of at least 0.70 are considered satisfactory or desirable [32,33,34]. Additionally, we computed the composite/construct reliability (also known as Jöreskog’s Rho) to test the composite reliability of the constructs [35, 36].
We examined the factorial validity and dimensionality of the PHQ-4 with confirmatory factor analysis (CFA). We evaluated the 2-dimensional structure (i.e., GAD-2 vs. PHQ-2) and a 1-dimensional structure (i.e., the PHQ-4 total score) of the PHQ-4 by examining two different factor models using the Maximum likelihood (ML) method, which is an effective and robust estimator in analysis involving large samples and normally distributed data [37]. We computed 95% confidence intervals (95% CIs) for the factor loadings. We assessed the two factors’ convergent and discriminant validities to evaluate their inter-correlation. Evidence of inter-correlation suggests convergent validity, while lack of evidence of or weak inter-correlation indicates discriminant validity [38,39,40,41]. We used average variance extracted (AVE) and squared correlations (SC) to determine the convergent and discriminant validities [38,39,40,41]. The AVE represents the average level of variance the latent constructs explain in their indicators relative to the total indicators’ variance or the amount of variance due to measurement error [38,39,40,41]. The AVE values greater than 0.50 (i.e., 50%) demonstrate evidence of convergent validity, further indicating that the latent construct explains more than 50% of the indicator variance [38,39,40,41]. There is evidence of discriminant validity when the AVE value is greater than or equal to the SC between the two latent constructs, further suggesting that the two latent constructs share more variance with their associated indicators than with their different sets of indicators in the model [38,39,40,41].
To examine the comparability of the factor structure of the PHQ-4 across native groups (US-born vs. foreign-born), we conducted a multiple-group confirmatory factor analysis (MCFA). We particularly evaluated the consistencies of the PHQ-4 scale for varying groups (i.e., US-born vs. foreign-born). Further, we examined and compared three increasingly restrictive models (i.e., configural, metric, and scale measurement invariance models) with the MCFA based on similar approaches used and recommended by other researchers [6, 29, 42].
We first examined configural measurement invariance by fitting a model (i.e., an unconstrained model) where all other parameters were freely estimated to determine whether the patterns of the factor loadings were the same in the two native groups or whether the model fits well equally in each of the two native groups. We then examined metric measurement invariance once the configural invariance was established. In this second model, factor loadings were constrained to be equal between the two groups. Once evidence of metric invariance was determined, the scalar measurement invariance (i.e., equal intercepts model) was examined by constraining the item intercepts and factor loadings. The metric measurement invariance model was compared with the configural measurement invariance, while the scalar invariance model was compared with the metric measurement invariance model. A non-significant test suggests the model under consideration fits the data just as well as the model estimated in the previous step of invariance testing.
Overall fit and model comparisons were evaluated using six criteria or indices. These indices include the Root Mean Square Error of Approximation (RMSEA), the Standardized Root Mean Residual (SRMR), the Comparative Fit Index (CFI), the Tucker-Lewis Index (TLI), and the likelihood ratio test (LRT). The RMSEA and SRMR values less than 0.08 suggest acceptable model fit, or values less than 0.05 indicate good model fit [6, 13]. Also, RMSEA values between 0.08 and 0.1 suggest marginal fits [6, 13, 43, 44]. The RMSEA was estimated at 95% CI. The CFI and TLI values greater than 0.95 indicate good model fit, while the values > 0.90 denote acceptable model fit [6, 13]. With the model comparisons, the LRT was used to compare a less restricted model (i.e., nested or simple model) to a more restricted model (i.e., complex or full model) with a statistically significant test suggesting a better fit of the more restricted model to the data than the less restricted model; otherwise, the more restricted model fits the data just as the less restricted model [45,46,47,48,49].
Analysis of variance (ANOVA) for at least three categories or groups and two-sample t-tests for two categories were used to assess the associations of sociodemographic characteristics with the PHQ-4 scale and its subscales of PHQ-2 and GAD-2. We performed the Bonferroni multiple-comparison test or Bonferroni adjustment for the ANOVA tests to account for multiple testing and determine which pairs of groups have significantly different scale scores. Additionally, we used Pearson’s correlation to assess the intercorrelations between the PHQ-4 scale, PHQ-2, and GAD-2 with the UCLA Loneliness scale - short version to determine the construct validity, specifically convergent validity. We computed the 95% CI for the Pearson’s correlation estimates.


留言 (0)