
記住我


The selection of the surgical approach for total hip arthroplasty (THA) in daily practice is determined by surgeon experience, training, and personal preferences1. The posterolateral approach (PLA) is the most frequently used technique for THA, although a shift to the direct anterior approach (DAA) is observed more recently2. The DAA is known to have a reduced revision risk for dislocation, early mobilization, and reduced hospital length of stay (LOS) compared with the PLA, but a higher risk of femoral-sided revision and a steep learning curve is reported3–7.
To decrease dislocation rates and improve the early recovery of patients undergoing the traditional PLA, the direct superior approach (DSA) was introduced. The DSA, a modification of the PLA, preserve the iliotibial band and short external rotators, excluding the piriformis and conjoint tendon8,9. It is hypothesized that the DSA may help reduce postoperative pain, intraoperative blood loss, and hospital LOS10–13. By contrast, it is hypothesized that minimally invasive THA may lead to increased risk of complications such as component malposition and femoral stem undersizing14. Finally, implementation of new surgical approaches is associated with a learning curve in which higher operative times and complication rates can be encountered5–7. Although numerous studies suggest a benefit for patients undergoing minimally invasive THA, some surgeons remain skeptical that these changes in surgical technique are responsible for the observed improvements15.
In this systematic review, we aim to provide an overview of current evidence on clinical, functional, and radiological outcomes in primary THA performed using the DSA. Complication rates, reasons for revision, pain scores, physical function, operative time, hospital LOS, blood loss, radiological outcomes, and learning curve were explored.
Methods Protocol and RegistrationA systematic review was conducted according to the Preferred Reporting Items for Systematic Reviews and Meta-Analyses guidelines16. The protocol of this systematic review was prospectively registered in the International Prospective Registry of Systematic Reviews (ID: CRD42022371913).
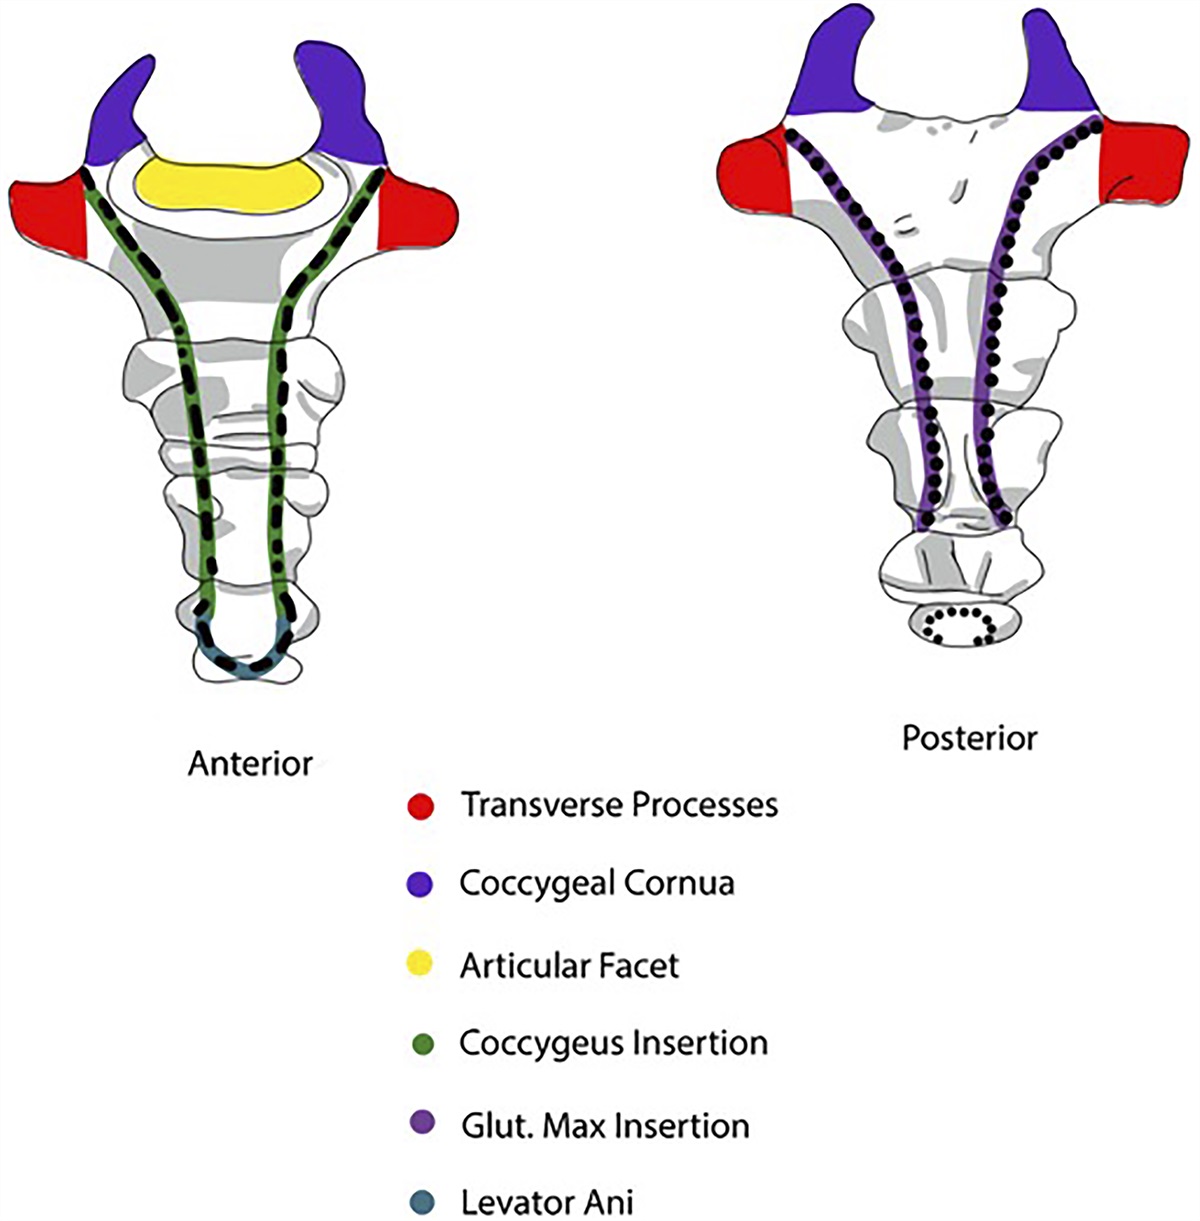
Surgical TechniqueThe objective of the DSA is to preserve the iliotibial tract, obturator externus tendon, and quadratis femoris muscle17. The procedure involves a small incision along the posterior edge of the greater trochanter, extending in the proximal direction. An incision is made through the gluteus maximus fibers, skin, subcutis, and gluteus maximus fascia, ensuring preservation of the iliotibial band. The gluteus maximus is incised. The conjoined tendon and piriformis tendon are detached, marked, and positioned posteriorly. Lifting the gluteus minimus, a capsulotomy is performed in line with the femoral neck. Subsequently, the hip is dislocated, and this is succeeded by the resection of the femoral neck, reaming of the acetabulum, and the insertion of the femoral and acetabular components. Long DSA Hohmann retractors and specialized reamers are used for this procedure. The capsule is closed side to side; the piriformis reattached; and the fascia, subcutaneous tissue, and skin closed in layers. Detailed illustrations of the DSA are displayed in a comprehensive article by Barrett et al.9.
Eligibility CriteriaStudies were eligible if (1) the authors reported on the outcome of primary THA through the DSA; (2) at least 10 adult patients were included; (3) full text was available; (4) operative technique was defined; and (5) written in English, French, Dutch, or German. Exclusion criteria were (1) cadaveric studies, (2) no original research, (3) no full text available, (4) former systematic reviews, (5) animal studies, (6) hip hemiarthroplasties, and (7) revision procedures. Furthermore, we excluded alternative posterior-oriented minimally invasive methods, including the supercapsular percutaneously assisted total hip, due to its specific emphasis on preserving the piriformis muscles and avoiding intraoperative hip dislocation.
Search Strategies, Information Sources, and Study SelectionStudies investigating the outcome of the DSA to THA were identified using Cochrane Central Register of Controlled Trials (CENTRAL), Medline, Embase, Web of Science, and Google Scholar on December 18, 2023. The Medline search strategy was developed and transferred into similar search strategies for the other databases in collaboration with a clinical librarian (A.M.v.d.W.-O.). The search in all databases was performed with a combination of the following keywords: “arthroplasty,” “hip replacement,” “hip prosthesis,” “direct superior,” “direct superior approach,” “iliotibial,” and “transpiriformis” (Table S1 supplementary data). References of the included articles were screened to identify additional studies. Eligibility assessment was performed by 2 independent reviewers (B.v.D. and R.M.P.) using Rayyan18. Disagreements were solved by consulting the senior author (W.P.Z.).
Data ExtractionData extraction was performed independently by 2 authors (B.v.D. and R.M.P.). Any disagreement was resolved by discussion between the reviewers. In case of no consensus, the conflict was resolved by the senior author (W.P.Z.). The following data were extracted: study design, study population, author, publication year, country, patient characteristics (age, gender, body mass index [BMI]), operative treatment strategy, length of follow-up, and outcome. Primary outcome measures were (1) revision rates, (2) type of complication, (3) pain and physical function measured with patient-reported outcome measures, and (4) radiological outcomes as assessed using plain pelvic and hip radiographs. Secondary outcome measures were (1) operative time, (2) LOS, (3) blood loss, and (4) learning curve.
Quality Appraisal and Risk of Bias AssessmentTwo authors (B.v.D. and R.M.P.) independently assessed the risk of bias and methodological quality of the included studies. Randomized controlled trials (RCTs) were assessed using the Cochrane Risk of Bias tool. A study is judged to have high risk of bias if at least 1 domain scores as such. Observational studies were assessed with the Newcastle-Ottawa Scale, which consists of 8 items with 3 subscales and a maximum score of 9 for these 3 subscales. The quality of the studies was determined based on the obtained scores: low quality 0 to 3, moderate quality 4 to 7, and high quality 8 to 9.
Data Synthesis and AnalysisOwing to the small number of studies, the retrospective design, large heterogeneity of the control groups, and differences in outcomes reported, we were not able to perform a quantitative synthesis of the data as it would be methodologically unsound. Therefore, data are described narratively in the Results section. A summary of findings for each outcome in which 3 or more studies are selected for this review is provided.
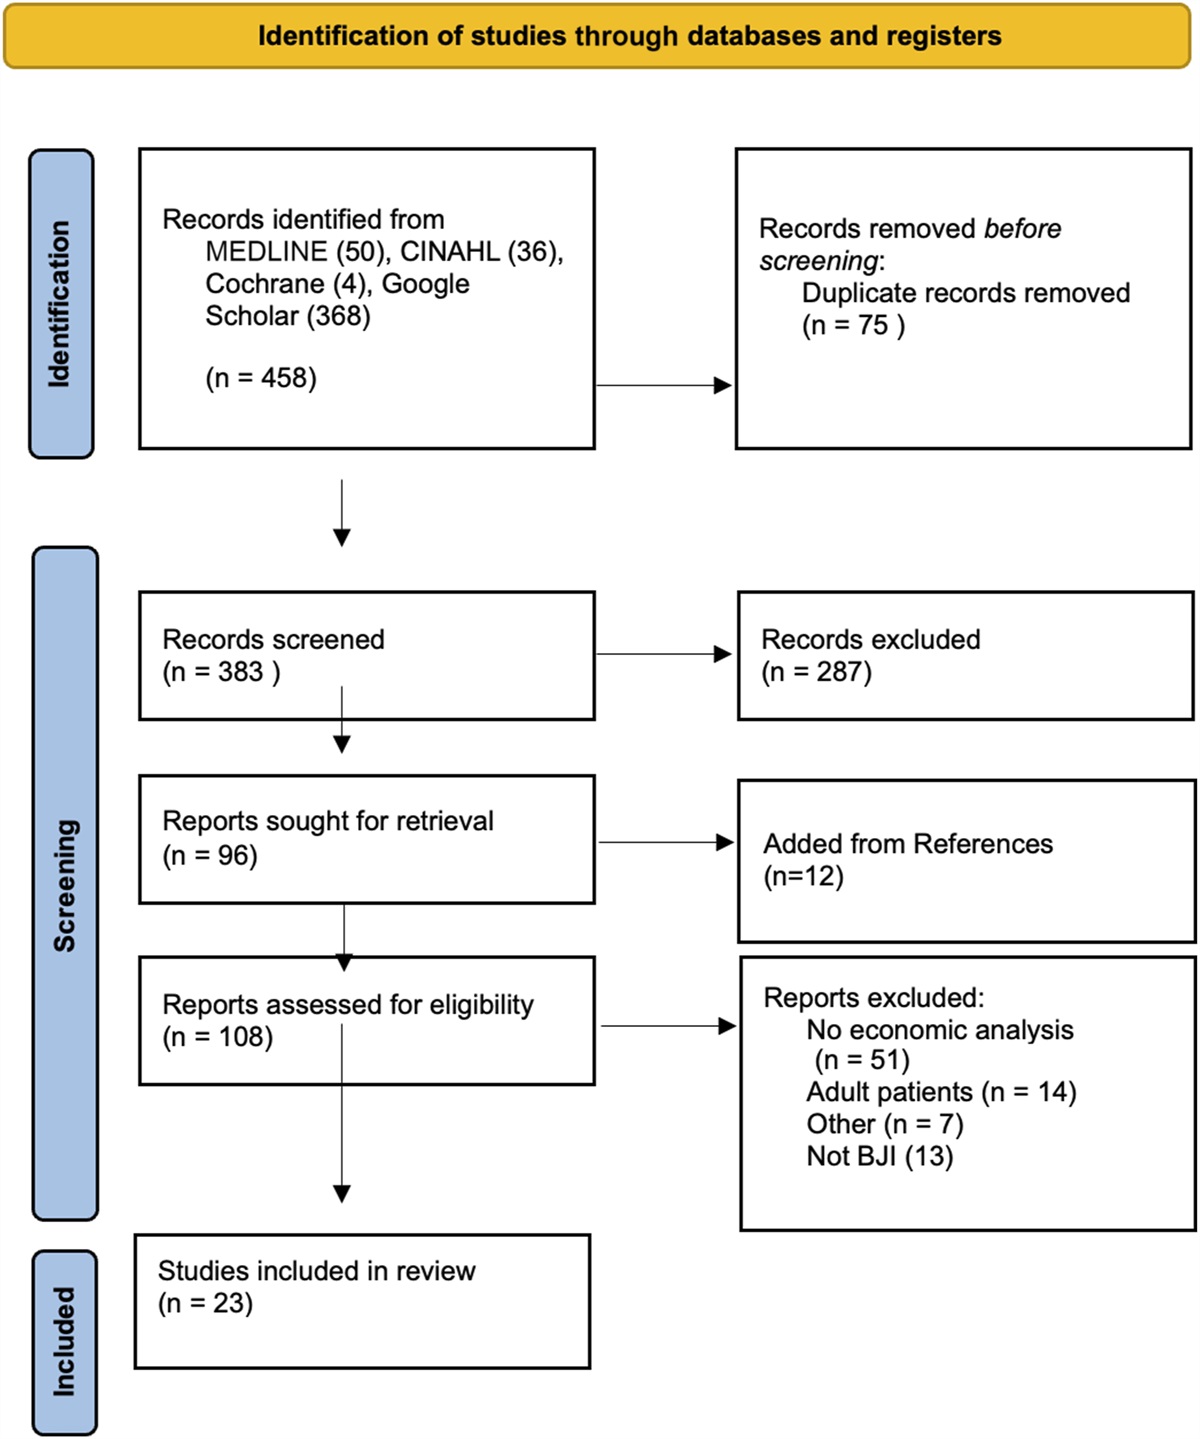
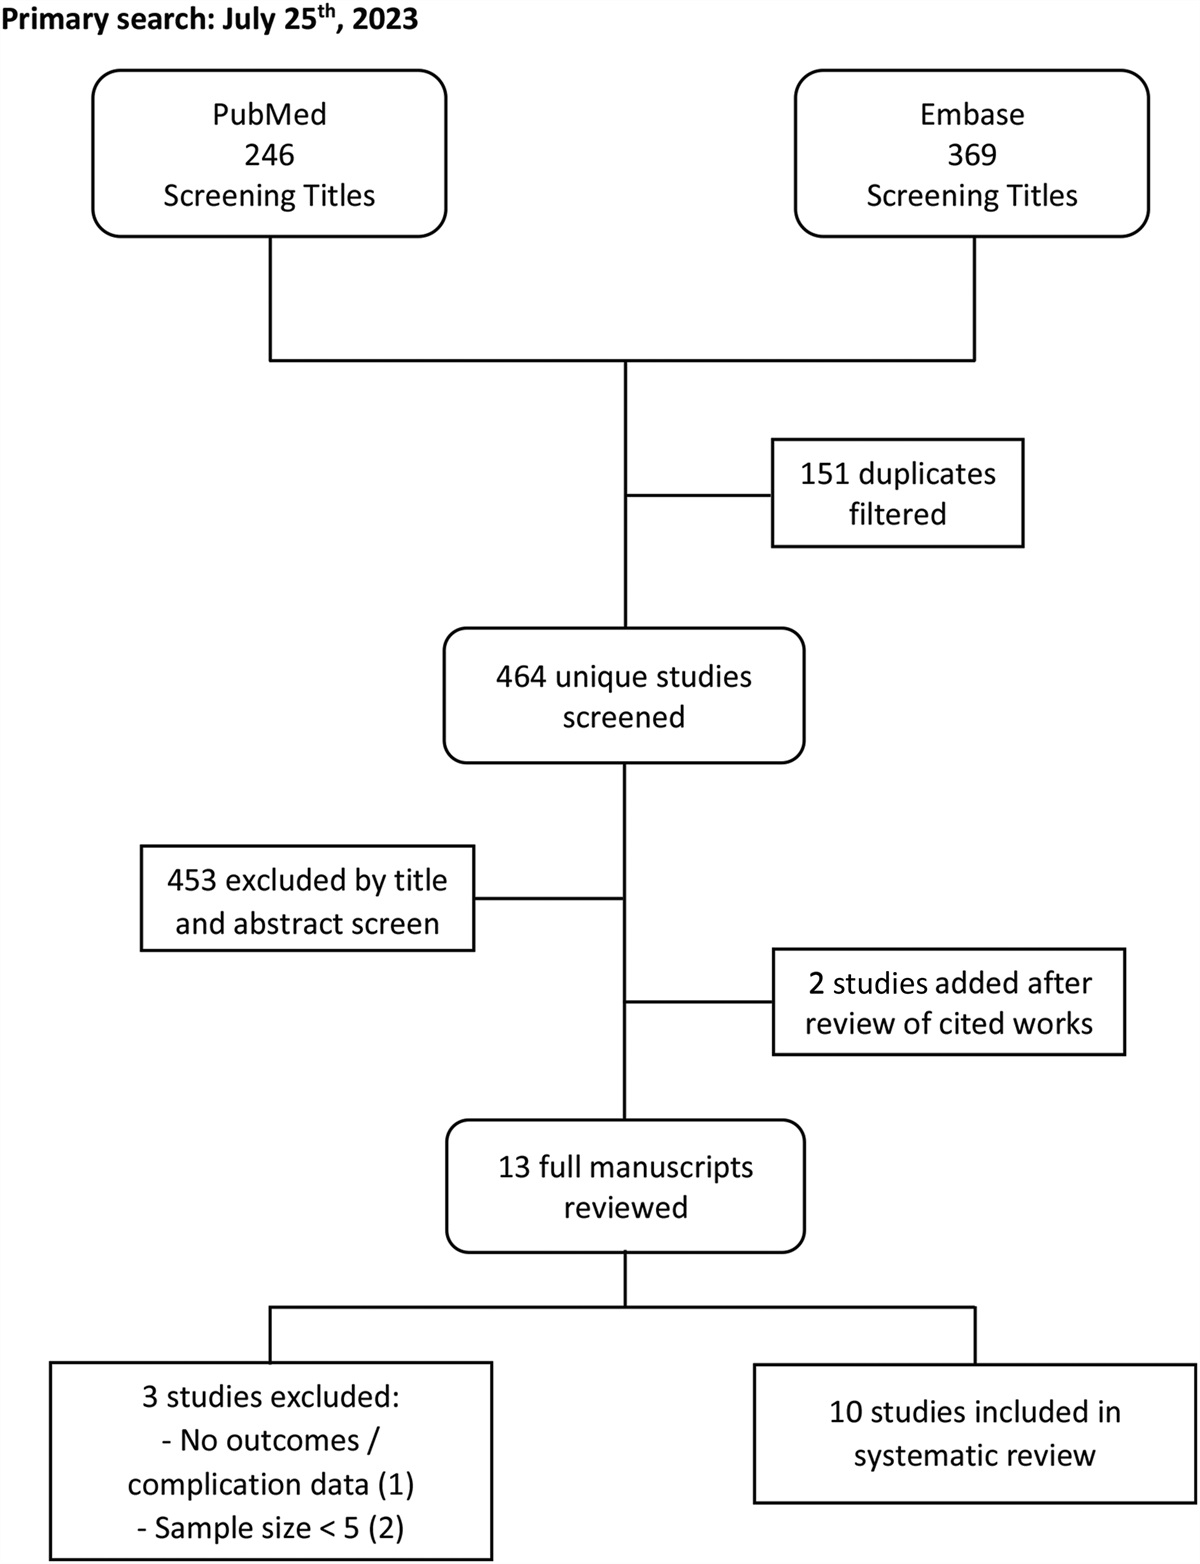
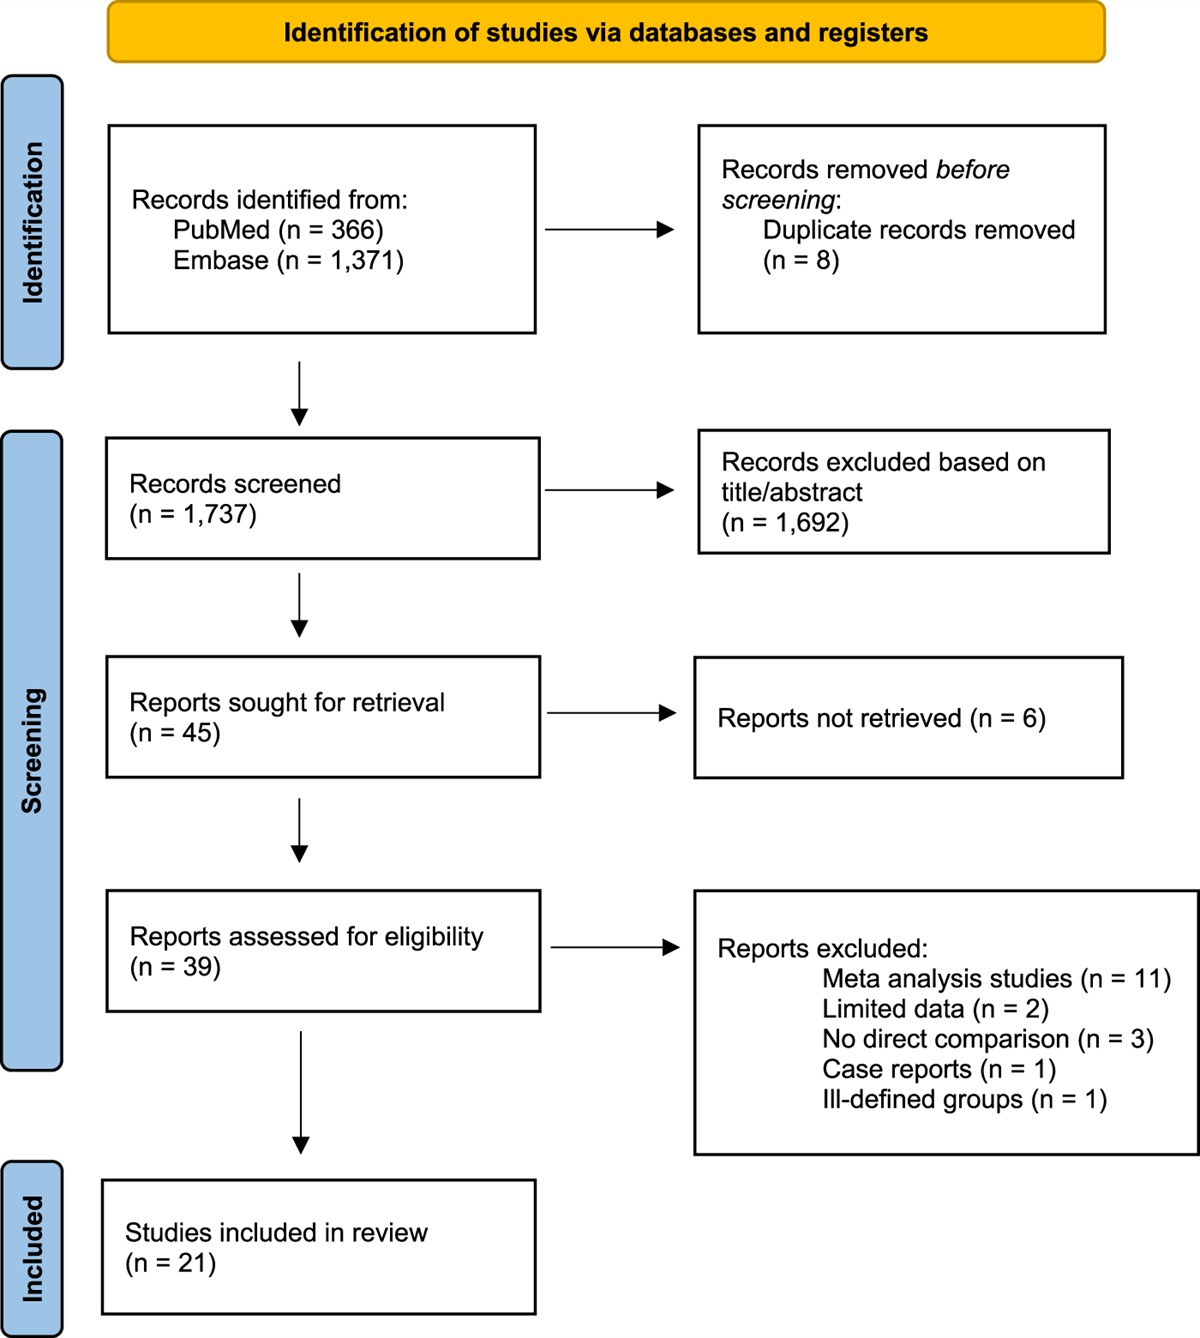
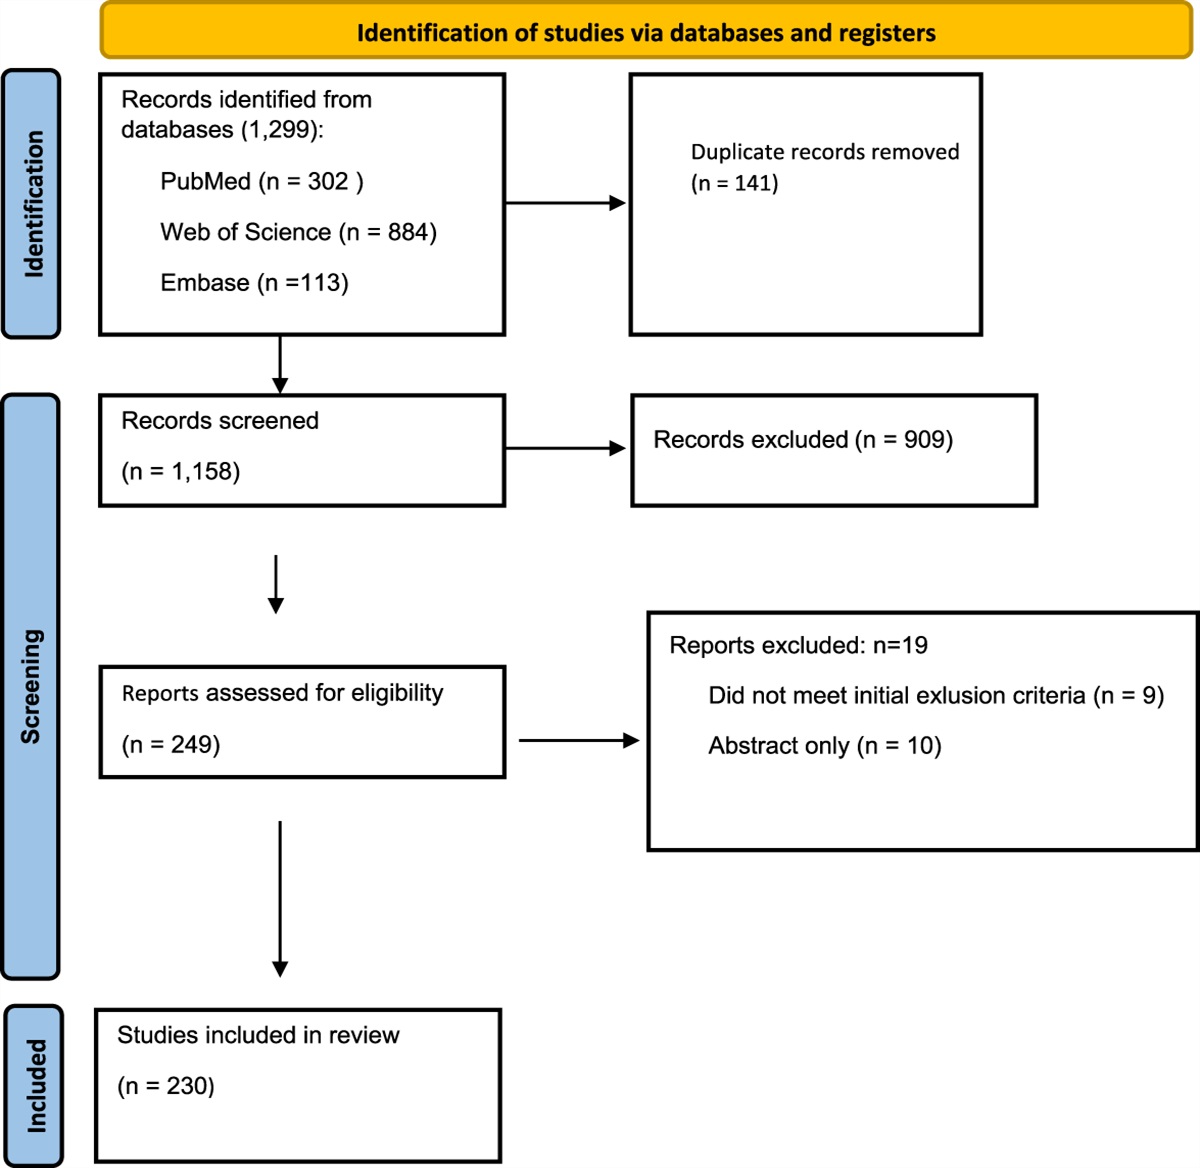
Results Study SelectionWe identified 388 studies from electronic databases searches. One hundred eighty-one studies were excluded after reviewing duplications using EndNote, and 207 articles were screened by title and abstract, of which 52 articles were eligible for full-text screening. Ultimately, 17 qualifying articles were selected10–13,17,19–30 (Fig. 1).
 Fig. 1:
 PRISMA flow diagram of included studies. PRISMA = Preferred Reporting Items for Systematic Reviews and Meta-Analyses.
Quality Assessment and MethodologyThe characteristics of included studies are presented in Table I. Seventeen studies including 3,551 patients met the inclusion criteria10–13,17,19–30. The number of patients per study ranged from 20 to 1,341, with a mean age range of 51 to 74 years (Table I). Follow-up ranged from 3 months to 2.7 years. Fifteen studies had an observational design, including 2 register studies (n = 1,341 and n = 343)29,30. Two studies were RCTs26,28. We found that most studies had a moderate level of evidence (Tables II and III; Fig. 2). The major methodological limitations were retrospective design, small sample sizes, and no independent blind assessment of end points.
TABLE I - Characteristics of the Included Studies* Author, Year*BMI = body mass index, DAA = direct anterior approach, DSA = direct superior approach, EQ5D = EuroQol-5 Dimension, HOOS-PS = Hip Disability and Osteoarthritis Outcome Score-Physical Function Short Form, LOS = length of stay, MPA = mini posterior approach, NRS = Numerical Rating Scale, OHS = Oxford Hip Score, PL = posterolateral, RCT = randomized controlled trial, and VAS = visual analog scale.
†1, risk of revision; 2, complications; 3, Harris Hip Score; 4, pain scores (NRS VAS); 5, OHS; 6, HOOS-PS; 7, EQ5D; 8, operative time; 9, blood loss; 10, time to hospital discharge LOS; 11, accuracy of implant position; 12, gait analysis; 13, learning curve; 14, incision length.
‡Not available, due to the categorized nature of data.
*A study can be given a maximum of 1 star for each numbered item within the Selection and Outcome categories. A maximum of 2 stars can be given for Comparability. A star was left white when it was not allocated. The quality of the studies was determined on the basis of the obtained scores: low quality 0 to 3, moderate quality 4 to 7, and high quality 8 to 9.
*A study can be given a maximum of 1 star for each numbered item within the Selection and Exposure categories. A maximum of 2 stars can be given for Comparability. A star was left white when it was not allocated. The quality of the studies was determined on the basis of the obtained scores: low quality 0 to 3, moderate quality 4 to 7, and high quality 8 to 9.
 Fig. 2:
 Risk of bias summary using the Cochrane Risk of Bias tool for randomized trials. Low (+), high (−), or unclear (?) risk of bias.
Outcomes ComplicationsFourteen studies reported on complication rates (Table IV). Complication rates were reported at different time points (3 months to 2.7 years). Overall, 51 complications (1.6%) were reported, and in 39 cases (1.3%), revision surgery was needed. The most common reason for revision was periprosthetic fracture. Eight cases (0.3%) of postoperative dislocation were observed, for which 5 revisions were performed. No revisions for cup malpositioning were reported. One revision due to excessive leg lengthening and 1 revision for inadequate offset were reported17.
TABLE IV - Number of Complications for the DSA per Study* Roger and Hill, 201217
留言 (0)