
記住我


With increasing esthetic awareness in modern society, the demand for orthodontic treatment is also increasing. However, long-term orthodontic treatment may cause esthetic concerns for patients due to the materials used in this process. Therefore, ceramic brackets, clear aligners, and lingual orthodontics are used as an alternative to bracket-wire systems used in traditional orthodontic treatments. Although clear aligners have advantages such as being more hygienic, easier to use, and more esthetic than traditional methods, treatment success is dependent on patient cooperation.[1,2]
The internet has become a readily accessible source of information on all subjects, and patients frequently use online resources to learn about medical information and treatment methods. Many patients search for more information about orthodontic treatment, and a popular source of this information is YouTube. Features of the YouTube content focuses primarily on the visual content, unlike the scientific platforms accessible to professionals.[3] In addition to the classic video format that has always been used on the YouTube platform, the website recently introduced YouTube Shorts, which was released in beta in 2020 and launched worldwide in 2021. Similar to TikTok, YouTube Shorts are user-generated, vertical (portrait mode) videos 15– 60 s in length to which users can add captions and licensed music.[4] However, due to the ease of video-sharing on YouTube and the lack of oversight and standardization of the content of uploaded videos, the validity of any information obtained through this medium is questionable.
Studies evaluating YouTube content have been conducted on orthodontic treatment topics such as impacted canines,[5] lingual orthodontic treatment,[6] orthodontic treatment for adults,[7] clear aligners,[8,9] orthodontic pain,[10] and accelerated tooth movement.[11] To the best of our knowledge, there are no studies evaluating the content and quality of YouTube Shorts videos together with YouTube videos on clear aligners. The aim of this study was to evaluate the quality and characteristics of information about clear aligners in both classic videos and shorts on the YouTube platform, which is an important representative of the new media.
MATERIAL AND METHODSGoogle Trends website (https://trends.google.com) was used to define the most frequently searched terms related to orthodontic clear aligners. Search terms were determined as Aligner, Clear aligner, and Invisalign as possible keywords. Search parameters were set to worldwide and the past five years. Although the most popular keyword was Invisalign, we did not select this as a keyword because it is a commercial brand and could reduce the results from other brands. Therefore, we selected the second most popular keyword, aligner (Google Trends, May 1, 2022).
Because search results may vary on different days, a playlist was created to save the search results. After ranking the results according to relevance, 100 of the first 157 YouTube videos and 100 of the first 140 YouTube Shorts were evaluated. Videos that were irrelevant, were longer than 15 min, had no words, and had no comments or likes were not included in the study [Table 1]. Evaluation of all video content and characteristics was performed by one of the researchers (B.C). All videos were evaluated in detail and general characteristics such as number of views, number of comments, video length, number of likes and dislikes, country, and brand information were noted. Viewer interaction was quantified by calculating an interaction index and viewing rate using the following formulas:
Interaction index %:Number of likes−Number of dislikesNumber of views×100 Viewing rate %:Number of viewsNumber of days since upload×100Table 1: Reasons for excluding criteria for YouTube and YouTube Shorts.
Reasons for exclusion YouTube YouTube Shorts Not relevant - 35 Comments/likes disabled 6 5 Duplicate 7 - >15 min 16 - No audio 28 - Total exclusion 57 40In addition, the source of the videos was classified into five groups as dentist/specialist, hospital/clinic/university, commercial (i.e., dental manufacturing or supply company), layperson, and other. The video information and quality index (VIQI) and DISCERN index were used to evaluate the quality and usefulness of the videos. In the VIQI scale, the flow of information in the video, accuracy of the information, quality of the video (e.g., use of still images, animations, and subtitles), and degree of consistency between the video title and content are rated on a 5-point Likert-type scale ranging from 1 (low quality) to 5 (high quality). DISCERN is a tool developed by Charnock et al. and consists of 16 items, rated from 1 to 5.[12] Based on total mean DISCERN scores, sources are divided into five levels of information quality: Very poor (16–26), poor (27–38), moderate (39–50), good (51–62), and excellent (63). DISCERN score and video length were not assessed for YouTube Shorts due to their short duration.
Randomly 80 YouTube videos and eighty YouTube Shorts were reviewed after three months by other researcher (H.Y.) to evaluate interexaminer agreement. It was found to be 0.901 between three months interval according to Cohens’ Kappa statistics.
Statistical analysisData were analyzed using International Business Machines Statistical Package for the Social Sciences (SPSS) Statistics version 23. The Shapiro–Wilk and Kolmogorov–Smirnov tests were used as normal distribution tests. Pairwise comparisons of non-normally distributed data were made using the Mann– Whitney U-test. Comparisons of non-normally distributed data between three or more groups were performed using the Kruskal–Wallis test with Dunn’s multiple comparison test. Pearson’s Chi-square test with Bonferroni correction for multiple comparisons was used to compare categorical data between the groups. The results of analysis were presented as mean ± standard deviation for quantitative data. Level of significance was accepted as P < 0.05.
RESULTSThe characteristics of YouTube and YouTube Shorts videos are summarized and compared in [Table 2]. All variables except viewer interaction index were significantly higher for YouTube videos (P < 0.05), while viewer interaction was higher for YouTube Shorts videos (P < 0.001) [Table 2].
Table 2: Comparison of variables between YouTube and YouTube Shorts.
YouTube (n: 100) YouTube Shorts (n: 100) P-value Mean±SD Mean±SD Views 105455.9±252180.5 1258.2±5610.7 <0.001* Comments 104.9±271.7 1.9±7.7 <0.001* Likes 1062.1±3278.1 43.6±216.6 <0.001* Dislikes 35.7±118.6 0.9±4.4 <0.001* Viewers’ interactions 1.2±1.4 6.4±11.8 <0.001* Viewing rate 15415.2±45966.5 548.5±2240.8 <0.001* VIQI 2.5±1 1.5±0.7 <0.001*[Table 3] shows the distribution of YouTube videos according to DISCERN score in four categories, as none of the videos were evaluated as excellent quality. Only 9% of videos, content quality was found to be good. All variables were found to be significantly higher in videos classified as good quality according to DISCERN score. As DISCERN scores decreased, a significant decrease was present in the number of views, comments, likes and dislikes, total video length, VIQI, viewer interaction, and viewing rate. There was also a statistically significant difference between YouTube and YouTube Shorts videos in terms of the distribution of video sources (P < 0.001). More YouTube Shorts videos were posted on hospital/clinic/university channels, while YouTube videos were more often posted by laypeople and sources in the others group [Table 4].
Table 3: Comparison of variables in YouTube videos according to DISCERN score.
Very poor (13%) Poor (49%) Fair (29%) Good (9%) P-value Mean±SD Mean±SD Mean±SD Mean±SD Views 135950.4±455905.4b 77032.1±206700.0ab 116395.2±218473.3a 180910.6±196237.0a 0.005* Video duration (sec) 171.4±211.9b 269.2±210.8ab 333.7±239.5a 521.9±268.7a 0.001* Comments 8.0±22.7b 72.3±213.5bc 157.6±365.2ac 252.6±341.1a <0.001* Likes 55.2±168.6c 1109.2±4145.3b 1128.0±2475.7ab 2047.7±2368.6a <0.001* Dislikes 2.7±6.7b 37.2±140.1ab 42.7±119.1ab 52.7±65.2a 0.012* Viewers’ interactions 0.8±1.8b 1.3±1.6ab 1.2±0.9a 1.7±1.4a 0.010* Viewing rate 23196.1±80542.2b 12583.1±46433.8ab 15713.1±28028.7a 18635.9±23898.2a 0.006* VIQI 1.0±0.0c 2.2±0.5b 3.3±0.6a 4.0±1.1a <0.001*Table 4: Comparison of video sources between YouTube and YouTube Shorts.
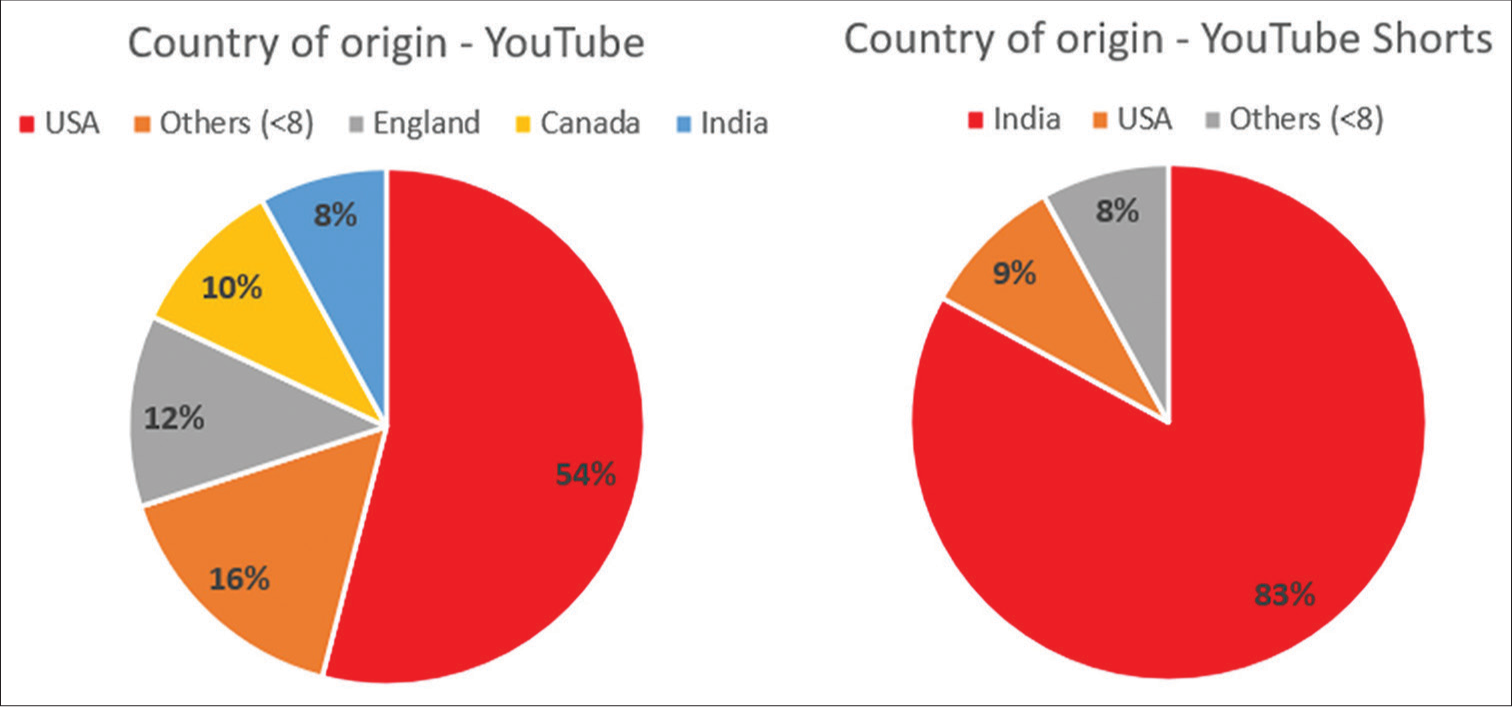
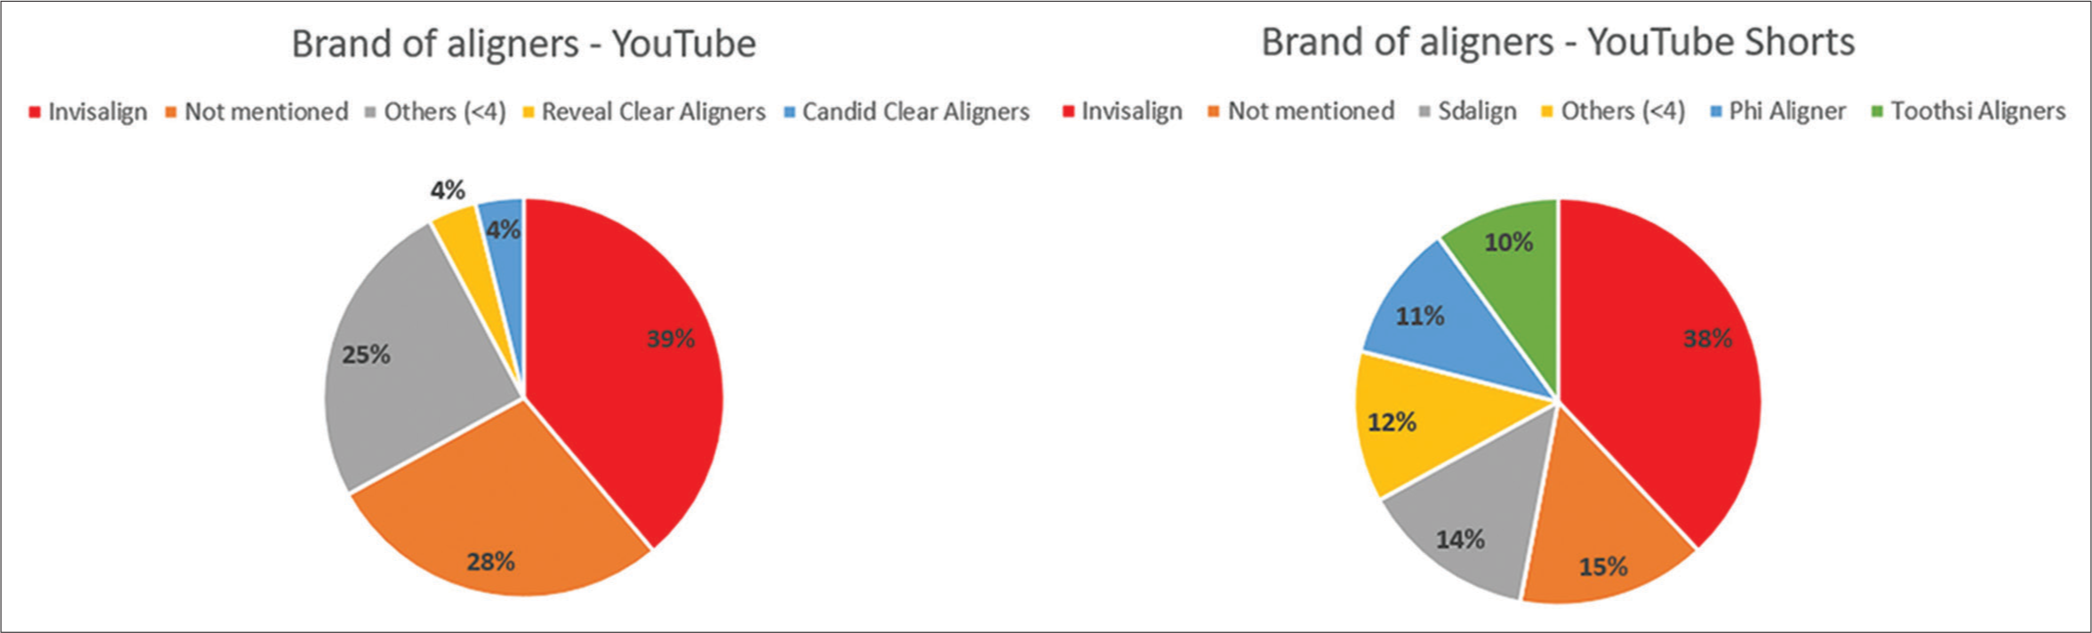
YouTube YouTube Shorts P-value Dentist/specialist 21 33 <0.001* Hospital/clinic/university 15b 35a Commercial 37 27 Layperson 13a 5b Other 14a 0bThe United States of America (USA) was the leading country by producing 54% of YouTube videos. This was followed by the United Kingdom (12%), Canada (10%), and India (8%). The remaining 16% were from countries with fewer than eight video uploads each. However, India was the predominant source of YouTube Shorts videos, with 83%. Only 9% of YouTube Shorts videos were from the USA [Figure 1]. Invisalign was the most frequently mentioned brand of aligner in both YouTube and YouTube Shorts videos. As shown in [Figure 2], Invisalign was mentioned in 39% of YouTube videos,and 38% of YouTube Shorts videos.
Export to PPT
Export to PPT
Comparisons of YouTube and YouTube Shorts video characteristics according to source are shown in [Tables 5 and 6]. Video length, number of comments, and number of likes were found to be significantly higher for YouTube videos posted by laypeople. Similarly, YouTube Shorts videos posted by laypeople had significantly higher viewing rate and numbers of views, comments, likes, and dislikes than shorts from other sources.
Table 5: Comparison of variables in YouTube videos according to video sources.
Commercial Hospital/clinic/university Dentist/specialist Layperson Other P-value Views 128492.5±248913 81954.2±160977 70790.05±273621.1 269563.4±352124.7 35312.43±46337.91 0.059 Video duration (sec) 274.38±193.69bc 222.87±247.34c 226.16±213.87c 510.92±225.52a 405.5±230.28ab <0.001* Comments 181.05±418.31ab 92.4±275.99b 13.46±29.89b 294.46±375.74a 69.64±87.42ab 0.001* Likes 1375.86±2887.75ab 757.2±1856.61b 151.97±379.35b 4210.46±7480.05a 399.93±486.8ab 0.009* Dislikes 51.67±139.24 27.8±54.14 6.62±13.08 127.15±257.86 12.14±19 0.071 Viewers’ interactions 1.22±1.35 1.09±0.96 1.12±1.59 1.84±1.98 1.12±0.79 0.150 Viewing rate 11694.98±25168.42 13190.47±25308.57 10909.34±47771.29 48092.83±85822.13 4944.27±6008.38 0.072 VIQI 2.9±1.14 2.27±1.1 2.3±1 2.15±0.8 3±0.78 0.051 DISCERN 41±11.63 34.27±12.04 33.92±8.85 32.77±6.14 40.21±7.38 0.051Table 6: Comparison of variables in YouTube Shorts according to video sources.
Commercial Hospital/clinic/university Dentist/specialist Layperson Other P-value Views 282.77±451bc 1073.76±2102.42b 743.93±2314.21c 12080±23461.39a - 0.002* Video duration (sec) - - - - - - Comments 0.14±0.43b 2.33±5.08ab 0.59±1.76b 18.2±29.53a - 0.008* Likes 7.14±8.26b 33.82±83.96b 21.33±64.88b 482.8±905.4a - 0.004* Dislikes 0.74±3.65b 0±0b 0.79±2.91b 8.4±15.52a - <0.001* Viewers’ interactions 3.86±3.01 3.59±2.9 13.36±20.86 4.89±2.19 - 0.166 Viewing rate 302.32±993.05bc 388.15±879.18b 173.87±456.39c 5352.69±8821.18a - 0.002* VIQI 1.49±0.78 1.61±0.56 1.44±0.64 1.4±0.89 - 0.386 DISCERN - - - - - - DISCUSSIONIn the literature, it has been noted that YouTube is more frequently preferred by patients than other social media platforms due to its ability to provide visual and auditory information.[9] The YouTube platform is used both by patients to learn about clear aligners and by aligner companies to reach a wider audience.[13,14] YouTube Shorts, on the other hand, was described on YouTube’s blog as “a new short-form video experience for creators and artists who want to shoot short, catchy videos.”[15] Several previous studies have evaluated the quality and reliability of information about clear aligners on the YouTube platform. However, there are no studies evaluating the differences between YouTube and YouTube Shorts videos.
The viewing rate and interaction index, particularly crucial for content creators, indicate which content users like, watch, and follow more. Especially in the field of health, understanding which content reaches users, and determining the quality of that content is left to experts in the field. In the literature, viewing rate and interaction index are compared with scales that measure video quality, such as VIQI and DISCERN.[6,7] VIQI, one of them, uses a 5-point Likert-type scale ranging from 1 (low quality) to 5 (high quality). DISCERN, on the other hand, evaluates the quality of information about treatment options for patients and healthcare professionals. It consists of 16 questions, with scores ranging from 1 to 5, and provides an overall assessment based on the total score.[12]
When the descriptive data was evaluated, we observed that YouTube videos had less viewer interaction than YouTube Shorts videos. However, YouTube videos generally had higher content quality, greater production value, or more comments and likes. The lower VIQI score for YouTube Shorts videos can be attributed to the fact that creators share these videos to advertise themselves rather than for the purpose of conveying accurate information.
The relationship between video quality and other variables was evaluated according to the DISCERN scores of the YouTube videos. The videos rated as good quality based on high DISCERN score had higher VIQI score, viewing rate, viewer interaction index. Moreover, number of views, comments, likes, and dislikes compared to videos in the other DISCERN quality groups, were also parameters on which the videos were rated as good quality videos. Similar to this, other studies showed that videos with good content had more views, comments, likes, and dislikes.[6,10,16] This can be explained as the increase in educational value as a result of the high quality of the content in the videos and the support with appropriate audio and images.
A previous study more videos related to patients experiencing orthodontic pain were produced by laypeople.[10] However, some studies have shown that videos containing patient experiences can be less educational and misleading.[17,18] When the YouTube and YouTube Shorts videos in our study were grouped according to video source, we noticed that videos uploaded by laypeople received more comments and likes compared to those from other groups. Both YouTube and YouTube Shorts videos uploaded by physicians had fewer likes and comments. Despite that, it should be noted that viewing rate and numbers of comments, likes, and dislikes can be manipulated.
The sources of YouTube videos vary according to their topic. Videos about lingual orthodontics,[6] orthognathic surgery,[19] and clear aligners[8] were reported to be mostly uploaded by laypeople. However, YouTube videos about accelerated orthodontics are mostly shared by academic institutions and orthodontists rather than laypeople.[11] In our study, comparison of YouTube and YouTube Shorts videos showed that hospitals/clinics/universities posted more YouTube Shorts videos, while laypeople shared more YouTube videos.
In terms of country of origin, USA is the leading source of YouTube videos, accounting for 54%. A substantial number of videos have also been uploaded from the United Kingdom, Canada, and India. In contrast, the majority (83%) of YouTube Shorts videos were from India. This is not surprising because YouTube Shorts was introduced as a beta in India in September 2020 following India’s TikTok ban.[20] It was later introduced as a beta in the USA in March 2021, and after launching in various countries was eventually made available to users worldwide in July 2021.
When videos from commercial sources were evaluated, Invisalign was found to be the most frequently mentioned clear aligner brand in both YouTube and YouTube Shorts videos. This is also expected, as Invisalign is the leading brand of clear aligners.[21] However, the second most mentioned brands differ between YouTube and YouTube Shorts videos, which is related to being posted from different countries.
In this study, general features and video quality of both YouTube and YouTube Shorts were evaluated. The findings of this study shows the quality of information people reach out. However, the fact that only English videos were evaluated caused it to be limited to the videos watched by people who speak and understand English. Another limitation is that the YouTube platform changes very quickly, causing variables such as the number of likes, number of views, and viewing rate to vary.
CONCLUSIONOrthodontists should be aware that the data available on the internet is incorrect or insufficient and should guide their patients correctly with additional data
They should guide them on how to access up-to-date and accurate data
Orthodontists should also make greater efforts to create reliable and quality health content on popular social media platforms such as YouTube.
留言 (0)