
記住我
Cutting-edge methodologies and techniques are required to understand complex neuronal dynamics and pathological mechanisms. Among them, optical tools stand out due to their combination of non-invasiveness, speed, and precision. Examples include optical microscopy, capable of characterizing extended neuronal populations in small vertebrates at high spatiotemporal resolution, or all-optical electrophysiology and optogenetics, suitable for direct control of neuronal activity. However, these approaches necessitate progressively higher levels of accuracy, efficiency, and flexibility of illumination for observing fast entangled neuronal events at a millisecond time-scale over large brain regions. A promising solution is the use of acousto-optic deflectors (AODs). Based on exploiting the acousto-optic effects, AODs are high-performance devices that enable rapid and precise light deflection, up to MHz rates. Such high-speed control of light enables unique features, including random-access scanning or parallelized multi-beam illumination. Here, we survey the main applications of AODs in neuroscience, from fluorescence imaging to optogenetics. We also review the theory and physical mechanisms of these devices and describe the main configurations developed to accomplish flexible illumination strategies for a better understanding of brain function.
A central quest in neuroscience is to unveil complex neuronal dynamics and understand their correlation to pathological conditions in vertebrate organisms [1–6] to clarify equivalent human neural mechanisms [7, 8]. In this framework, advanced light microscopy represents the tool of choice [9, 10] to non-invasively image extended neuronal populations [11, 12] at both cellular and subcellular scales [13]. This approach, in combination with genetically encoded calcium indicators, as reporters of neuronal activity [14, 15] (such as GCaMP [16]), paved the way for important progress in neuroscience, including high-resolution anatomical reconstruction [17], monitoring of biological sample development [18, 19], and advanced functional analysis [20, 21]. Furthermore, recent significant advancements in molecular biology have unlocked the potential for selectively altering the activity of neurons in the brain by means of light [22]. This breakthrough technique, known as optogenetics, has revolutionized the field of neuroscience [23] by enabling researchers to precisely control neural activity with unprecedented accuracy [24, 25]. To do this, optogenetic actuators, i.e. specific proteins, that work as light-gated ion channels [26], are expressed in genetically modified neurons. This makes these neurons photo-responsive such that they can be activated and inhibited by an external light trigger [27]. This remarkable technology not only offers a powerful tool for investigating the complex functions of the brain, but it also has the potential to transform our understanding of neurological disorders, with the goal of supporting new therapeutic interventions [28]. As such, the development of optogenetics has been hailed as a revolution in experimental neuroscience and has opened exciting new paths for exploring the brain's inner workings.
However, imaging and optogenetics demand advanced tools to achieve more precise and efficient light delivery to specific regions of the brain and to obtain the possibility of analyzing fast and entangled neuronal events. In particular, optical microscopists strive for the best trade-off between precision, speed, and flexibility of targeted illumination [29, 30]. All these features are indeed necessary to selectively image specific groups of neurons and to control vast circuits in large brain volumes at millisecond time-scale, the typical dynamics of neuronal signalling. Wide-field illumination e.g. the most straightforward way to illuminate the sample, lacks spatial selectivity, making conventional microscopes unable to generate high-contrast or high-resolution images of thick samples. Point-scanning illumination, on the other hand, can obtain high-quality images with laser scanning confocal or multi-photon microscopy [31] but this approach is usually too slow to image the entire brain. This is a common issue with most point scanning procedures where a light beam needs to pivot throughout the whole field-of-view (FOV) for a complete reconstruction. Mechanical constraints, low illumination efficiency, and slow scanning speed limit the applicability of such devices in both imaging and optogenetics. For instance, galvanometer mirrors (GMs), due to their mechanical inertia, are rarely used in photostimulation but commonly in 2D raster scans [32, 33]. With their slow sweeping rate, they are not suitable for rapidly accessing connected neurons spread over large volumes. Making use of resonant GMs to increase the temporal resolution of such scanners up to frame rates of a few kHz is a possible solution for fluorescent imaging, but not for delivering custom stimulation patterns, as they do not provide the necessary flexibility for arbitrary excitation trajectories.
To deal with this issue, researchers developed more advanced scanners that enable the flexibility of addressing multiple target cells without losing spatiotemporal information [34]. To address preselected target regions simultaneously, illumination had to be parallelized. Particularly, several systems adopted micro-LEDs [35–37], digital micromirror devices (DMDs) [38, 39], or liquid crystal displays (LCDs) [40] for parallel and tailored illumination. However, even with refresh rates of up to tens of kHz, these systems suffer from poor stimulation efficiency in terms of laser power delivery when targeting far-spread targets. A more efficient parallel illumination approach has been achieved with computer-generated holography, which takes advantage of liquid-crystal-based spatial light modulators (LC-SLMs) [41–43]. However, such devices are not exempt from drawbacks. Speckle patterns are inherently generated at the sample plane by the repeated modulation of the wavefront phase, which has an impact on the precision of point illumination. In addition, cross-talk of the inter-pixel driving voltage limits the smallest available pixel size to ∼3 μm [44] which affects high-resolution illumination patterns. Therefore, only a few models provide the high refresh rate needed for advanced optogenetic stimulation (kHz). Indeed, even with continuous optogenetic stimulation, they are limited by the single actuator duty cycle (10 ÷ 100 ms), which does not match the fast ion-channel opening dynamics of many optogenetic actuators (1 ÷ 2 ms) [45]. Thus, successful studies concerning the activation dynamics of neuronal circuits that require faster illumination of multiple spots are not supported.
A promising step in this direction is the use of technologies that exploit the acousto-optic effect. In these cases, the interaction between ultrasound waves and light enables unprecedented control of light at microsecond time-scales [46]. For instance, tunable acoustic gradient index of refraction lenses (or TAG lenses) are today employed as varifocal lenses in remote focussing systems [47–51], acousto-optic tunable filters are often implemented as electronically adjustable narrow-band-pass filters [52–54], and acousto-optic modulators (AOMs) are used for a fast modulation of the diffracted beam intensity [55]. Arguably, though, the acousto-optic method that holds the greatest potential in neuroscience involves acousto-optic deflectors (AODs). First, these devices can rapidly deflect a light beam, control its intensity, and even its focusing without any mechanical movement. This allows AODs to attain MHz-order dynamics and meet the temporal requirements for concurrent activation of spatially distributed neurons. Second, the AOD response time for deflecting the light is constant, independent of the distance between successive targets. Thus, AODs guarantee excellent accuracy and consistency in beam positioning, offering high flexibility in targeting non-sequential areas of interest, better known as random-access scanning. Finally, it is also feasible to achieve the simultaneity promised by parallel approaches, creating several independent beams with a single device. This is possible by driving a single AOD simultaneously with multiple acoustic signals.
As shown in table 1, AODs stand out as the faster and more flexible option to target different regions in a volume, compared with the other aforementioned deflectors. Thanks to their versatility, AODs are increasingly exploited in experimental neuroscience, and we dedicate this review to collecting the most representative results achieved. Here, we first outline in detail the theory of AODs' physical functioning. Then, we explore the main configurations developed to accomplish flexible illumination strategies in various optical systems. Next, we discuss imaging and optogenetic applications realized with AODs. We also illustrate what can be achieved by driving a single AOD with multiple frequencies to parallelize the illumination. Finally, we discuss the possible drawbacks of these devices and solutions adopted to face them.
Table 1. Comparison of typical illumination strategy, dwell time, and cost of implementation between different devices.
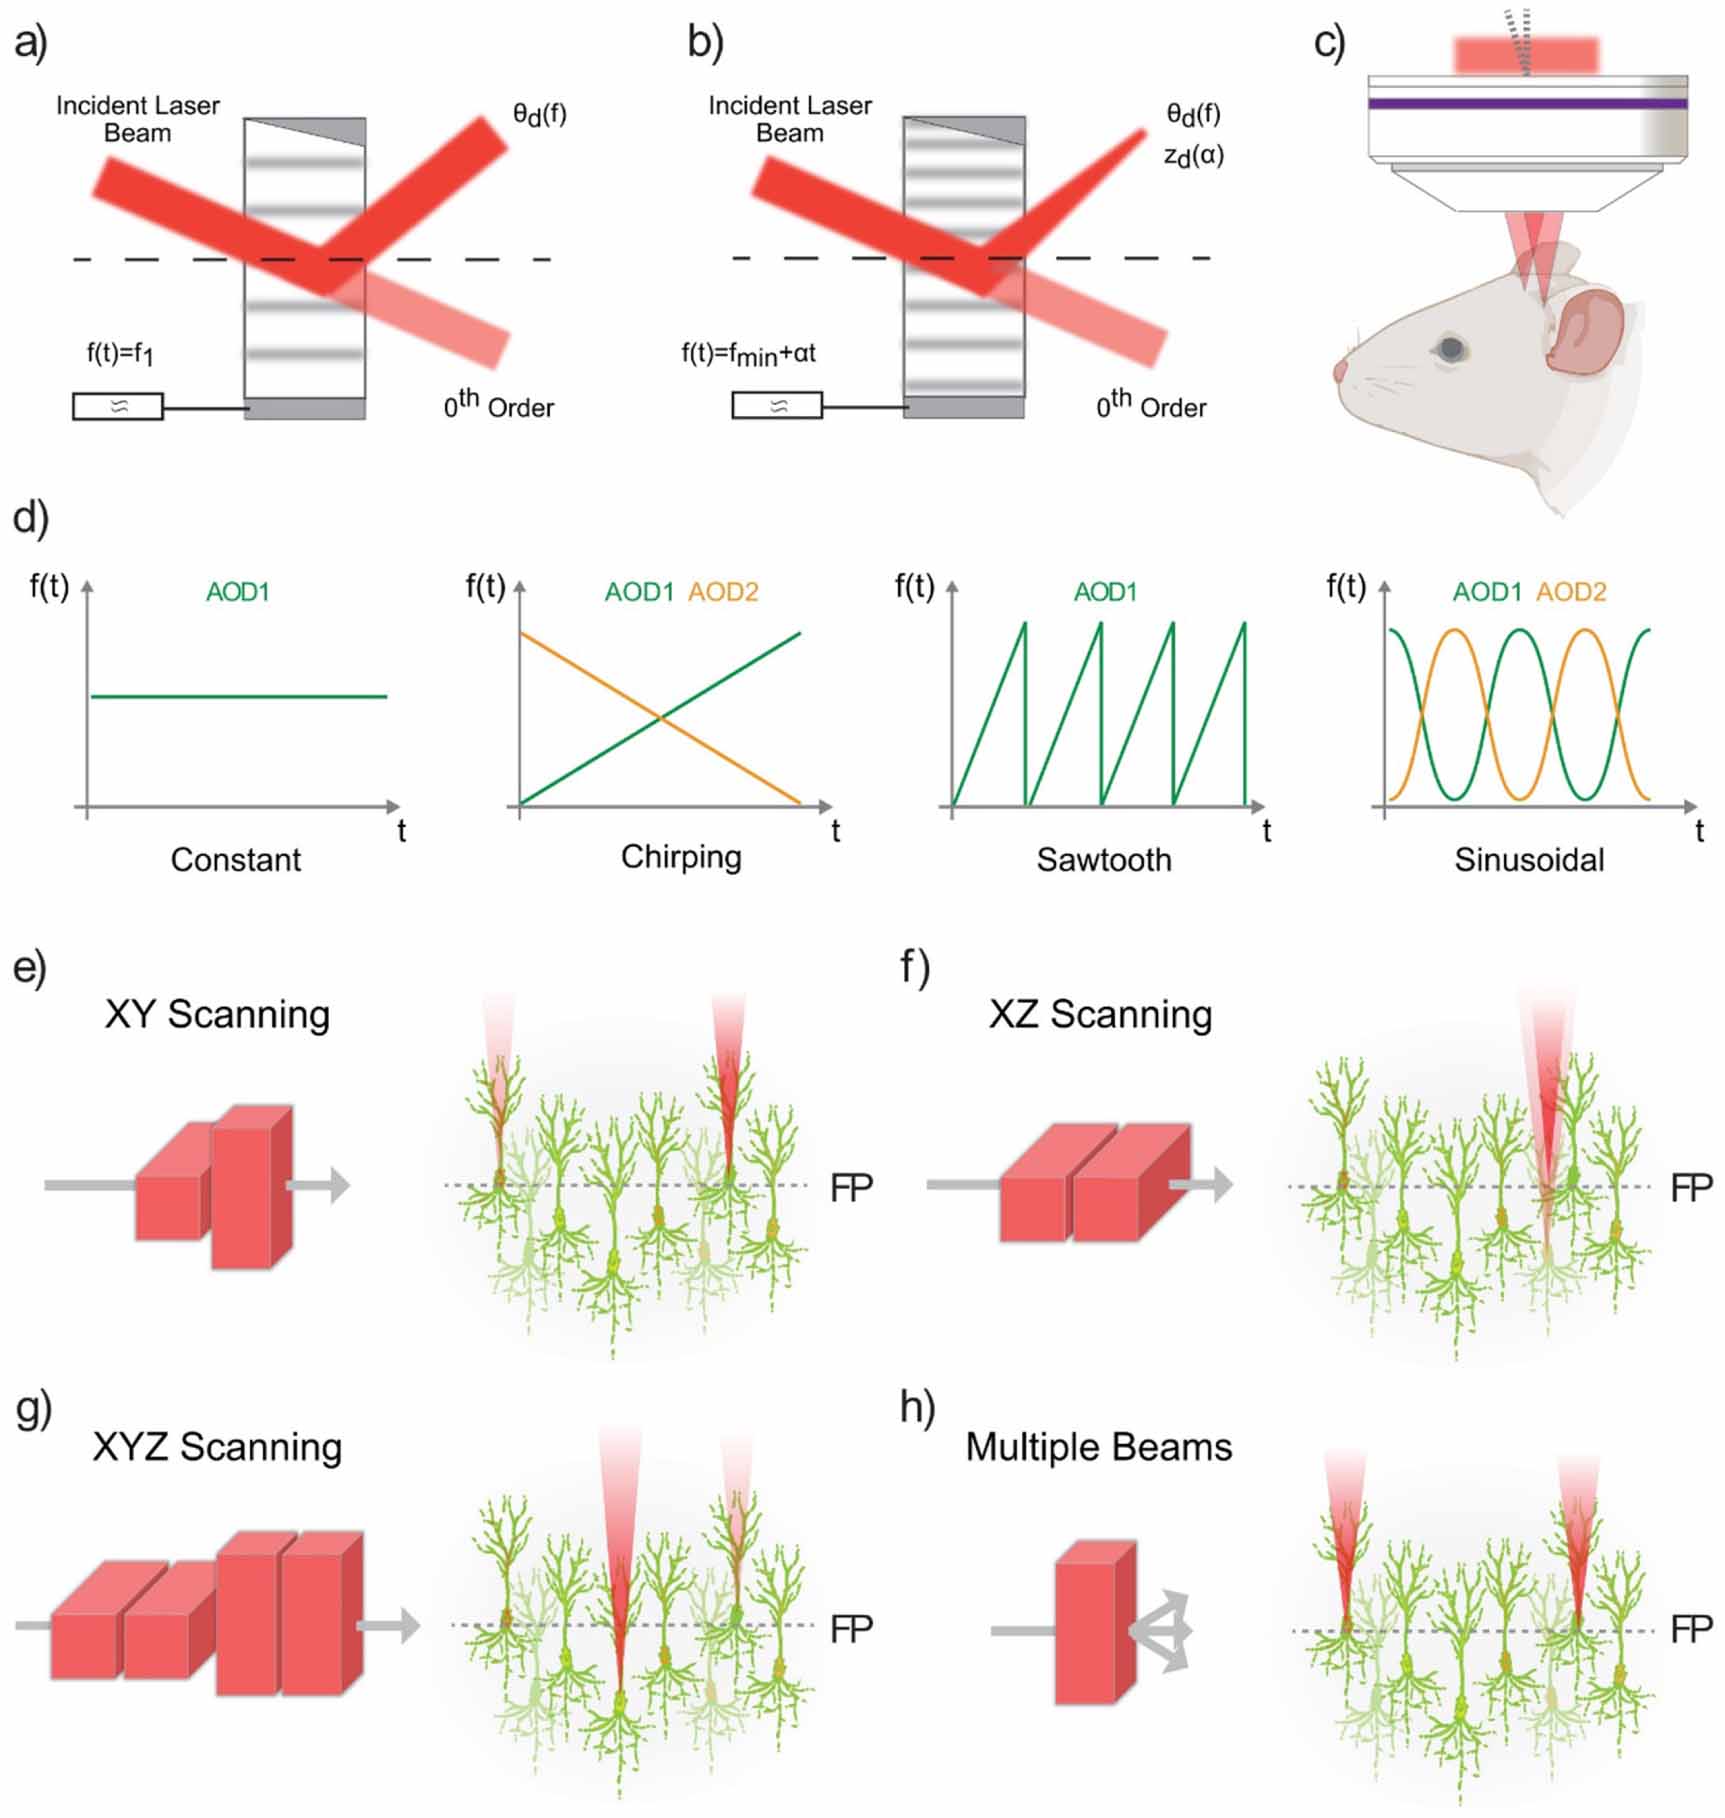
GMRes. GMDMDMicro-LEDLC-SLMAODIllumination strategiesSequentialSequentialParallelParallelParallelSequentialRandom-accessParallelDwell time/Refresh rate0.5 ÷ 1 ms100 μs50 ÷ 200 μs3 ÷ 100 ms0.6 ÷ 10 ms5 ÷ 30 μsCost1 ÷ 3 k€1 ÷ 10 k€100 ÷ 1000 €1 ÷ 5 k€15 ÷ 20 k€5 ÷ 10 k€The AODs' basic mechanism of light deflection resides in a periodic modulation of the refractive index of their acoustic-optic medium, which typically is a crystal of high refractive index, e.g. tellurium dioxide, TeO2. This modulation is induced by a piezo-transducer directly bonded to the crystal and driven by an electrical signal at radio frequencies (30–350 MHz). The oscillating piezo generates a pressure wave—or sound wave—that propagates inside the medium and alters its optical properties. The induced periodicity of the refractive index defines a Bragg diffraction grating [56, 57], and a monochromatic impinging laser beam will be deflected at the first-order beam angle:

where  and
and  are the light and sound wavelengths, respectively;
  is the frequency of the driving signal; and
  is the soundwave propagation velocity in the medium, typically
  = 650 m s−1 in TeO2. A residual undiffracted beam, or zero-order beam 0th, will instead travel straight, carrying a small fraction of the incident optical power. Figure 1(a) shows schematically the beam diffraction by an AOD.
Figure 1. AOD illumination strategies. (a) AOD driven with single static frequency diffracts the incident laser beam at a frequency-dependent angle  d (f).
  th order is the residual un-diffracted beam. (b) AOD driven with time-varying frequency diffracts the laser beam both laterally and axially with frequency-dependent displacement. (c) Schematic of AO deflected laser beam projected on the sample through the illumination objective. (d) Main frequency profiles used to drive the AODs. (e)–(g) Default configuration of AODs used for lateral scanning in 2D (XY), axial scanning in 2D (XZ) and 3D scanning (XYZ), respectively. Relay optics between deflectors omitted. (h) An AOD simultaneously driven by multiple acoustic frequencies diffracts the input beam at corresponding angles, parallelizing the illumination. FP: focal plane.
Download figure:
Standard image High-resolution imageIn any dynamic beam deflector, the two most important parameters are resolution and positioning speed. The maximum number of resolvable and distinct beam angles achievable by AOD light diffraction is given by the ratio of the angular deflector bandwidth Δθ and the angular divergence of the diffracted beam ΔФ [58]:
where ΔФ =  λ/D, with D being the incident beam's width and a nearly unitary factor that depends on the amplitude distribution of the incident beam (e.g. = 4/π for a Gaussian beam). From equations (1) and (2) it follows that:

where Δf is the frequency bandwidth of the AOD, i.e. the admitted range of acoustic frequency. It is noteworthy to mention that for non-monochromatic lasers, such as ultrafast pulsed lasers, the effect of spatial dispersion is to increase the angular spread of the beam as:

This means that whenever the spatial dispersion of the beam is significantly greater than the beam divergence ΔФ, the maximum number of resolvable points N is accordingly reduced [59].
The ratio between the beam diameter and the soundwave propagation velocity in the medium defines a notable quantity, the access time:

This is the necessary time for the acoustic wave to travel through the diameter of the laser beam. In other words, it is the time required for the beam to commute from one position to another, leading to an upper boundary on the AOD speed. Therefore, the parameter expressed in equation (3) is also known as the time-bandwidth product for an AOD.
Until now, we have only considered driving the piezo of these devices with a single and constant frequency (figure 1(d), first panel). However, the AOD's largest potential can be unlocked with several other driving configurations such as the one where an acoustic wave is characterized by a time-varying frequency. Figure 1(b) shows the schematic of AOD light diffraction with a chirped acoustic wave. Here, the angular deflection becomes a function of time [60, 61]:

where  indicates each point in the AOD's aperture with
  being the laser spot centre. Then, a time-chirped acoustic frequency can be described as a function of its profile slope, or chirp
  :
:


where  is the time required to change the frequency from the minimum value
  to the maximum
  . Substituting this frequency expression in equation (6) we find:

This equation describes a convergent cylindrical lens, or acousto-optic lens (AOL), where the first term indicates an off-set central propagation axis that varies with time, i.e. called lateral drift. The inverse of the second term is the chirp-dependent focal length:

In other words, in a determined focal position, the beam moves laterally while the acoustic frequency is chirping. It is possible to compensate for this unwanted lateral drift by optically coupling the first AOD to a second one, driven with an opposite chirp (figure 1(d), second panel):

Synchronizing the two AODs, the light beam will impinge on two subsequent devices driven by counterpropagating sound waves travelling through their crystal. The total angular deviation that affects the beam, in this case, is:


The cylindrical lens described in equation (12) has a central propagation axis determined by the median driving frequency and a variable focal length that depends on the chirp. This configuration forms an active AOL capable of 3D scanning. Figure 1(c) shows a schematic of light beam projection on the sample through the illumination objective after AOL deflection. Moreover, when these devices are configured for volumetric targeting, to keep the spot at fixed coordinates for a longer time than Tscan it will be essential to regularly repeat the frequency scan with equal slopes, such as a sawtooth profile (figure 1(d), third panel). This is necessary as the acoustic bandwidth and thus Tscan is limited. In addition, several other frequency profiles can be used to modulate the acoustic wave propagating in the AODs. For example, it is possible to obtain a fast axial periodic scan with two AODs, by modulating the two counterpropagating waves with sinusoidal profiles [62] (figure 1(d), fourth panel).
Notably, it should be mentioned that acoustic frequency sweeping also makes the AOD resolution a dynamic quantity, reducing it compared to the static case:

This means that the number of neuronal targets addressable by AOD-based systems depends on the acoustic wave frequency profile selected.
To summarize, AODs can be driven in different ways to freely deflect the light and project the beam on the sample. Using two AODs oriented orthogonally to each other, eventually optically conjugated via a 4-f telescope, provides a straightforward and fast way to control the beam in 2D, for example, for a planar raster scan (x-y scanning, figure 1(e)). Moreover, with two optically conjugated AODs oriented parallelly it is also possible to independently control the lateral deflection of the beam along one direction and its axial address (x-z scanning, figure 1(f)). To extend the light manipulation to a more general 3D scanning (x-y-z scanning, figure 1(g)), two more AODs are required to be implemented, for a total of four optically coupled devices. That is because, for each direction, it is necessary to compensate for the corresponding lateral drift discussed above.
Being intrinsically unaffected by inertia or any other mechanical constraints, these mentioned driving configurations provide an absolutely stable and steady way to achieve fast point scanning. Moreover, unlike any other standard beam scanning principles, each not-adjacent coordinate can be reached with the same access time, thus allowing for true random-access scanning. However, a finite time is still required to move from one coordinate to another, that is the access time needed to allow the soundwave to interact with the whole beam diameter, (typical access time: 10–30 us, see equation (5)). Therefore, it is important to highlight a different solution adopted by [63]. Introducing a slightly different chirp in equation (11) for the counterpropagating wave in the second AOD results in a partial compensation of the lateral drift. Overall, this generates a movement of the beam spot along a line throughout the specified dwell time. In other words, by selecting proper acoustic frequencies, it is possible to generate fast and continuous lateral scans, with certain drift speeds, in a particular z-plane.
Even though with this approach the lateral beam position drifts continuously, interruptions are still required to jump from one plane to another. In 2016, the same group [64] further developed the earlier method by introducing a novel relationship between the focal spot coordinates and the chirp parameters of the four AODs. Briefly, this is a generalization of what was previously stated concerning the use of acoustic frequencies characterised by non-linear chirps, that vary in time according to parabolic profiles. Partial drift compensation with these particular acoustic frequency profiles allowed to define continuous trajectories in 3D with arbitrary directions and predetermined speeds [53].
2.1. Multibeam diffraction with AODsUntil this point, we have only considered driving each AOD with a single acoustic frequency. Even though AOD represents the fastest device commercially available to deflect light (up to hundreds of KHz), it enables only sequential, or random-access, scanning when driven with a single frequency at the time. It means that in this configuration, concurrent illumination of different targets, or neurons, is never obtained, but they can only be addressed subsequently. However, there is no limitation on the number of radio frequencies applied concurrently to the piezo other than avoiding exceeding the maximum power. When the piezo is simultaneously driven by different frequencies, multiple sound waves propagate through the crystal. In consequence, the impinging beam will interact with a linear combination of these waves and be simultaneously diffracted by different gratings [65, 66]. This principle enables the use of an AOD to parallelize the illumination and simultaneously deflect the input light under different angles (figure 1(h)). While this comes at the cost of power reduction for each diffracted beam—a common shortcoming in each light parallelization approach—it can be compensated by simply increasing the input light. Several methods exist to generate multi-frequency signals, ranging from simply combining the outputs of different generators or programming a complex dynamic waveform through an arbitrary waveform generator.
In this chapter, we retrace the main results achieved with AODs in experimental neuroscience. Herein, we followed the evolution of the different AODs implementations and configurations, explaining how their different features and targeting strategies were exploited by neuroscientists in the past years. In detail, we collect the results in three separate sections: the first regards the imaging applications; the second concerns the uses of AODs to improve the capabilities of well-established imaging methods, such as light-sheet fluorescence microscopy (LSFM); the third reviews all the successes obtained with AODs for photostimulation of neuronal samples and optogenetics.
3.1. Imaging of neuronal populations with AODsThe first interest in using AODs for neuroimaging was driven by their scan rate advantage over GM-based scanners. With the simplest implementation of a single AOD, notable performances were reached in raster scans beyond video rates, i.e. above 30 Hz, both with single-photon [57] and multi-photon excitation [67, 68]. Another notable property of AODs led to the development of single-photon random-access fluorescence microscopes, where the excitation beam can be freely and quickly repositioned within the FOV [69]. For instance, by using voltage-sensitive dyes and Ca2+ indicators to monitor functional neuronal activity, multiple sites were imaged in μm-sized processes of cultured hippocampal neurons with up to 200 000 samples per second and a repositioning time between 3–5 μs. After that, with the introduction of a dispersion compensation scheme for ultrafast laser pulses [59], natural steps forward were moved toward AOD-based random-access multi-photon (RAMP) microscopy [70, 71], extending the range of applications. Among them, many different 2D and 3D scanning methods have been developed to concurrently or sequentially explore different regions of interest (ROIs) with high temporal and spatial resolution for structural imaging and functional neuronal activity recording, both for ex vivo and in vivo preparations. Figure 2(a) shows as examples, seven different targeting strategies: point-by-point, ribbon, snake and multi-3D-line scanning, chessboard and multi-layer multi-frame sampling, and multi-cube volumetric scanning [64]. Remarkable neural functional and structural investigations have been realized with 2D RAMP microscopes based on two crossed AODs [70–81]. Multi-ROI scan rates of 1 kHz or beyond [72, 75] have been demonstrated to track calcium activation in different cultured neuron populations and imaging large FOVs up to 0,5 × 0,5 mm2 [77]. Here, we report two examples of the structural and functional measurements presented in Iyer et al [71, 75] and Otsu et al [75] as typical examples of what is achievable with AOD-based 2D RAMP microscopes. Figure 2(b) displays the maximum intensity projection (MIP) of a CA1 pyramidal neuron, revealing many apical dendrites [63]. Recordings at 500 Hz of Ca2+ transients from single optical sections at selected sites are superimposed. Figure 2(c) shows the MIP of a Purkinje cell [75], obtained by a sequential raster scan of 40 optical sections spaced every 1 mm, while figure 2(d) illustrates a single-plane image of the apical dendrite and of a proximal oblique dendrite of a layer V pyramidal neuron. The red dots indicate the positions of optical calcium-activation recordings displayed in figure 2(e). The upper trace exhibits a depolarizing current step triggered by an early spike and a tonic discharge of additional spikes on top of a depolarized plateau, while the lower traces show fluorescence transients recorded along the dendrite.
Figure 2. RAMP imaging applications of AODs. (a) Example of seven 3D scanning methods developed for in vivo imaging with motion compensation. The red points, lines, surfaces and volumes represent the addressed ROIs. Reproduced from [64].CC BY 4.0. (b) MIP of a CA1 pyramidal neuron, revealing many apical dendrites. Recordings at 500 Hz of Ca2+ transients from a single optical section at selected sites are superimposed. Scale bar, 50 μm. Reproduced with permission from [71]. (c) MIP of a Purkinje cell, obtained by a sequential raster scan of 40 optical slices spaced every 1 μm. Scale bar: 50 μm. Reprinted from [75], Copyright (2008), with permission from Elsevier. (d) Single plane image of the apical dendrite and of a proximal oblique dendrite of a layer V pyramidal cell, the red dots indicate the positions of the optical recordings displayed in (e). Reprinted from [75], Copyright (2008), with permission from Elsevier. (e) Upper trace: a depolarizing current step triggered an early spike and a tonic discharge of additional spikes on top of a depolarized plateau. Lower traces: fluorescence transients recorded at the red dot positions in (d). Reprinted from [75], Copyright (2008), with permission from Elsevier. (f) 3D rendering of an AOL-based volumetric structural imaging of neuronal dendrites and spines over a 150 μm depth range, labelled with the fluorescent dye Alexa 594. Reprinted from [82], Copyright (2014), with permission from Elsevier. (g) 3D in vivo image of a dendritic segment of a selected GCaMP6f-labeled neuron in behaving mice recorded with the ribbon scanning method using 3D DRIFT AO. Red cube, 140 × 70 × 80 μm3. Reproduced from [64]. CC BY 4.0. (h) Longitudinal (left) and transverse (right) raw fluorescence scans (green) along the blue ribbon shown in (g), with motion artefacts elimination. Average Ca2+ responses along the ribbon during spontaneous activity (syn.) are colour-coded. Reproduced from [64]. CC BY 4.0.
Download figure:
Standard image High-resolution imageInterestingly, with two crossed AOD RAMP configuration, multi-beam illumination has also been investigated to parallelize the sampling of different ROIs. In particular, D'Angelo et al recorded in vitro the electrical activity from clusters of Purkinje cells [83] and cardiomyocytes with voltage-sensitive dyes [79].
The first attempts at using AODs for axial scanning enabled imaging and fluorescence lifetime imaging of neurons in mouse hippocampal tissue in the volume [84]. In detail, two planes of 100 × 100 μm, axially displaced by 40 μm were subsequently illuminated adjusting the frequency profile of the radio-signal driving the AODs, without moving the objective. Introducing an ETL or a piezo-scanner at the objective improved on this aspect but compromised the volumetric scan rate to 20–30 Hz for functional in vivo Ca2+ recording in mouse neocortex [85] and to 6 Hz for capturing sensory-evoked activity of the entire neurons within the developing brain of tadpoles [86].
Nevertheless, the full potential of this technique was achieved by employing two optically conjugated pairs of crossed AODs in 4-f configuration, as a 3D AOL [4, 63, 64, 82, 87–89]. This configuration supports repositioning speeds ranging from 30 μs down to 10 μs [88], which is important for capturing fast spontaneous neuronal microcircuit activity in the mouse cortex, and access volumes up to 1 mm3 [63]. The very high sampling speed of 3D RAMP has enabled in vivo functional imaging studies in behaving mice using Ca2+ indicators, even with motion compensation [4, 64, 88, 89]. Figure 2(f) shows a 3D rendering of in vivo AOL-based volumetric structural imaging of neuronal dendrites and spines in a 150 μm depth range, labelled with the fluorescent dye Alexa 594 [82]. Another representative example of 3D AOL-based RAMP imaging is presented in figure 2(g), which displays an in vivo dendritic segment of a selected GCaMP6f-labeled neuron in a behaving mouse [64] recorded with the 3D ribbon scanning method in a volume of 140 × 70 × 80 μm3. Figure 2(h) shows the longitudinal (left) and transverse (right) raw fluorescence scans (in green) and the average Ca2+ responses during spontaneous activity (in colour) [64], acquired along the blue ribbon denoted in g) and corrected for motion artefacts.
Finally, it is noteworthy the AODs' driving solution recently adopted by Villette et al [90] and Akemann et al [91], where the frequency- and amplitude-modulation of the acoustic wave is synchronized with the pulsed laser clock. In such a way, the focus drift associated with chirped AO gratings is abolished, and only two AODs are needed to access the sample very rapidly in 3D [92]. In particular, they used the submillisecond temporal resolution provided by this approach to probe cortical and hippocampal neurons in awake-behaving mice expressing high-gain voltage indicators [90] at 15 kHz, and GCaMP6f [91] at 40 kHz, respectively.
3.2. AOD in synergy with imaging systemsRecently, AODs have been used to enhance the capabilities of well-established imaging techniques. For instance, Tsyboulski et al [93] presented an innovative frequency-multiplexing imaging strategy based on AODs. In particular, they demonstrated the ability to encode multiple excitation spots with specific modulation frequencies and discussed promising perspectives for very fast monitoring of multisite calcium signals in brain tissues. Furthermore, 1D AOD-based slit-scanning has been used in combination with micro-optical sectioning tomography to confocally image thick mouse brain samples [94]. Nevertheless, AODs have given their largest contribution to another foundational technique: the LSFM. In detail, AODs have been successfully used to generate a scanning light sheet that illuminates sample planes in the fastest way possible, up to 0.8 million frames per second [95]. Such speed enabled plane-by-plane volumetric structural and functional imaging of ex vivo tissues and even of entire in vivo animals, including Caenorhabditis elegans, at tens of Hertz volume rates. In addition, using a crossed configuration of 2 AODs in the excitation arm and an acoustic varifocal lens in the detection path has allowed the realization of a fast inertia-free volumetric LSFM [96]. In the same context, single AODs have been successfully exploited to pivot the illumination beam and remove striping artefacts from the collected neuronal functional images in zebrafish [97] and mice [98], a well-known problem in LSFM [99] caused by scattering and/or absorption of light incident upon the sample through uneven lateral illumination. Notably, in these experiments, enhancing angular diversity in the illumination direction through simultaneous multibeam and/or rapid scanning by AOD has demonstrated a reduction and even removal of striping. An example of such artefacts is shown in the upper panel of figure 3(a) where a sample of 15 μm polystyrene beads embedded in 1% agarose gel and immersed in water is imaged by illuminating with 1 (1LS) or 7 (7LS) static light sheets coming from different angles or with a single pivoted plane (SM). The green arrows indicate examples of striping artifacts almost suppressed in the 7LS and SM cases. The insets show the fluorescence intensity profiles along the y-axis, averaged over 6 μm around the white dotted line, clearly illustrating how the beads occlude the light-sheet propagation, affecting the image quality, and demonstrating that pivoted illumination significantly reduced striping artefacts. Figure 3(b) shows an ex vivo image of a cleared mouse brain expressing the fluorescent protein tdTomato where striping has been efficiently removed by exploiting such AOD beam pivoting in a confocal LSFM.
Figure 3. LSFM imaging applications of AODs. (a) LSFM images obtained with different AOD-generated light-sheet configurations (1 or 7 static light sheets at different angles and single-plane sweeping mode). The sample contains 15 μm polystyrene beads embedded in 1% agarose gel immersed in water. The insets show the fluorescence intensity profiles along the y-axis, averaged over 6 μm around the white dotted line. The line plots depict how the background becomes more uniform with an increasing number of illumination directions. The green arrows indicate the examples of striping artifacts in the three panels. White scale bar 50 μm. Reproduced from [97]. CC BY 4.0. (b) Confocal LSFM image of an area of a mouse brain expressing tdTomato, obtained by AOD-pivoted illumination of the sample.
留言 (0)