
記住我

Diabetes mellitus, characterized by hyperglycemia resulting from defects in insulin secretion, insulin action, or both, has been one of the most common metabolic diseases worldwide,1 in which type 2 diabetes mellitus (T2DM) is the predominant subtype, and accounts for up to 90%-95%.2 T2DM is recognized as one of risk factors for fractures3 and individuals with T2DM have 69% increased fracture risk than those without diabetes.4 However, patients with T2DM usually have normal or even higher bone mineral density (BMD)5 which may be related to their unique bone metabolism.6
The mechanisms for the increased fracture risk and special bone metabolism of T2DM patients are not fully established, but it is likely to be multifactorial, in which diabetic neuropathy is one of the most important factors. Diabetic neuropathy is a common complication of diabetes, and can be divided into several subtypes, including distal symmetric polyneuropathy (DSPN), autonomic neuropathies, atypical neuropathies, etc.7 A retrospective cohort study involving 2 798 309 older male veterans showed that as much as 21% of the increased fracture risk in T2DM patients can be explained by diabetic neuropathy, which is the highest contributing factor for the increased fracture risk of T2DM patients during all examined diabetic complications.8 The increased fracture risk in the DSPN patients is attributed to different mechanisms. First, diabetic neuropathy is usually related to prolonged uncontrolled glucose level which may influence bone strength by inducing the accumulation of advanced glycation end products (AGEs) in bone and increasing the production of nonenzymatic cross-links within collagen fibers.9 Second, DSPN is related to at least two-fold increase in fall risk by impairing the ability of balancing.10 Third, the nervous system has been showed to regulate bone metabolism directly, including central11 and peripheral nervous systems.12 Sensory nerve is one of the most important parts of peripheral nerve system, and bones have abundant sensory nerves that frequently innervate trabecular bone, periosteum, and fracture callus.13 Patients with sensory nerve dysfunction or loss have increased fracture risk and significantly reduced bone regeneration after injury.14 The peripheral nerve fibers can regulate bone metabolism directly15 or by their neurotransmitters.16 One study showed that a small molecule, which can increase prostaglandin E2 (PGE2) level in the bone locally, could significantly boost bone formation, however this effect was absent in EP4 (PGE2 receptor in sensory nerves) knockout mice.15 Another study showed that mice lacking Sema3A in neurons (Sema3asynapsin−/−) had lower bone mass, accompanied by decreased number of sensory innervations on trabecular bone.17 These results indicate that sensory nerves on bone may control bone homeostasis and promote bone regeneration. Sensory nerves also contribute to the chondrogenic differentiation during limb growth in embryonic development by regulating calcitonin gene-related peptides (CGRPs) and substance P (SP).16 The peripheral nervous system may also regulate bone metabolism through neuroregulation of skeletal vascular supply.18 In human bones, 95% of nerves are associated with blood vessels19 and angiogenesis is a key component of both bone modeling and remodeling.20 Sensory neuropeptides CGRP and substance P are highly potent vasodilators,18 can also promote angiogenesis21 and thus regulate bone metabolism indirectly.
Available studies have shown that about half of T2DM patients may develop DSPN during the course of T2DM,22 and thus it is important to recognize the influence of DSPN on bone metabolism in T2DM population. In this study, the characteristics of bone metabolism and fracture risk were evaluated in T2DM patients with DSPN and their related risk factors were explored.
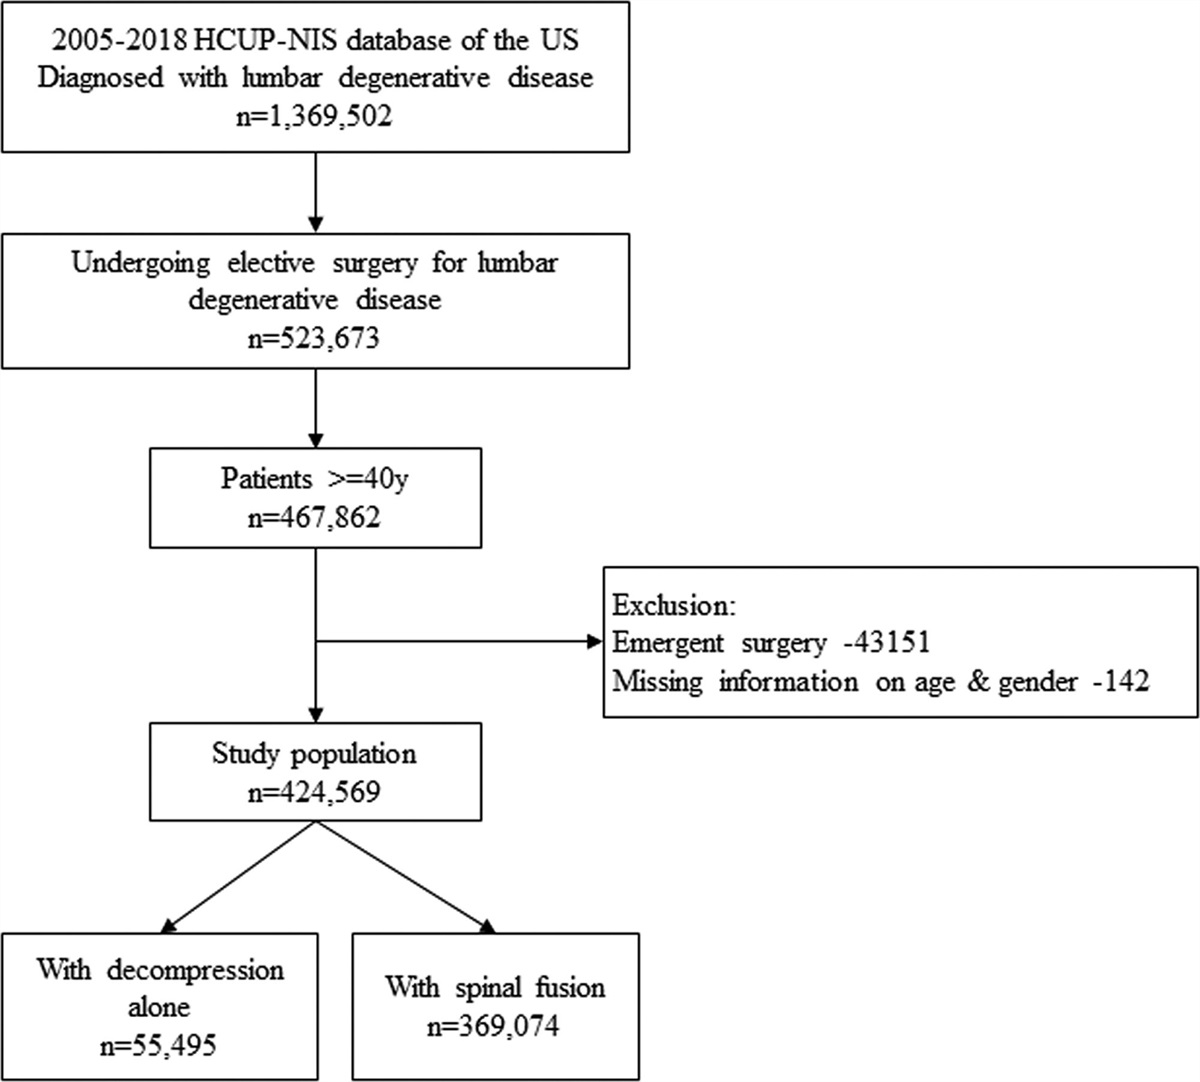
2. METHODS 2.1. ParticipantsThis is an observational cross-sectional study. This study was approved by the Ethics Committee of Shanghai Tongji Hospital, School of Medicine, Tongji University (No. KYSB-2018-136). All participants signed the informed consent.
BMD usually peaks at the age of 35 to 40 years, and thus the enrolled patients older than 40 years were recruited into present study. A total of 198 T2DM individuals were recruited into this study from January 2017 to December 2020 in Shanghai Tongji Hospital. There were 109 individuals with DSPN and 89 individuals without DSPN. The inclusion criteria were as follows: (1) patients were older than 40 years; (2) patients were males; (3) patients had a history of T2DM. Exclusion criteria were as follows: (1) there was a history of fractures in prior 6 months (fractures can influence bone turnover markers [BTMs]); (2) patients had secondary osteoporosis (such as hyperthyroidism, parathyroidism, Cushing syndrome, hypogonadism, growth hormone deficiency); (3) patients had malignant tumors; (4) patients had autoimmune diseases; (5) there was liver dysfunction (alanine aminotransferase >80 U/L or aspartate aminotransferase >70 U/L or glutamyl transferase >90 U/L) or renal dysfunction (estimated glomerular filtration rate <90 mL/min/1.73 m2); (6) patients were treated with drugs that can affect bone metabolism such as thiazolidinediones, sodium-glucose cotransporter, glucocorticoid, thyroid hormones, estrogen, and antiosteoporosis drugs.
2.2. Neuropathy assessmentPatients with DSPN are evaluated by strict clinical and sensory thresholds. The Toronto Clinical Neuropathy Score (TCNS) and the foot vibration perception threshold (VPT) were employed to assess DSPN.23 The sensory symptoms and clinical signs of DSPN were combined in scores.
TCNS, involving symptoms, reflexes, and sensory, is a continuous variable ranging from a minimum of 0 (no neuropathy) to a maximum of 19 points. The TCNS is shown in Table 1. Six points are derived from symptoms, eight from lower limb reflexes, and five from sensory examination distally at the toes. All participants were evaluated by one examiner, and classified according to their scores as no neuropathy (0-5), mild neuropathy (6-8), moderate neuropathy (9-12), and severe neuropathy (>12).
Symptom scores Reflex scores Sensory test scores Foot Knee reflexes Pinprick Pain Ankle reflexes Temperature Numbness Light touch Tingling Vibration Weakness Position Ataxia Upper-limb symptomsSensory testing was performed on the first toe. Symptom scores: present = 1; absent = 0. Reflex scores: absent = 2; reduced = 1, normal = 0. Sensory test score: abnormal = 1. normal = 0. Total scores range from normal = 0 to maximum of 19.
TCNS = Toronto Clinical Neuropathy Score.
VPT is an important method of quantitative sensory examination. It is simple, easy, noninvasive, and reproducible and plays an important role in the early diagnosis and assessment of diabetic peripheral neuropathy.24 The TCNS has been validated against VPT. It is performed on both feet using the validated digital VPT device named sensiometer A200 (ChinaCache, Beijing, China) to confirm the presence of DSPN. Scoring was performed twice according to the manufacturer’s instructions, and the average was calculated. Patients were classified as normal group (VPT ≤15 V on both feet), mild abnormality (VPT 16-24v on both feet,) or severe abnormality (VPT ≥25V on either foot).
Thus, participants with neuropathy (type 2 diabetes mellitus with distal symmetric polyneuropathy (T2DN+); n = 109) were defined by a combination of TCNS score ≥6 and VPT ≥16, while participants with TCNS score ≤5 and VPT ≤15 on both feet were considered neuropathy negative (type 2 diabetes mellitus without distal symmetric polyneuropathy (T2DN–); n = 89).
2.3. Demographics and clinical characteristicsThe demographics and clinical characteristics (including age, weight, height, body mass index [BMI], status of current smoking, current drinking, and others) were collected from all the participants. BMI (kg/m2) was calculated by dividing weight (kg) by the square of height (m2). The smoking status means currently smoking. The status of drinking was defined as drinking more than or equal to three or more units of alcohol daily (one unit of alcohol means 8 g of alcohol).
2.4. Biochemical parameter assessmentThe peripheral venous blood was collected from each subject after 8-hour fasting. The following parameters were detected in all the participants: liver and kidney function, lipid profile (total cholesterol [TCH], triglyceride [TG], low-density lipoprotein [LDL] and high-density lipoprotein [HDL]), glycosylated hemoglobin (hemoglobin A1c, HbA1c), BTM, alkaline phosphatase (ALP), bone ALP (BALP), procollagen type I intact N-terminal (P1NP), osteocalcin (OC), tartrate-resistant acid phosphatase-5b (TRACP-5b), c-terminal cross-linking telopeptide of type I collagen (CTX), calcium (Ca), corrected Ca and phosphorus (P), total protein, albumin, hemoglobin (Hb), fasting blood glucose (FBG), fasting insulin (FIS), C-peptide, Home-IR, and atherosclerosis index. The levels of thyroid hormone, thyroid stimulating hormone, parathyroid hormone, sex hormone (estrogen and progesterone), vitamin D, growth hormone, and insulin-like growth factor-1 were also detected in all the participants. Liver function, renal function, lipid profiles, and electrolytes were detected by an automatic chemistry analyzer using serum. HbA1c was detected by high-performance liquid chromatography using whole blood. Serum P1NP, OC, and CTX were measured by electrochemiluminescence assay (Roche Diagnostics). Serum BALP and TRACP-5b were measured by enzyme immunoassay (IDS Ltd coefficient of variation of intra- and inter-assay <10%). ALP was measured by ALP assay kit. Hb was detected with the blood cell analyzer. Total protein and albumin were detected by biochemical analyzer. Insulin and C-peptide are detected by chemiluminescence particle immunoassay. Corrected Ca (mmol/L) was calculated according to the following formula: Ca (mmol/L) + 0.02 × [40-albumin (g/L)]. Atherosclerosis index was calculated with the following formula: [TC (mmol/L)-HDL (mmol/L)/HDL (mmol/L)]. Home-IR was calculated according to the following formula: [FBG (mmol/L) × FINS (μU/mL)].
2.5. BMD by dual-energy x-ray absorptiometryThe BMD at lumbar spine L1-L4, femur neck, and total hip was detected by dual-energy x-ray absorptiometry (DEXA, HOLOGIC Discovery; coefficient of variation <1%) in all the participants.
2.6. WHO FRAX and FRAX-adjustment scoresThe probability of hip fracture in 10 years and any important fracture probability in 10 years (clinical spine, forearm, hip, or shoulder fracture) by World Health Organization (WHO) Fracture Risk Assessment Tool (FRAX) were calculated in all the participants. The FRAX algorithm includes femoral neck BMD T-score, age, sex, BMI, previous history of fracture, parental history of hip fracture, current smoking, recent use of corticosteroids, presence of rheumatoid arthritis (RA), and at least three alcoholic beverages per day. T2DM is a risk factor for osteoporotic fracture, but not a direct input variable to FRAX. There are several proposals to improve the performance of FRAX for those with T2DM. Three methods provided in the studies were employed to calculate the FRAX-adjustment,25 including (1) the RA input to FRAX; (2) reducing the femoral neck T-score input to FRAX by 0.5 SD; (3) increasing the age input to FRAX by 10 years. The fracture risk assessment scale was used for fracture risk assessment in each participant.
2.7. Statistical analysisQuantitative data are represented as mean ± SD. Categorical variables are described as number and percentages. The quantitative data with normal distribution were compared with independent sample t test, and those without normal distribution with Wilcoxon rank sum test. The categorical variables were compared with chi-square test. Univariate correlation analysis was employed to analyze whether each variable was associated with the BMD of lumbar L1-L4 and the probability of hip fracture in 10 years. Variables with possible associations (p < 0.1 according to the univariate correlation analysis) were included in multivariate regression analysis to adjust for potential confounding factors. The results of multivariate regression analysis are expressed in the form of forest map. A value of two-tailed p < 0.05 was considered statistically significant. Statistical analysis was conducted with Statistical Package for the Social Science version 20.0 (SPSS; IBM, Armonk, NY).
3. RESULTSIn our study, 80% of patients with diabetic neuropathy experienced pain, numbness, and weakness in daily life. Most of these symptoms were found in the feet, only a small number of participants had upper-limb symptoms, and 75% had decreased temperature and pain sensation. Almost all patients had decreased knee and ankle reflexes, but <10% of patients had ataxia. The mean TCNs scores were 6 to 8 in the participants, which is suggestive of mild neuropathy.
Comparing to the T2DN− patients, T2DN+ patients had longer course of T2DM, and longer duration of drinking. Moreover, T2DN+ patients had higher HbA1c level (9.67 ± 2.16 vs 8.66 ± 2.14, p = 0.0053), higher FBG (9.17 ± 3.69 vs 7.85 ± 3.16, p = 0.0242) and lower serum P level (1.16 ± 0.16 vs 1.22 ± 0.18, p = 0.0233) as compared to T2DN− patients (Table 2). Meanwhile, blood lipid profile, liver function, renal function, islet function (serum insulin and C-peptide), and insulin resistance were comparable between two groups.
Table 2 - Baseline characteristic of T2DN− and T2DN+ patients Factors T2DN−Normal distribution values are shown as means ± SD or number (percentage). Values with non-normal distribution are expressed as median (quartile).
ACR = urinary microalbumin creatinine ratio; AI = atherosclerosis index; ALT = alanine aminotransferase; AST = aspartate aminotransferase; BMI, body mass index; Ca = calcium; Corrected Ca = corrected calcium; CREA = creatinine; Duration = diabetes course; FBG = fasting blood glucose; FFA = free fatty acids; FIS = fasting insulin; GGT = γ- glutamyl transferase; Hb = hemoglobin; HbA1c = glycosylated haemoglobin; HCY = homocysteine; HDL = high density lipoprotein; Home-IR = insulin resistance index; LDL = low density lipoprotein; P = phosphorus; TCH = total cholesterol; TG = triglyceride; T2DN+ = type 2 diabetes mellitus patients without distal symmetric polyneuropathy; T2DN- = type 2 diabetes mellitus patients with distal symmetric polyneuropathy.
In addition, T2DN+ patients had lower CTX level (0.32 ± 0.19 vs 0.38 ± 0.21 ng/mL, p = 0.0378) and higher BALP level (15.28 ± 5.56 vs 12.28 ± 4.41 μg/mL, p = 0.0025), but the levels of TRACP-5b, total ALP, P1NP, and OC were comparable between two groups (Table 3). T2DN+ patients had higher BMD of lumbar L1-L4 (1.05 ± 0.19 vs 0.95 ± 0.37, p = 0.0273) but there was no significant difference in the femur neck and total hip between T2DN− individuals and T2DN+ individuals (Table 3). When the fracture risk was evaluated by FRAX, the probability of hip fracture was higher in T2DN+ patients (0.98 ± 0.88 vs 0.68 ± 0.63, p = 0.0092) than in T2DN− patients (Table 3). However, there was no significant difference in the FRAX-adjustment between two groups (Table 3).
Table 3 - Bone metabolism-related markers of T2DN− and T2DN+ patients Factors T2DN−Values are shown as means ± SD or number (percentage).
ALP = alkaline phosphatase; BALP = bone alkaline phosphatase; CTX = C-terminal cross-linking telopeptide of type I collagen; DXA = dual-energy x-ray absorptiometry; FRAX = WHO Fracture Risk Assessment Tool; FRAX-adjustment = three adjustments applied to FRAX with diabetes25; LS = Lumar L1-L4; OC = osteocalcin; P1NP = procollagen type I intact N-terminal; RA = rheumatoid arthritis; TRACP-5b = tartrate-resistant acid phosphatase-5b; T2DN+ = type 2 diabetes mellitus patients without distal symmetric polyneuropathy; T2DN- = type 2 diabetes mellitus patients with distal symmetric polyneuropathy.Univariate correlation analysis showed higher BMD of lumbar L1-L4 and increased hip fracture risk in T2DN+ individuals. The BALP level (coef =−0.054, p = 0.038), CTX level (coef = −2.28, p = 0.001), and hip fracture risk (coef = −1.02, p < 0.001) were negatively related to the BMD of L1-L4 (Table 4). As for the risk of hip fracture evaluated by FRAX, age (coef = 0.035, p < 0.001), use of insulin (coef = 0.31, p = 0.015), and levels of BALP (coef = 0.031, p = 0.017) and CTX (coef = 0.7, p = 0.047) were positively related to the risk of hip fracture (Table 4), but the BMDs of L1-L4 (coef = −0.27, p < 0.0001), femoral neck (coef = −0.71, p < 0.0001), and total hip (coef = −0.62, p < 0.0001) were negatively related to the risk of hip fracture (Table 4).
Table 4 - Univariate correlation analysis of the potential confounders of BMD and hip fracture Factors LS T-score Hip fracture, % Coef p 95% CI Coef p 95% CI Age, y 0.016 0.369 (−0.019 to 0.051) 0.035 <0.001 (0.018-0.050) Duration, y 0.0058 0.759 (−0.031 to 0.043) 0.012 0.178 (−0.0055 to 0.029) Hypertension No Yes 0.36 0.170 (−0.16 to 0.88) −0.22 0.071 (−0.46 to 0.019) Previous fracture No Yes −1.14 0.294 (−3.29 to 1.01) 0.45 0.409 (−0.62 to 1.52) Current smoking No Yes 0.10 0.702 (−0.42 to 0.63) 0.074 0.555 (−0.17 to 0.32) Current drinking No Yes 0.12 0.710 (−0.52 to 0.75) −0.082 0.587 (−0.38 to 0.22) Use of insulin No Yes −0.10 0.711 (−0.64 to 0.44) 0.31 0.015 (0.062 to 0.56) Height shorting No Yes −0.55 0.189 (−1.37 to 0.27) −0.14 0.500 (−0.55 to 0.27) BALP, μg/mL −0.054 0.038 (−0.11 to −0.0031) 0.031 0.017 (0.0055-0.058) CTX, ng/mL −2.28 0.001 (−3.62 to −0.93) 0.70 0.047 (0.0087-1.39) AST, mmol/L −0.0086 0.313 (−0.025 to 0.0082) 0.0042 0.268 (−0.0033 to 0.012) CREA, μmol/L 0.0012 0.891 (−0.016 to 0.019) 0.0049 0.194 (−0.0025 to 0.012) P, mmol/L 0.29 0.714 (−1.28 to 1.86) −0.44 0.183 (−1.10 to 0.21) HbA1c, % −0.017 0.779 −0.14 to 0.10 0.044 0.088 (−0.0066 to 0.095) Hip fracture, % −1.02 <0.001 (−1.29 to −0.73) /
留言 (0)