
記住我


The definition of the wound area gives the principal limit of the Deepskin dataset. Since there is not a standardized set of criteria for the wound area definition, its reliability is left to the clinical needs. In our previous work, we trained a convolutional neural network model to segment the regions involving only the wound bed areas. In contrast, the Peri-ulcer Skin Viability and Edges items for the PWAT estimation involve the description of the peri-wound area, which is excluded by our segmentation mask.
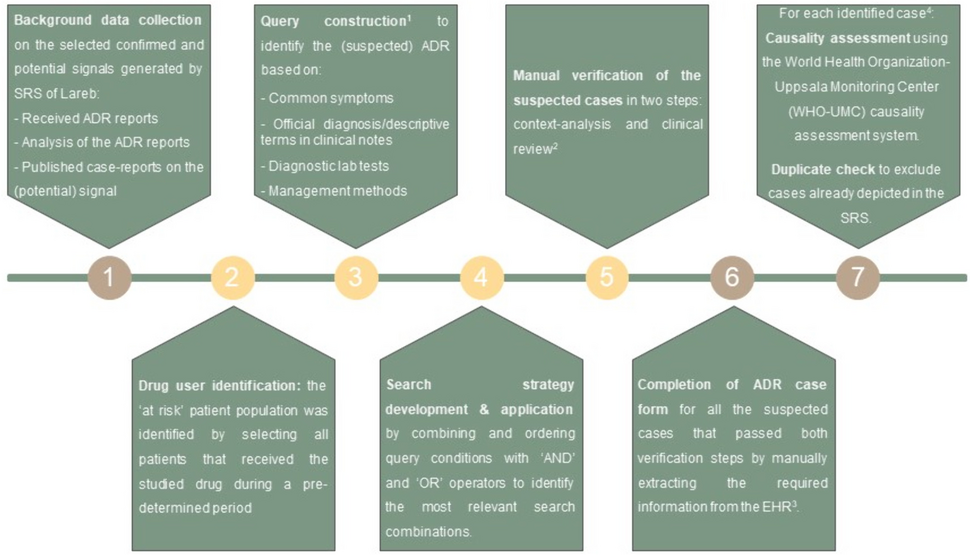
In this work, we implemented a second step of automated image processing for the identification of the peri-wound areas, starting from the segmentation masks generated by our model. Using a combination of erosion and morphological dilation operators, keeping fixed the size of the structuring element (kernel) involved, we extracted for each image the associated peri-wound mask, i.e.
$$_=\left(_\oplus k\right)-\left(_\ominus k\right)$$
where ⊕ and ⊖ denote the dilation and erosion operators between the wound mask (M) and the kernel k, respectively. We used an ellipse shape for the kernel, with a dimension of 3 × 3. An example of the resulting image processing is shown in Fig. 2.
Fig. 2
Example of segmentation masks used for wound identification. a Raw image extracted from Deepskin dataset. b Wound segmentation mask generated by automated neural network model. c Peri-wound segmentation mask obtained applying morphological operators on wound mask
Wound featuresThe quantification of the items related to the PWAT estimation involves both the wound and peri-wound areas. Since only 1/8 of PWAT sub-items involves the peri-wound area, we independently performed the features extraction on both the ROIs. In this way, we aimed to maximize the informative power of the features extracted from the wound area, minimizing the putative confounders, but preserving the information related to the peri-wound area.
Color featuresWe extracted the average and standard deviation of RGB channels for each wound and peri-wound segmentation. This set of measures aims to quantify the appearance of the wound area in terms of redness and color heterogeneity.
We converted each masked image into the corresponding HSV color space. For each channel, we extracted the average and standard deviation values. The HSV color space is more informative than the RGB one since it takes care of different light exposition (saturation). In this way, we monitored the various conditions in which the images were acquired.
Both these two sets of features aim to quantify the necrotic tissue components of the wounds. The necrotic tissue, indeed, could be modeled as a darker component in the wound/peri-wound area, which alters the average color of the lesion. The Necrotic Tissue type and the Total Amount of Necrotic Tissue involve 2/8 items in the PWAT estimation.
Redness featuresThe primary information on the healing stage of a wound can be obtained by monitoring its redness (erythema) compared to the surrounding area. Several redness measurements are proposed in literature [22], belonging to different medical fields and applications. In this work, we extracted two measures of redness, validated in our previous work [23] on a different image processing topic.
The first measure was proposed by Park et al. [20], and involves a combination of the RGB channels, i.e.,
$$Rednes_=\frac\sum_^\frac_-_-_}_+_+_\right)}$$
where R, G, and B are the red, green, and blue channels of the masked image, respectively, the n value represents the number of pixels in the considered mask. This measure emphasizes the R intensity using a weighted combination of the three RGB channels.
The second measure was proposed by Amparo et al. [19], and involves a combination of the HSV channels, i.e.,
$$Rednes_=\frac\sum_^_\times _$$
where H and S represent the hue and saturation intensities of the masked image, respectively. This measure tends to be more robust against different image light expositions.
Both these features were extracted on the wound and peri-wound areas independently. Redness estimations could help to quantify the Peri-ulcer Skin Viability, Granulation Tissue Type, and Necrotic Tissue Type, which represent 3/8 items involved in the PWAT estimation.
Morphological featuresWe measured the morphological and textural characteristics of the wound and peri-wound areas by computing the 13 Haralick's features [21]. Haralick's features are becoming standard texture descriptors in multiple medical image analyses, especially in the Radiomic research field [24,25,26,27,28]. This set of features was evaluated on the grey-level co-occurrence matrix (GLCM) associated with the grayscale versions of the original images, starting from the areas identified by our segmentation models. We computed the 13 standard Haralick's features, given by energy, inertia, entropy, inverse difference moment, cluster shade, and cluster prominence. Using textural elements, we aimed to quantify information related to the Granulation Tissue types and Amount of Granulation Tissue, which are 2/8 items of the total PWAT score.
Regression pipelineWe started the regression analysis by standardizing the distribution of the extracted features. Each distribution of features belongs to a different domain of values, and to combine them, we need to rescale all the values into a common range. We rescaled the distributions of features using their median values, normalizing according to the 1st and 3rd quantiles, i.e., a robust scaling algorithm, minimizing the dependency from possible outliers. Both medians and quantiles were estimated on the training set and then applied to the test set to avoid cross contamination.
Starting from the processed features, we used a penalized Lasso regression model [29] to predict the PWAT clinical scores. Lasso regression is a regularized linear regression variant with an additional penalization component in the cost function [30]. In our simulations, we used a penalization coefficient equal to 10-2. We split the complete set of data into train/test sets using a shuffled tenfold stratified cross-validation: in this way, we can ensure a balance between classes at each subdivision. The model was trained on a subset (90%) of data, and its predictions were evaluated on the remaining test set (10%), at each fold.
留言 (0)