
記住我


This phase of development aimed to conduct psychometric analysis of the final version of the developed scale to validate its use in a non-clinical community sample of vegetarians and vegans. In doing so, we elected to undertake exploratory factor analysis to discover the underlying factor structure of the V-EDS in separate groups of vegetarians and vegans. It is expected that the V-EDS will support good to excellent initial psychometric properties.
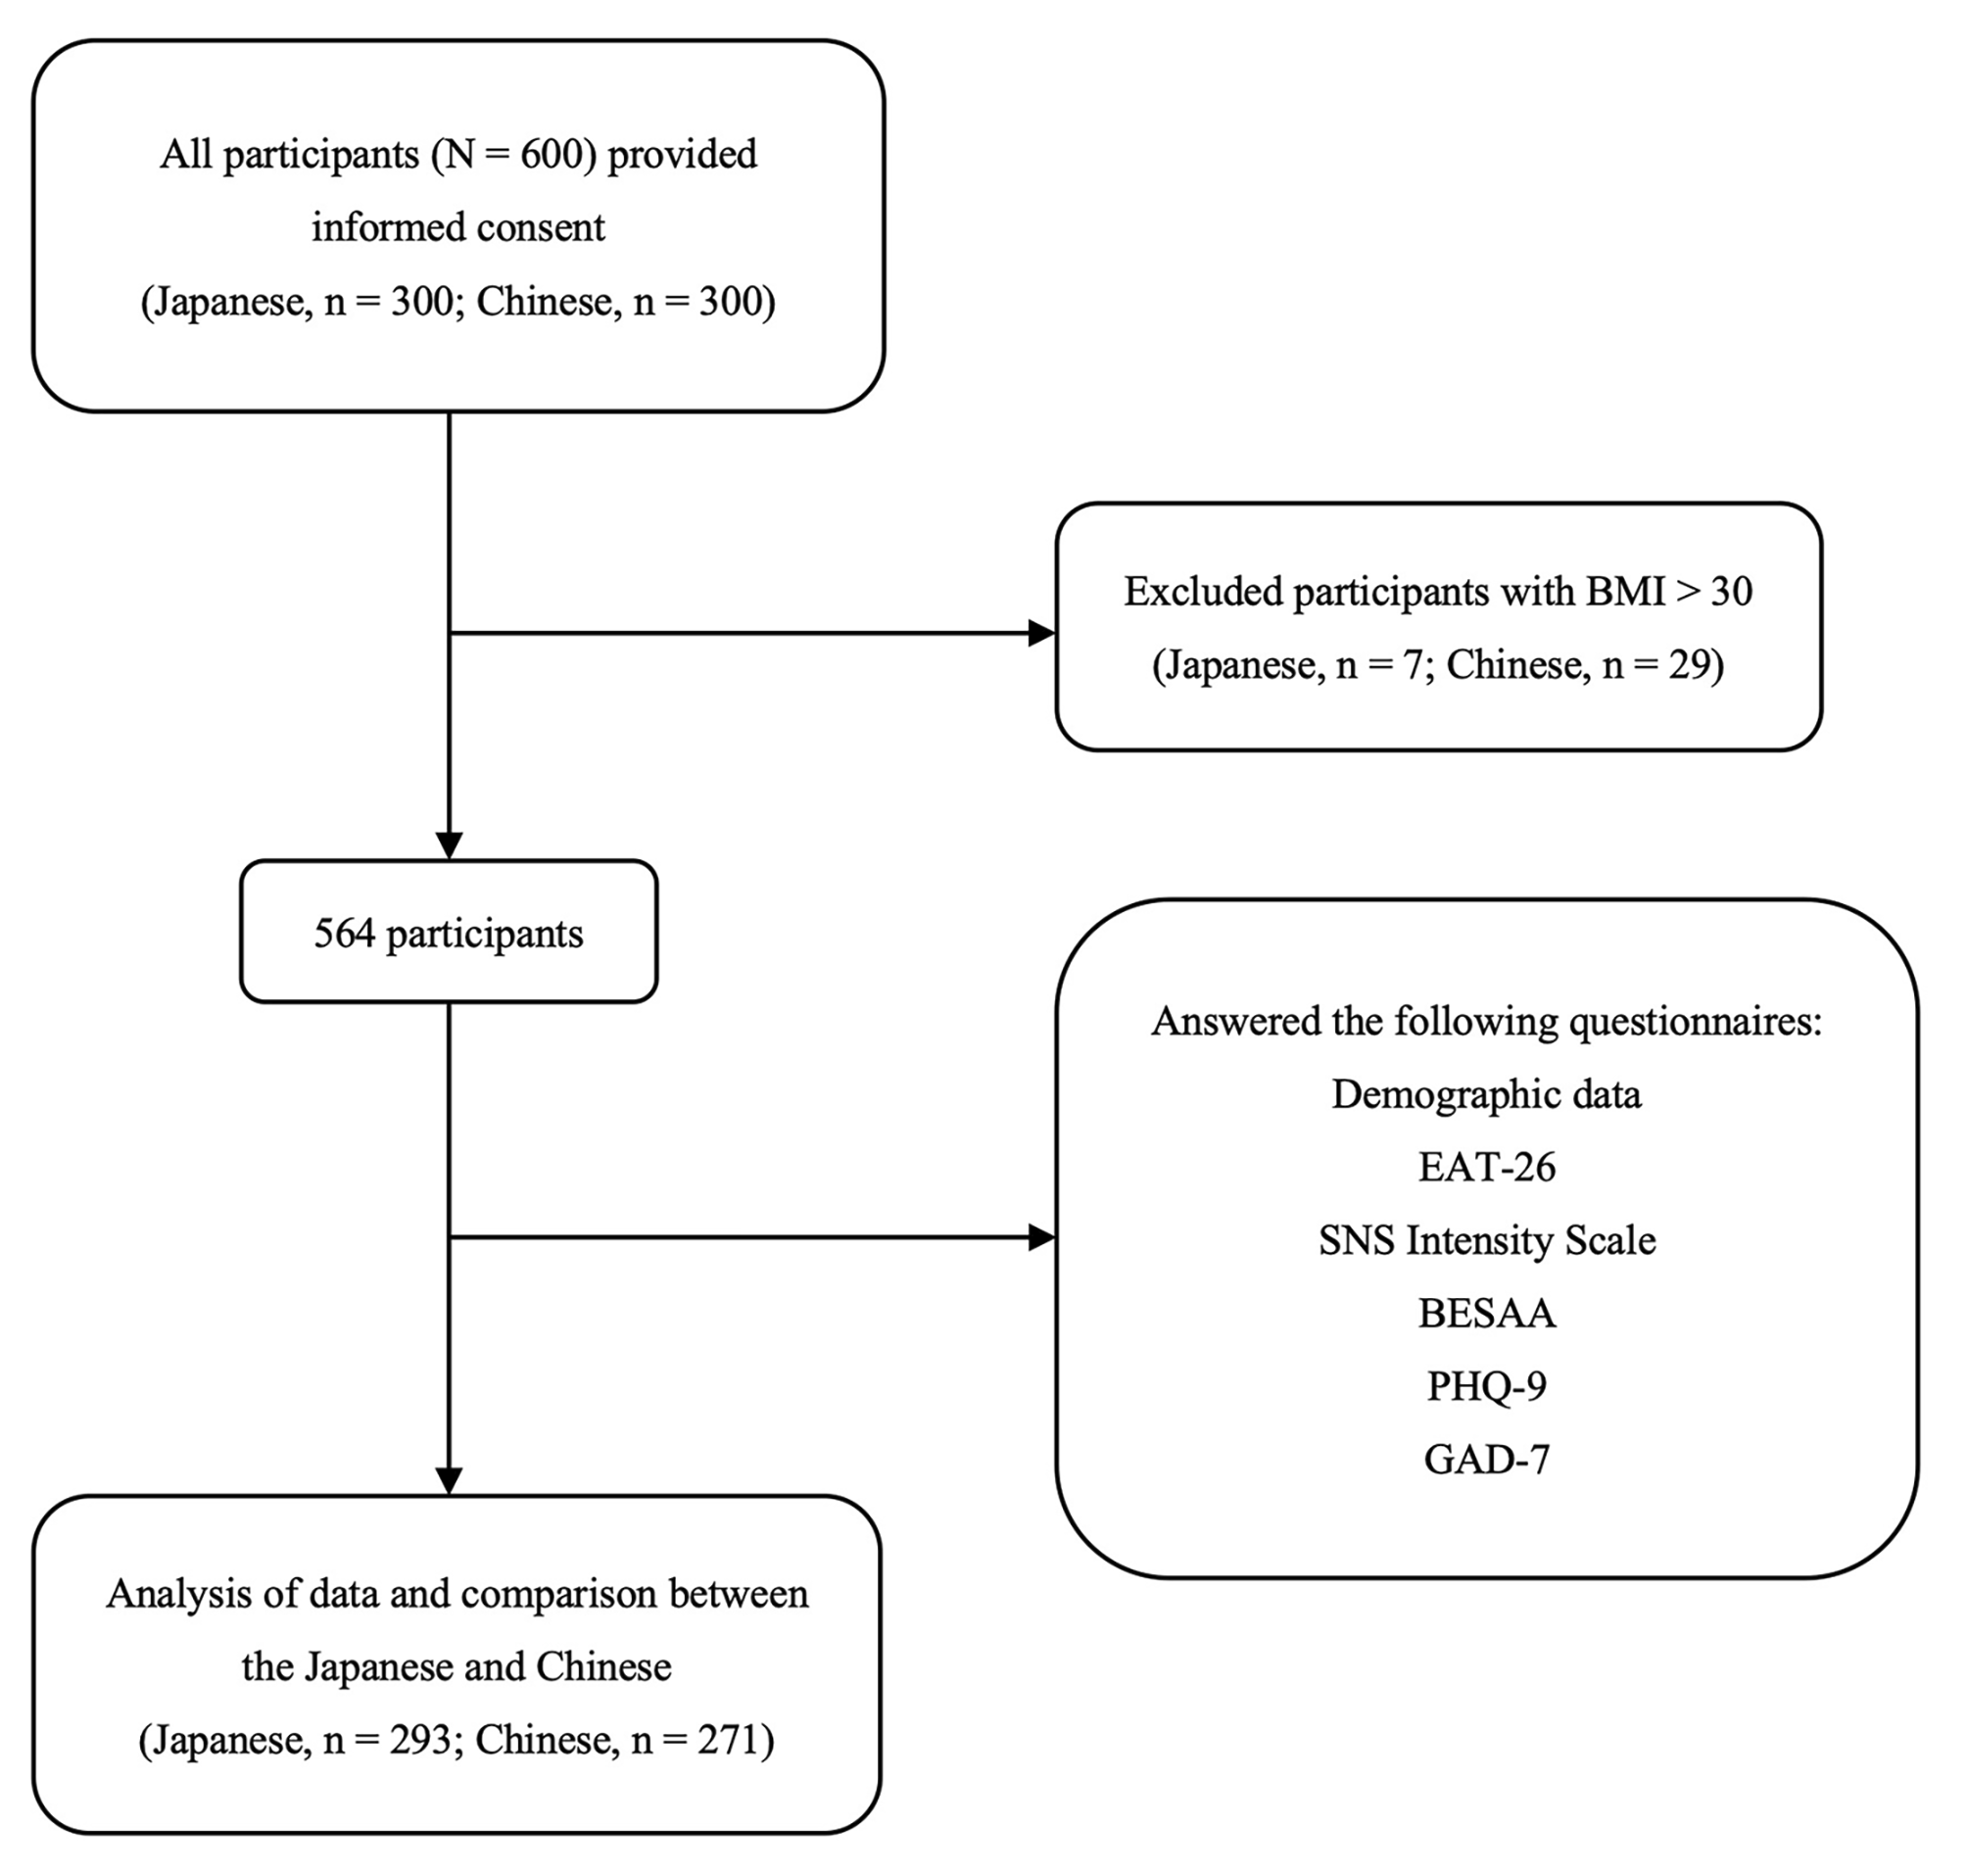
MethodsParticipantsA total of 1095 participants were recruited through social media advertisements and participant recruitment databases to take part via an online survey. Participants were required to adhere to identical inclusion criteria as per Phase 3, with meat-reducers and omnivores excluded from all analyses (n = 445). This resulted in a final sample of 650 participants (vegan = 405, vegetarian = 245). A smaller subtest of the sample (n = 71, 10.9%) took part in a 14-day test–retest reliability study comprising a further 22 vegetarian and 49 vegan participants.
MeasuresSimilar to Phase 3, participants responded to demographic characteristic information and dietary adherence questions.
The final Vegetarian Vegan Eating Disorder Screener (V-EDS) is an 18-item self-report screening tool designed to assess the unique eating disorder symptomology of vegetarians and vegans over the past seven days (see Additional file 2). The V-EDS consists of 6 dietary characteristic items designed to provide important background information to the respondent’s dietary attitudes, rated along a 5-point Likert scale from strongly disagree to strongly agree. The dietary characteristic items are followed by 12 behavioural and attitudinal items (e.g., “Has the way you think about food become intrusive?”) designed to measure the presence of eating disorder pathology, rated along a 5-point Likert scale from no days to every day. Higher scores on the V-EDS indicated greater eating disorder pathology.
The Eating Disorder Examination-Questionnaire (EDE-Q; [20]) is a self-report tool designed to measure the attitudinal and behavioural symptoms of eating disorders over the past 28 days. The EDE-Q comprises 28 items, including 22 attitudinal items and six open-response behavioural frequency items, whereby participants respond to each attitudinal item (e.g., “Have you had a definite fear of losing control over eating?”) along a 7-point Likert scale ranging from not at all to markedly. A global score is calculated by summing the four subscales: Eating Concern, Weight Concern, Shape Concern, and Restraint, and dividing by four (i.e., the number of subscales), with higher scores indicating greater eating disorder pathology. The EDE-Q has demonstrated good internal consistency, with a score of 0.96 in the total sample for the present study. As the EDE-Q is the most widely recognised clinical tool and forms part of the eligibility criteria for Medicare-subsidised treatment in Australia, it was included in the present study to assess the convergent validity of the V-EDS.
The Depression, Anxiety, and Stress Scale (DASS-21; [35]) is a 21-item self-report scale designed to assess the negative emotions associated with depression, anxiety, and stress over the past seven days. Each negative emotional subscale contains seven items and are responded to along a 4-point Likert scale from never to almost always. A subscale score is calculated by summing the seven associated items and multiplying by two, with higher scores indicating greater negative emotions. The DASS-21 has demonstrated good internal consistency, with a score of 0.93, 0.84, and 0.89 for the Depression, Anxiety, and Stress subscales, respectively, in the total sample for the present study. As depression traits are shown to have moderate divergent patterns with eating disorders [36], the DASS-21 was included in the present study to examine the divergent validity of the V-EDS.
ProcedureAs with Phase 3, participants were advertised with a link to the online survey and presented with the Explanatory Statement to provide informed consent. Participants then responded to demographic characteristic information, their weight and height to calculate BMI, and the V-EDS, EDE-Q, and DASS-21 in randomised order. Finally, participants noted if they had ever received an eating disorder or mental health diagnosis from a health professional and were given an opportunity to enter a gift card draw. Identical data quality processes were integrated as per Phase 3.
Statistical analysisSPSS Version 27.0 [33] was used to conduct frequencies and descriptive statistics for participant demographic characteristics, reliabilities, validities, and exploratory factor analysis (EFA). The vegetarian and vegan samples each had one variable with missing data at random and was imputed with the variable median [37]. CFA was conducted separately for vegetarians and vegans to confirm fit of the V-EDS model discovered via Phase C. Diagonally weighted least squares was used as the estimation method as it provides a robust estimation when dealing with ordinal data that violates the assumption of multivariate normality [38]. Adequacy of model fit was evaluated by examining several fit indices as judged using a two-index presentation strategy [39]. Relative model fit was judged with a specific focus on Comparative Fit Index (CFI), with ≥ 0.90 being acceptable and ≥ 0.95 being excellent [39]. Absolute model fit was judged with a focus on point estimate of root mean square error of approximation (RMSEA), with < 0.05 demonstrating good fit, between 0.05 and 0.08 acceptable fit, and > 0.08 poor fit [40]. Information linked to other fit indices were also reported and considered, including x2 value, Tucker-Lewis Index (TLI), and standardised root mean square residual (SRMR; [41,42,43]).
Internal consistency of the 12 scored V-EDS items were calculated using Cronbach’s coefficient alpha (α) for each dietary group. Convergent and discriminant validity were calculated using Pearson correlations (r) between the V-ED scored items and scores on the EDE-Q and DASS-21 subscales, respectively, for each group. Due to an insufficient sample size required to obtain 95% confidence in the test–retest reliability arm [44], analyses were not conducted for this statistic.
ResultsDescriptive statisticsIn the present study, the most common primary motivation for adhering to a vegetarian diet was animal welfare (58.8%), the environment (16.3%), and taste, texture, and/or smell preferences (9.0%), with a median diet length of 10.0 years (IQR = 16.0). In the vegan sample, the most common primary motivation was animal welfare (79.8%), health (8.9%), and the environment (7.4%), with a median diet length of 8.0 years IQR = 8.0). Table 3 presents descriptive statistics for the overall sample and subgroups, and omnibus test results to compare the vegetarian and vegan groups.
Table 3 Phase 4 participant demographic characteristicsDietary characteristic itemsItem 1: I’m motivated to eat my food choices for…?This item aimed to understand the primary dietary motivation driving the respondent’s adherence to a vegetarian or vegan diet (Fig. 2). Respondents are presented with five categorical options shown to be the most common dietary motivations (e.g., [6]).
Fig. 2
Item 1 response characteristics across dietary groups
Item 2: Your vegetarian/vegan diet is part of your identityItem 2 aimed to examine the degree the respondent perceives their dietary adherence to be tied to their identity (Fig. 3). We found significant differences in scores between dietary groups (t(648) = -5.14, p < 0.001, d = 0.42), with vegans more likely to strongly agree with this item.
Fig. 3
Item 2 response characteristics across dietary groups
Item 3: A balanced diet can include eating processed plant-based products (e.g., mock meats)This item aimed to assess the respondent’s rigidity around the consumption of processed plant-based products which may provide insight into “clean eating” practices (i.e., a diet approach of eating primarily unprocessed and unrefined foods; [45]) often associated with vegetarian and vegan diets (Fig. 4). We found no significant differences in scores between dietary groups (t(648) = −1.45, p = 0.147, d = 0.12.
Fig. 4
Item 3 response characteristics across dietary groups
Item 4: You are willing to introduce meat to your diet if it is vital for your survivalItem 4 was developed to explore the respondent’s openness to the introduction of meat if necessary for their physical and/or mental health as part of eating disorder recovery. If accompanied by higher V-EDS scores and subsequent diagnosis of an eating disorder, this item may provide clinicians with potential insights into the respondent’s receptiveness to the consumption of meat and can be used to approach future client discussions on the topic. We found significant differences in scores between dietary groups (t(648) = 3.85, p < 0.001, d = 0.31), with vegans demonstrating stronger disagreement with the sentiment (Fig. 5).
Fig. 5
Item 4 response characteristics across dietary groups
Item 5: The thought of accidentally eating meat causes you significant distressItem 5 explores a respondent’s potential aversion to the consumption of meat (Fig. 6). There were statistically significant differences in scores between dietary groups (t(648) = −5.20, p < 0.001, d = 0.42), with vegans demonstrating overall stronger agreement with the sentiment.
Fig. 6
Item 5 response characteristics across dietary groups
Item 6: Removing meat and/or animal products from your diet allows you to control the way your body looksThis item was developed to pick up on whether a respondent may be engaging in a vegetarian or vegan diet for body modification reasons, and thus may be at a higher risk for eating disorder development (Fig. 7). There were no significant differences in scores between dietary groups (t(648) = −0.91, p = 0.364, d = 0.07).
Fig. 7
Item 6 response characteristics across dietary groups
Confirmatory factor analysisModel fit of the one-factor model was judged to be acceptable in separate analysis of vegetarians and vegans. See Table 4 for individual model fit indices across dietary groups.
Table 4 Confirmatory factor analysis fit statistics of the V-EDS by dietary adherenceInternal consistency and construct validityTable 5 summarises the internal consistency reliability, convergent bivariate Pearson correlations with the EDE-Q global score, and discriminant bivariate Pearson correlations with the DASS-21 subscales across dietary groups. Internal consistency, as measured by Cronbach’s alpha, was excellent in separate vegan and vegetarian groups. Convergent correlations were very strong in strength, demonstrating excellent convergent validity of the V-EDS with the EDE-Q. Divergent correlations with the DASS-21 depression subscale was moderate in strength, demonstrating moderate discriminant validity.
Table 5 Psychometric characteristics of the V-EDS by dietary adherence
留言 (0)