
記住我


Hippocampal sclerosis (HS) is one of the most frequent causes of medial temporal lobe epilepsy. The epileptogenicity of HS is often one-sided (unilateral HS) and is categorized as Left hand side (LHS) or Right hand side (RHS).[1,2] In the visual analysis of magnetic resonance imaging (MRI) for unilateral HS, atrophy of the hippocampus and extrahippocampal regions is generally judged compared to the contralateral hemisphere.[3] The previous visual analysis studies reported that atrophy of the extrahippocampal regions was pronounced in the anterior temporal pole, amygdala, entorhinal cortex, fornix, mammillary body, posterior thalamus, and contralateral cerebellum.[3]
According to studies of gray matter volume (GMV) using voxel-based morphometry (VBM) on MRI of unilateral HS, GMV in the hippocampus and some extrahippocampal regions on the HS side was significantly lower than that in normal subjects (decreased GMV or decreased GMV relative to normal subjects).[4-9] However, a recent meta-analysis of GMV studies in unilateral HS indicated no common regions with decreased GMV between patients with RHS and LHS.[10] This could be related to the following two methodological concerns used in GMV studies in unilateral HS. First, most GMV studies of unilateral HS did not compare GMV between the HS and the contralateral or the non-HS side. Instead, they compared the GMV of the patients of HS with that of normal subjects.[10] Second, most GMV studies of unilateral HS evaluated decreased GMV. However, they did not evaluate increased GMV,[10] although recent studies have reported increased GMV or enlargement of the extrahippocampal regions in the epileptogenic or contralateral hemisphere in medial temporal lobe epilepsy.[11-14] In unilateral HS, we hypothesized that the decrease in GMV on the HS side relative to that in the normal subjects as well as the possible increase in GMV on the nonHS side relative to that in the normal subjects would make the relative decrease in GMV on the HS side in comparison to the non-HS side (interhemispheric asymmetrical change in GMV) more prominent. Therefore, to clarify the interhemispheric asymmetrical change in GMV, we sought to compare GMV changes relative to normal subjects between the HS and non-HS sides concerning decreased and increased GMV.
When we compared GMV between the HS and non-HS sides and evaluated regions with increased and decreased GMV, we should note that the GMV between the left and right regions or regions of interest (ROIs) was significantly different, even in normal subjects.[15] To correct the normal interhemispheric asymmetry in GMV, a Z-score (Z-GMV) was introduced to quantify the decrease and increase in GMV compared with that in normal subjects (n = 30) for each region.[16]
Therefore, to clarify the interhemispheric asymmetrical change in GMV in unilateral HS, we sought to compare the Z-GMV in each region between the HS and non-HS sides. Further, we demonstrated the common and different regions with asymmetrically decreased and increased GMV between RHS (n = 16) and LHS (n = 29).
MATERIAL AND METHODS PatientsThis observational study was approved by the Institutional Review Board of our Institute (No. 2023-4-038) and informed consent from the patients was waived because the data were obtained for clinical purposes. Informed consent was obtained from all healthy subjects for the prospective acquisition of magnetic resonance (MR) images.
At our institution, epilepsy was diagnosed after comprehensive evaluations, including video-electroencephalogram monitoring, formal neuropsychological tests, MRI, and fluorodeoxyglucose positron-emission tomography (FDGPET).[17,18] 51 consecutive patients with HS between November 2011 and April 2017 were selected for this study based on the following criteria: (i) clinical diagnosis of unilateral mesial temporal lobe epilepsy (MTLE), (ii) identification of unilateral HS on visual analysis of MRI, and (iii) the presence of temporal hypometabolism on the HS side on FDG PET.[19,20]
The criteria for MRI diagnosis of unilateral HS included smaller size and increased signal intensity of the unilateral hippocampus compared to the contralateral hippocampus on T2-weighted images (T2WI) and fluid-attenuated inversion recovery (FLAIR) images.[20] 6 patients (three men and three women) were excluded due to the presence of old focal lesions in the extratemporal areas. Thus, 45 patients with unilateral HS without extratemporal lesions on MRI were included in this study (22 men and 23 women) [Table 1].[20] Thirty age-matched normal subjects were enrolled to calculate the Z score that quantified the decreased or increased GMV change in patients in HS compared to GMV in normal subjects.
Table 1: Clinical characteristics of patients with unilateral HS and healthy subjects.
Clinical characteristics Unilateral HS (n=45) Normal subjects (n=30) P-value Right HS (n=16) Left HS (n=29) Age (years) 37.0±14.0 31.8±5.9 0.13 39.4±9.97 35.6±15.8 0.24 Sex (men/women) 22/23 15/15 1.0 8/8 14/15 1.0 Age of onset (years) 17.2±12.8 N/A 16.9±12.2 17.3±13.4 0.86 Duration of epilepsy (years) 19.8±13.8 N/A 22.5±14.0 18.3±13.7 0.31 Surgery for epilepsy (Yes/no) 16/29 N/A 5/11 11/18 0.75 IPIs (number of patients) 31 N/A 13 18 0.32 MRI16 RHS and 29 LHS patients underwent 3T-MRI using either the MAGNETOM Trio, A Tim System, Siemens Healthcare GmbH, Erlangen, Germany (Siemens machine) or the Intera Achieva Quasar Dual, Philips Healthcare, Best, the Netherlands (Philips machine). There was no statistically significant difference in which of the two 3TMRI systems, the RHS and LHS patients were assigned to (Fisher’s exact test; P = 0.3484). 30 age-matched normal subjects underwent MRI with the identical Siemens machine.
The MRI protocol included the following sequences: Axial T2WI and FLAIR imaging parallel to the anteroposterior commissure axis; axial magnetization-prepared rapid gradient echo imaging (3D T1WI) parallel to the long axis of the hippocampus; coronal short T1 inversion recovery; and FLAIR imaging perpendicular to the long axis of the hippocampus. 3D T1W images acquisition parameters were as follows: MAGNETOM Trio: Axial 3D MPRAGE, 0.9 mm thick, no gap, TR 2000 ms, TE 3.1 ms, TI 900 ms, matrix 320 × 320, FOV 256 × 240 mm, flip angle 9°; Intera Achieva Quasar Dual: Axial 3D MPRAGE, 1.0 mm thick, no gap, TR 6.6 ms, TE 3.1 ms, TI 872.9 ms, matrix 268 × 238, FOV 240 × 213 mm, flip angle 8°.
VBMAll 3D T1W images were processed using statistical parametric mapping (SPM) 12 (Welcome Department of Imaging Neuroscience, London, UK; http://www.fil.ion.ucl.ac.uk/spm/software/spm12/) in MATLAB R2018a (MathWorks, Natick, MA). The 3D T1WI in DICOM format was converted to the NIFTI format, and the images were aligned parallel to the anteroposterior commissure line. Segmentation was performed to create the gray matter, white matter, cerebral spinal fluid, and other tissue volumes with diffeomorphic anatomical registration through exponentiated lie algebra to improve the accuracy of the alignment of the patient’s brain image. The segmented volumes were anatomically normalized into the Montreal Neurological Institute space to be modulated and smoothed with an 8 mm full-width half-maximum Gaussian kernel.
Anatomical automatic labeling (AAL) and anatomy toolboxWe measured GMV using the AAL template [Table 2][21] and anatomy toolbox version 3.0 [Table 3][22] by applying a threshold of more than 50% probability of gray matter to the corresponding probability map. AAL includes 58 regions or ROIs on each side, which cover the whole brain based on neuroanatomical names [Table 2]. Anatomy Toolbox includes 78 subregions or ROIs in each cerebral hemisphere, which do not cover the whole cerebral hemisphere but include small and significant regions based on structural and functional imaging studies [Table 3]. In addition to the seven hippocampal subregions, the template includes four in the amygdala, seven in the thalamus, and two in the basal forebrain (BF). These subregions include extrahippocampal areas reported to be anatomically related to the hippocampus. In this manuscript, general anatomical names begin with lower-case let ters, and region of interest (ROI) names on either of the two templates begin with capital letters. For example, the hippocampus and thalamus are anatomical names, while the Hippocampus is the ROI name used in AAL, and Thalamus (temporal) is the ROI name used in the anatomy toolbox.
Table 2: Regions of interest (ROIs) description of Anatomical Automatic Labeling (AAL).
Anatomical description ROIs description (n=58) precentral gyrus Precentral superior frontal gyrus Frontal_Sup superior frontal gyrus, orbital part Frontal_Sup_Orb middle frontal gyrus Frontal_Mid middle frontal gyrus, orbital part Frontal_Mid_Orb inferior frontal gyrus, opercular part Frontal_Inf_Oper inferior frontal gyrus, triangular part Frontal_Inf_Tri inferior frontal gyrus, orbital part Frontal_Inf_Orb rolandic operculum Rolandic_Oper supplementary motor area Supp_Motor_Area olfactory cortex Olfactory superior frontal gyrus, medial Frontal_Sup_Medial medial frontal gyrus, orbital part Frontal_Med_Orb gyrus rectus Rectus insula Insula anterior cingulate gyrus Cingulum_Ant middle cingulate gyrus Cingulum_Mid posterior cingulate gyrus Cingulum_Post hippocampus Hippocampus parahippocampal gyrus ParaHippocampal amygdala Amygdala calcarine fissure and surrounding cortex Calcarine cuneus Cuneus lingual gyrus Lingual superior occipital gyrus Occipital_Sup middle occipital gyrus Occipital_Mid inferior occipital gyrus Occipital_Inf fusiform gyrus Fusiform postcentral gyrus Postcentral superior parietal gyrus Parietal_Sup inferior parietal, but supramarginal and angular gyri Parietal_Inf supramarginal gyrus SupraMarginal angular gyrus Angular precuneus Precuneus paracentral lobule Paracentral_Lobule caudate nucleus Caudate putamen Putamen pallidum Pallidum thalamus Thalamus heschl gyrus Heschl superior temporal gyrus Temporal_Sup temporal pole: superior temporal gyrus Temporal_Pole_Sup middle temporal gyrus Temporal_Mid middle temporal gyrus Temporal_Pole_Mid Inferior temporal gyrus Temporal_Inf cerebelum_Crus1 Cerebelum_Crus1 cerebelum_Crus2 Cerebelum_Crus2 cerebelum_3 Cerebelum_3 cerebelum_4_5 Cerebelum_4_5 cerebelum_6 Cerebelum_6 cerebelum_7b Cerebelum_7b cerebelum_8 Cerebelum_8 cerebelum_9 Cerebelum_9 cerebelum_10 Cerebelum_10 vermis_1_2 9100 Vermis_1_2 9100 vermis_4_5 9120 Vermis_4_5 9120 vermis_7 9140 Vermis_7 9140 vermis_9 9160 Vermis_9 9160Table 3: Regions of interest (ROIs) description of Anatomy Toolbox template.
Anatomical description (number of ROIs included) ROIs description (n=78) cingulate cortex (4ROIs) Area s24 Area 25 Area s32 Area 33 amygdala (4ROIs) Amygdala (AStr) Amygdala (CM) Amygdala (LB) Amygdala (SF) hippocampus (7ROIs) CA1 (Hippocampus) CA2 (Hippocampus) CA3 (Hippocampus) DG (Hippocampus) Entorhinal Cortex Subiculum HATA orbitofrontal cortex (3ROIs) Area Fo1 Area Fo2 Area Fo3 superior parietal lobule (SPL) (7ROIs) Area 5L (SPL) Area 5M (SPL) Area 5Ci (SPL) Area 7A (SPL) Area 7PC (SPL) Area 7M (SPL) Area 7P (SPL) inferior parietal lobule (IPL) (7ROIs) Area PFop (IPL) Area PFt (IPL) Area PFm (IPL) Area PF (IPL) Area PFcm (IPL) Area PGa (IPL) Area PGp (IPL) intraparietal sulcus (IPS) (3ROIs) Area hIP1 (IPS) Area hIP2 (IPS) Area hIP3 (IPS) Broca’s region (BA44/BA 45) (2ROIs) Area 44 Area 45 parietal operculum/SII (4ROIs) Area OP1 [SII] Area OP2 [PIVC] Area OP3 [VS] Area OP4 [PV] motor cortex (2ROIs) Area 4a Area 4p primary somatosensory cortex (4ROIs) Area 3a Area 3b Area 1 Area 2 primary auditory cortex (4ROIs) Area TE 1.0 Area TE 1.1 Area TE 1.2 Area TE 3 posterior insula (3ROIs) Area Ig1 Area Ig2 Area Id1 dorsal extrastriate cortex (7ROIs) Area hOc3v [V3v] Area hOc3d [V3d] Area hOc4v [V4(v)] Area hOc4la Area hOc4lp Area hOc4d [V3A] Area hOc5 [V5/MT] fusiform gyrus (4ROIs) Area FG1 Area FG2 Area FG3 Area FG4 frontal pole (2ROIs) Area Fp1 Area Fp2 basal forebrain (2ROIs) BF (Ch 1-3) BF (Ch 4) Broadman area (BA) 17 and BA 18 (V1/V2) (2ROIs) Area hOc1 [V1] Area hOc2 [V2] thalamus (Thal) (7ROIs) Thal: Motor Thal: Parietal Thal: Premotor Thal: Somatosensory Thal: Prefrontal Thal: Visual Thal: temporal Z scores of GMVPrevious research has identified significant differences in GMV between the left and right regions (ROIs), even in normal subjects, which is referred to as normal interhemispheric GMV asymmetry.[15] To account for this normal asymmetry, we introduced a Z-score to quantify GMV changes in each ROI for each side in patients with unilateral HS (referred to as Z-GMV) using the following formula:[16]
Z-GMV = (Mean GMV of each ROI on the left and right in healthy subjects – GMV of each ROI on the left and right in patients)/Standard deviation of GMV in each ROI on the left and right in healthy subjects.
In this formula, when calculating the right Z-GMV, GMV values for each ROI are taken from the right side for both healthy subjects and patients. Conversely, for the left Z-GMV, GMV values for each ROI are taken from the left side for both healthy subjects and patients. Z-GMV >0 and <0 in each ROI indicates that GMV is lower and higher in comparison with the normal brain.
Asymmetrically decreased and increased regionsIn patients with unilateral HS, we compared Z-GMV in the ROIs defined by the AAL and Anatomy Toolbox between the HS and contralateral sides using a paired t-test. We defined the regions in which Z-GMV was significantly higher or lower on the HS side than the contralateral or non-HS side as asymmetrically decreased or increased regions, respectively.
Common asymmetrically decreased and increased regionsWe found common regions between asymmetrically decreased regions in LHS and RHS (common asymmetrically decreased regions). We also found common regions between asymmetrically increased regions in LHS and RHS (common asymmetrically increased regions).
StatisticsA paired t-test was used to compare Z-GMV in the 58 ROIs defined by AAL and 78 ROIs defined by the Anatomy Toolbox on the left and right sides. P < 0.001 was considered statistically significant. All statistical analyses were performed using JMP Pro 16.0 software (SAS Institute, Cary, NC, USA).
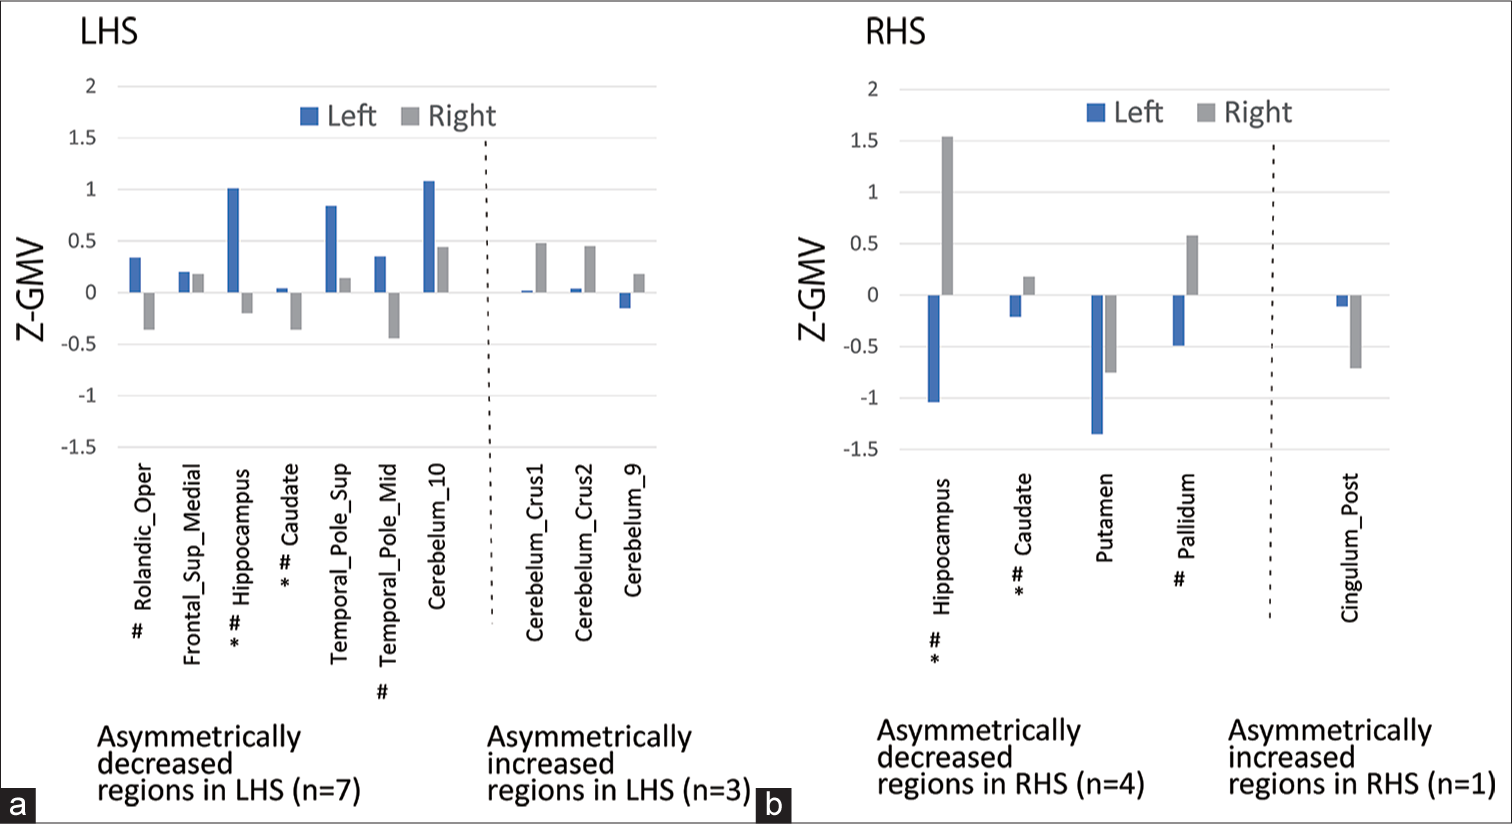
RESULTS AAL7 regions were asymmetrically decreased regions in LHS, in which Z-GMVs in the LHS/RHS were significantly higher than that in the right (non-HS side), and three regions were asymmetrically increased regions in LHS, in which Z-GMVs in the left (HS side) were significantly lower than that in the right (non-HS side) [Figure 1a]. Four regions were symmetrically decreased regions in RHS, and one region was asymmetrically increased regions in RHS [Figure 1b].
Export to PPT
The common regions between the asymmetrically decreased regions in LHS and those in RHS (common asymmetrically decreased regions) were the Hippocampus and Caudate. In addition to the two common asymmetrically decreased regions, the five extrahippocampal regions including Rolandic_Oper, Frontal_Sup_Medial, Temporal_Pole_ Sup, Temporal_Pole_Mid, and Cerebelum_10 constituted asymmetrically decreased regions in LHS [Figure 1a]. In addition to the two common asymmetrically decreased regions, that is, two regions of the Putamen and Pallidum were asymmetrically decreased in the RHS [Figure 1b].
There were no common regions between the asymmetrically increased regions in LHS and RHS. Asymmetrically increased regions in LHS included three regions, Cerebelum_Crus1, Cerebelum_Crus2, and Cerebelum_9 [Figure 1a]. Further, Z-GMVs (mean) were >0 on the right (non-HS side) in such regions.
In most of the asymmetrically decreased regions in both LHS and RHS, the combination of Z-GMV (mean) was >0 on the HS side and <0 on the non-HS side (LHS: Four of seven regions in [Figure 1a] and RHS: Three of four regions in [Figure 1b]).
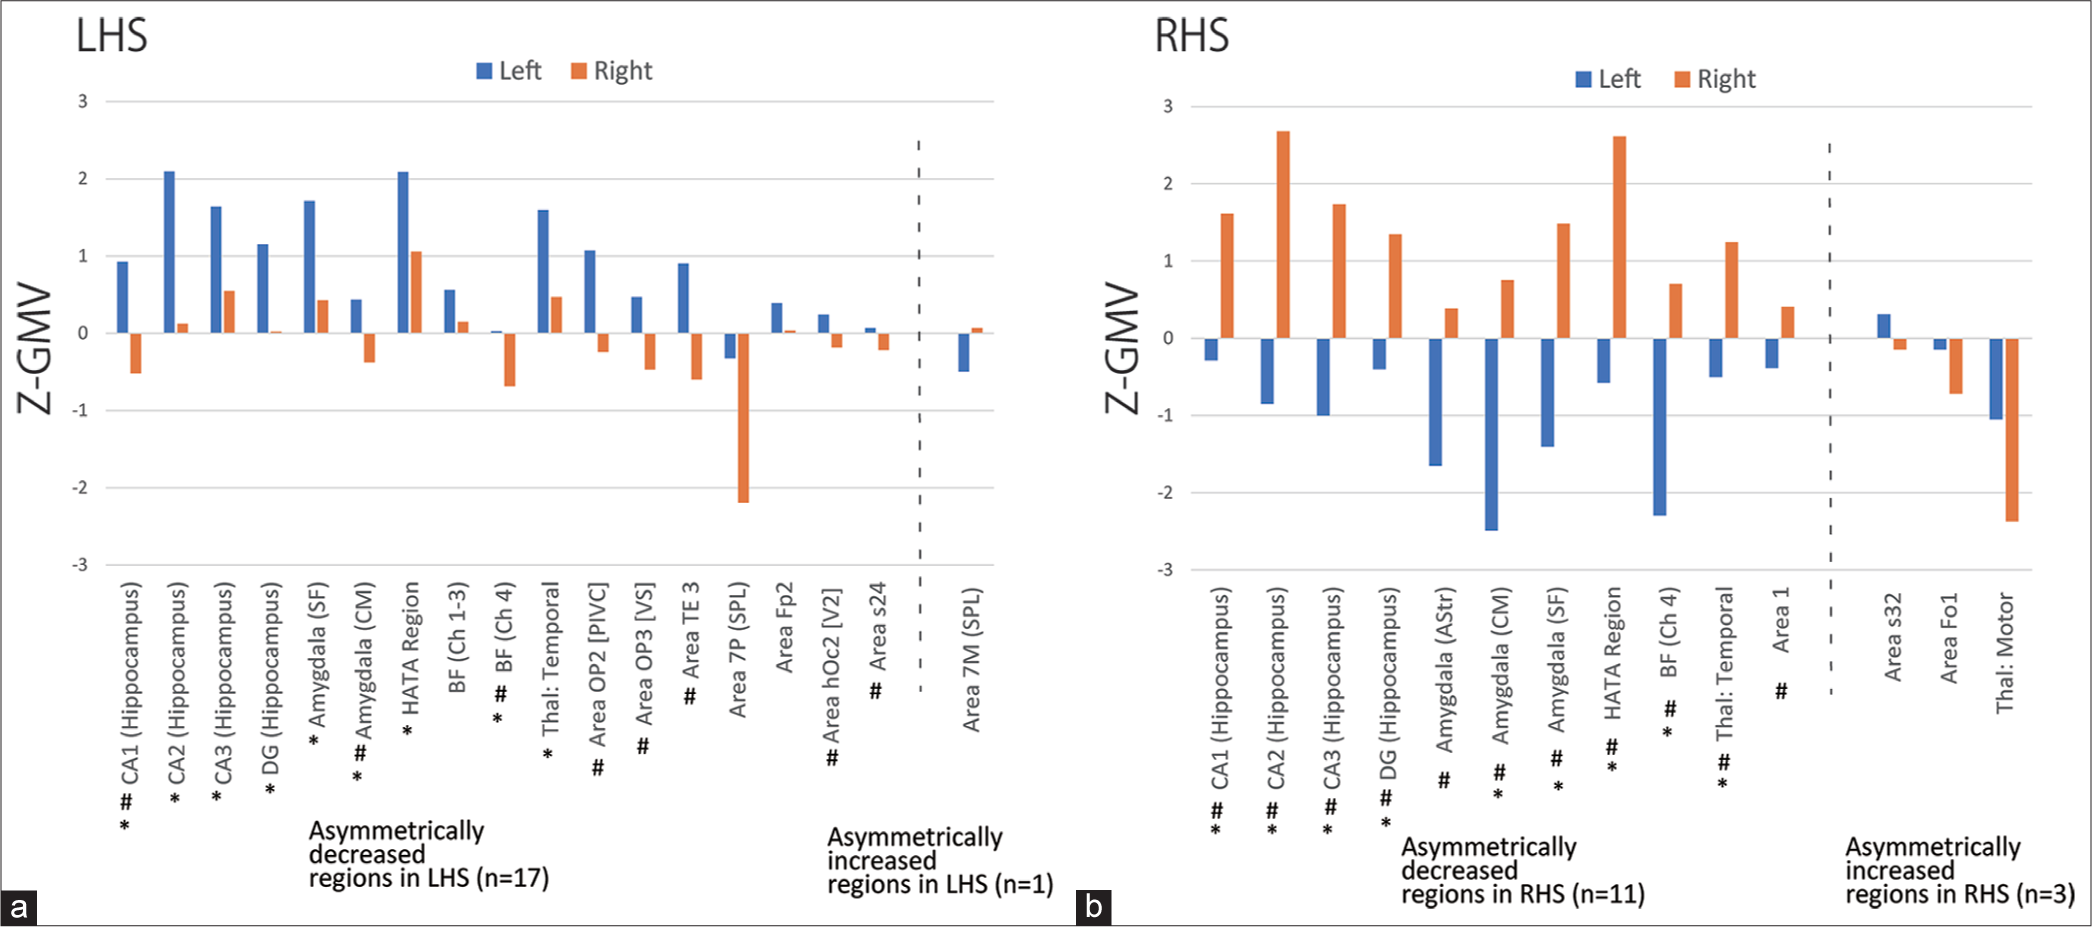
Anatomy toolbox template (anatomy toolbox)Seventeen were asymmetrically decreased regions in LHS and the one region, Area 7M (SPL) was an asymmetrically increased region in LHS [Figure 2a]. Eleven were asymmetrically decreased regions in RHS and the three (Area s32, Area Fo1, and Thalamus: Motor) were asymmetrically increased regions in RHS [Figure 2b].
Export to PPT
Common asymmetrically decreased regions included nine regions of five subregions of the hippocampus, that is, CA1 (hippocampus), CA2 (hippocampus), CA3 (hippocampus), DG (hippocampus), and hippocampal–amygdaloid transition area (HATA), and four extrahippocampal regions, including two subregions of the amygdala, that is, Amygdala (Centromedial [CM]) and Amygdala (Superficial [SF]), basal forebrain (BF)(Ch4), and Thalamus: Temporal.
In addition to the nine common asymmetrically decreased regions, eight extrahippocampal regions constituted asymmetrically decreased regions in LHS [Figure 2a]. In addition to the nine common asymmetrically decreased regions, two extrahippocampal regions constituted asymmetrically decreased regions in the RHS [Figure 2b].
There were no common regions between the asymmetrically increased regions in LHS and RHS. Asymmetrically increased regions in LHS included one extrahippocampal region, that is, Area 7M (SPL) [Figure 2a]. Asymmetrically increased regions in the RHS included three regions, that is, Area s32, Area Fo1, and Thalamus: Motor.
In most of the asymmetrically decreased regions in both LHS and RHS, the combination of Z-GMV (mean) was >0 on the HS side and <0 on the non-HS side (LHS: Eight of 17 regions in [Figure 2a] and RHS: All of 11 regions in [Figure 2b]).
DISCUSSIONTo clarify the interhemispheric asymmetrical change in GMV, we introduced Z-GMV and compared it between the HS and non-HS sides. Common asymmetrically decreased regions in LHS and RHS in the AAL included the hippocampus (Hippocampus) and caudate nucleus (Caudate). In the Anatomy Toolbox , the common asymmetrically decreased region included five subregions of the hippocampus (CA1-3, DG, and HATA), and four extrahippocampal regions of two subregions in the amygdala (Amygdala [CM and SF]), one in the BF (BF [Ch4]), and one in the thalamus (Thalamus: Temporal).
The hippocampus as common asymmetrically decreased regions in AAL (Hippocampus) and in the Anatomy Toolbox (CA1-3, DG, and HATA) could agree with MRI diagnostic criteria for LHS and RHS used in this study: to compare the size and signal intensity of the left and right hippocampus by visual evaluation and set the side with smaller and higher T2WI signal intensity to the HS side.
Concerning the extrahippocampal regions, we found that four regions including the amygdala, thalamus, BF, and caudate nucleus common asymmetrically decreased regions in LHS and RHS. The amygdala and thalamus, as whole regions (Amygdala and Thalamus defined by the AAL, respectively) were not included, but the two subregions of the amygdala (Amygdala [CM] and Amygdala [SF]) and one subregion in the thalamus (Thalamus [temporal]) defined in the Anatomy Toolbox were included in the study. These subregions are understood to interact closely with the hippocampus, as shown in diffusion tensor imaging and static state functional MRI studies.[7,23-25] The BF (Ch4) as defined in the Anatomy Toolbox) was included in common asymmetrically decreased regions in LHS and RHS. We hypothesized that the involvement of the BF (Ch4) and the resulting asymmetric reduction in GMV may be associated with the cognitive decline often observed in unilateral HS. Indeed, the BF, particularly a small region of the basal ganglia of Meynert (Ch4), extends cholinergic fibers to the cerebral hemispheres and plays an important role in the cognitive function of memory; decreased GMV in the BF (Ch4), as measured by VBM, is associated with Alzheimer’s disease[26] and Parkinson’s disease.[27] The caudate nucleus (Caudate as defined by AAL) as common asymmetrically decreased extrahippocampal regions could be consistent with a recent report showing hypometabolism on FDG-PET of the caudate nucleus on the HS side compared to the non-HS side.[28]
Our study suggested the two characteristics regarding the interhemispheric asymmetrical changes in GMV in patients with unilateral HS. First, more extensive regions were asymmetrically involved in LHS than in RHS, which was already suggested by the previous GMV studies of unilateral HS.[29,30] We were especially interested in the two regions found only in LHS. First, Temporal_Pole_Sup and Temporal_ Pole_Mid in AAL were found in LHS as asymmetrically decreased regions but not in RHS. The temporal pole is the area in which atrophy and hyperintensity in the T2-weighted image or FLAIR images are associated with ipsilateral HS as per visual analysis and VBM studies.[31,32] The involvement of the ipsilateral temporal pole associated with unilateral HS, as found in visual analysis or VBM studies, could indicate the possible extrahippocampal epileptogenicity often associated with unilateral HS.[33] Other regions of interest were Cerebelum_Crus1, Cerebelum_Crus2, and Cerebelum_9, which were asymmetrically increased regions in LHS. In such regions, Z-GMV (mean) was >0 in the contralateral HS side (right), indicating that the GMVs were decreased more in the contralateral HS side (right) than in normal subjects. This result could agree with a previous study that showed atrophy of the contralateral cerebellum in visual analysis and VBM.[34]
The second characteristic regarding the interhemispheric asymmetrical changes in GMV in unilateral HS is that among asymmetrically decreased regions in unilateral HS, most of the regions showed the combination of decreased GMV on the HS side compared to healthy controls (Z-GMV [mean]>0) and increased GMV on the non-HS side compared to healthy controls (Z-GMV [mean]<0). Therefore, we suppose that such characteristics could contribute to detecting the common asymmetrically decreased regions in LHS and RHS, by comparing Z-GMVs between the HS side and the contralateral or non-HS side. In addition, increased GMV on the non-HS side in unilateral HS compared to healthy controls has not been fully explored in the previous reports and should be clarified in larger studies conducted in the future.
The strength of this study is the application of the Anatomy Toolbox in addition to the AAL to compare Z-GMV on the HS and non-HS sides. This enabled us to identify interhemispheric asymmetrical change in GMV in patients with unilateral HS in a small region, mainly in the medial temporal region. Another feature of this study is that we did not use surface-based morphometry (SBM) but VBM, because the evaluation of GMV using VBM is simple and effective when examining interhemispheric asymmetrical change in a small number of cases, as in this study. The GMV is considered a variable that simultaneously represents cortical thic kness, and cortical fold, calculated as independent variables in the SBM.[35] Indeed, although a single-center and small study, our Z-GMV results were consistent with those of a recent large multicenter study analyzing gray matter thickness in 732 MTLE patients and 1418 healthy controls using SBM. In this study, the authors introduce d an asymmetry index of gray matter thickness with normalized Z-score to quantify gray matter thickness asymmetry.[16] They reported that both the RHS and LHS showed interhemispheric asymmetry centered in the medial temporal lobe as shown in our study.
This study had limitations. First, the number of patients with unilateral HS and healthy subjects was small, and this was a retrospective study that used two different MR scanners. The next limitation is that this study has not analyzed the relationship between the asymmetrically decreased GMV change and the duration or age at seizure onset. We sought to clarify the asymmetrically decreased GMV in unilateral HS between the HS- and non-HS sides in a relatively small number of patients at a single institution, and the duration and age at seizure onset in patients with LHS and RHS did not differ significantly.
CONCLUSIONWe suggest the importance of comparing Z-GMV between the HS- and contralateral or non-HS sides in the evaluation of GMV in unilateral HS. We found that the hippocampus and extrahippocampal regions, including the BF, were associated with significantly higher Z-GMV on the HS side than the non-HS side in RHS and LHS.
留言 (0)