Design
This study is based on baseline data from the study on the effectiveness of the community-based prevention system Communities That Care in Germany (CTC-EFF) (Röding et al. 2021). CTC-EFF is a non-randomized cluster-controlled study.
Sample and data collection
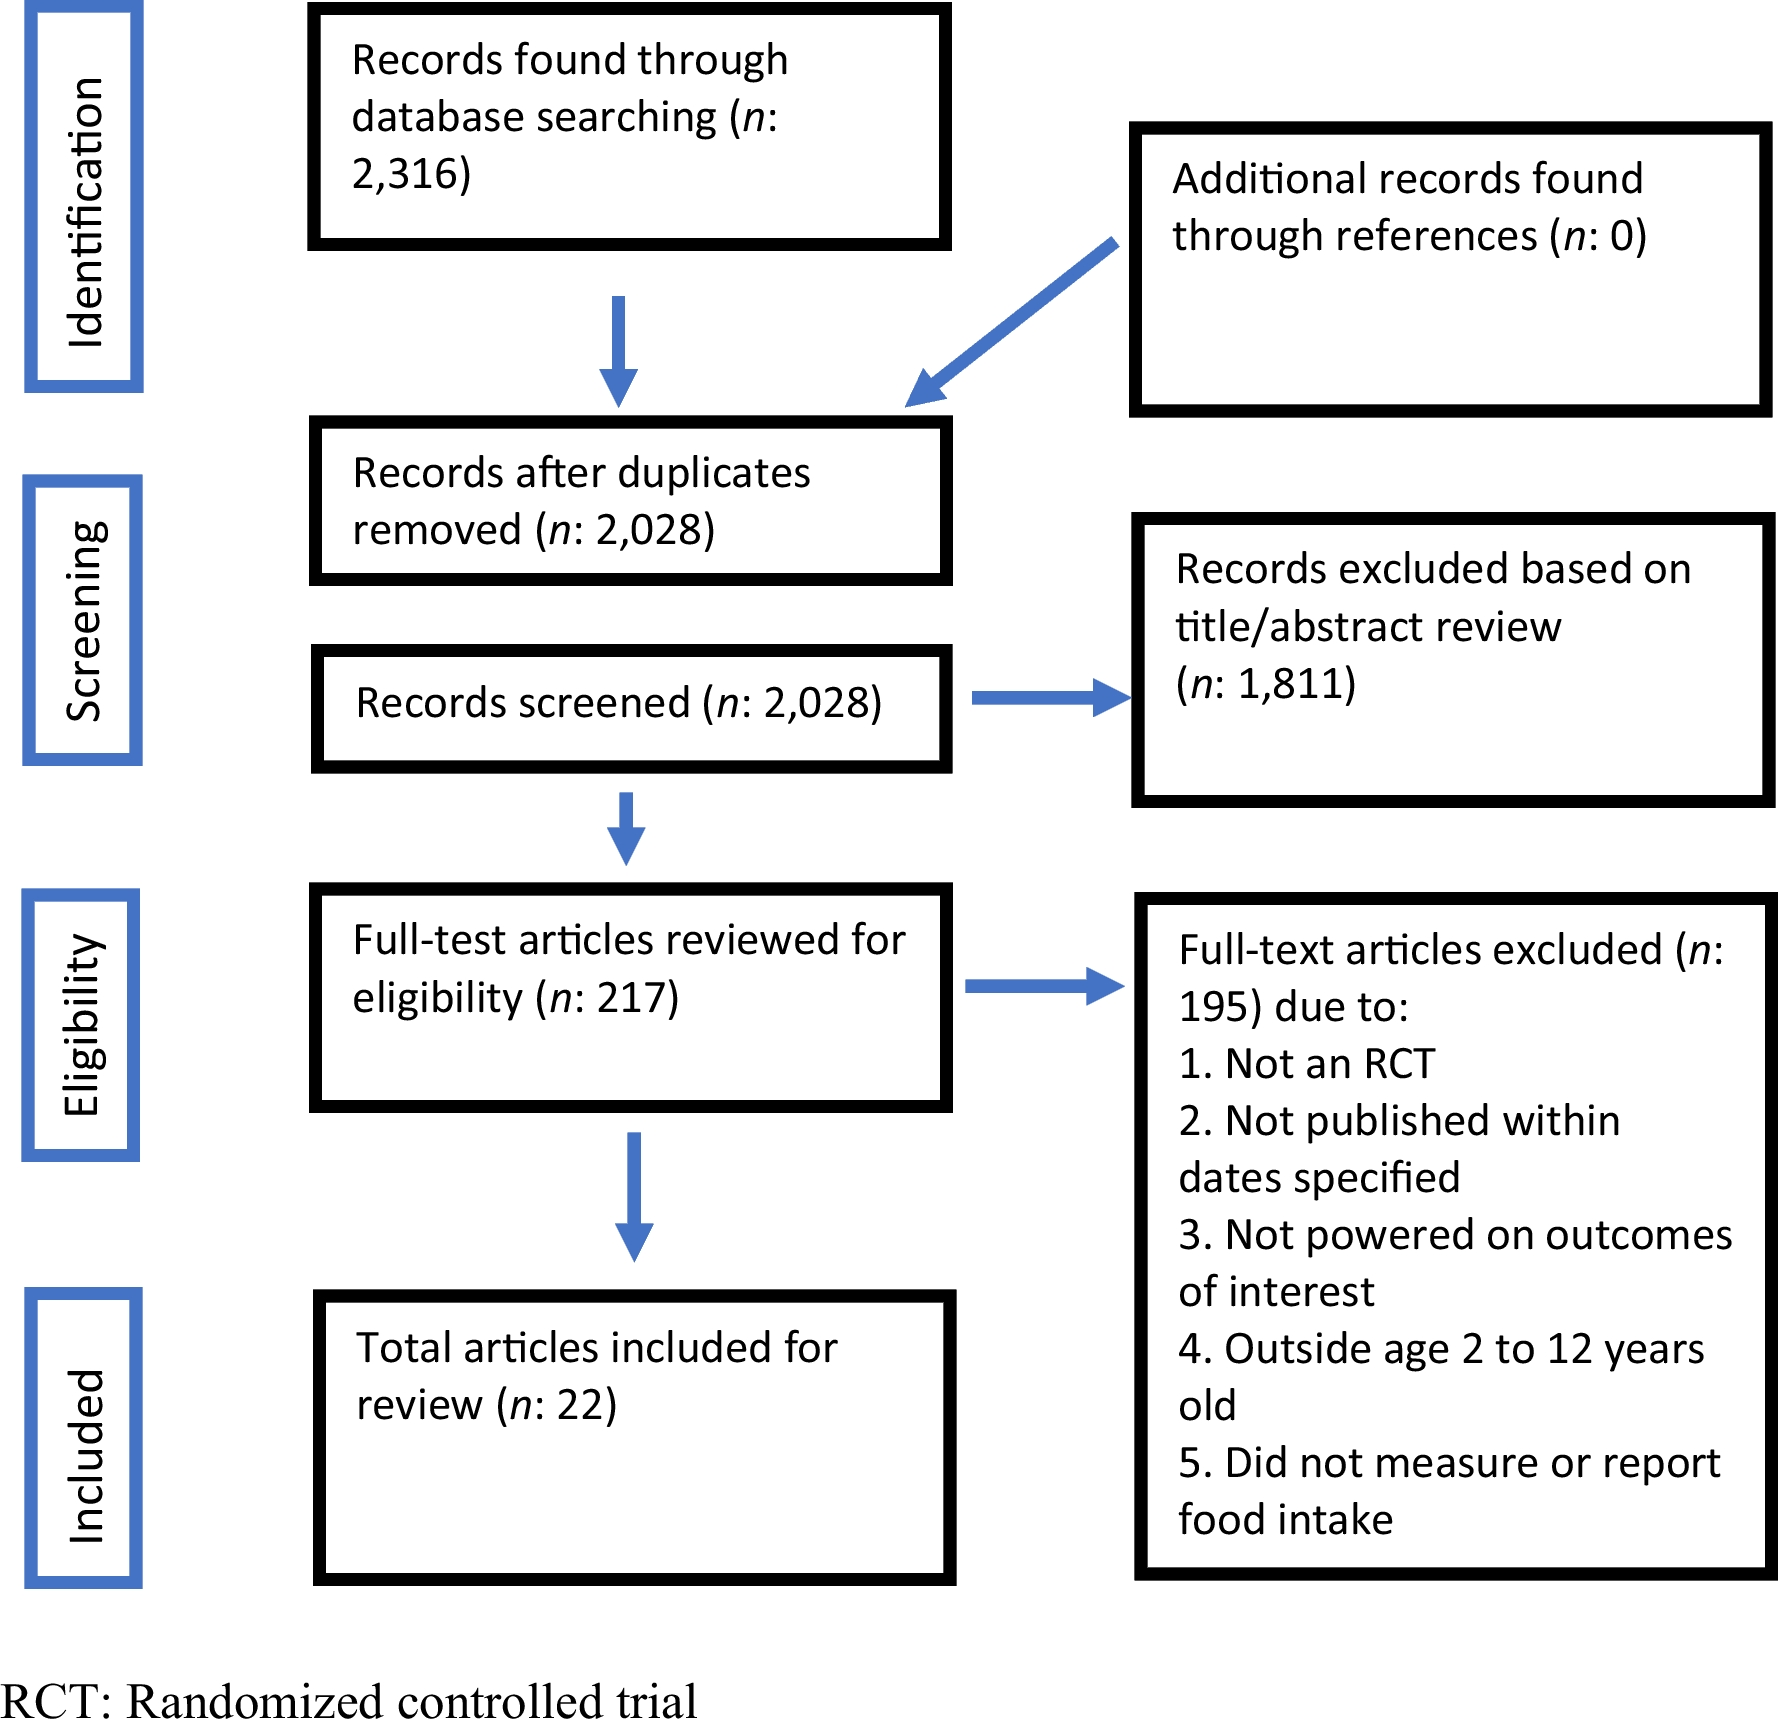
44 small towns, rural communities, or districts of large communities across four German states (Bavaria, Lower Saxony, Rhineland-Palatinate, and Baden-Wuerttemberg) were recruited for this study. A total of 38 communities are included in the current analysis. Three communities dropped out during the recruitment process, and three communities were not included in the analysis because only one person could be interviewed in these communities.
The data collection was based on a translated and German context-adapted version of the Community Key Informant Interview obtained from the Community Youth Development Study (CYDS) (Hawkins et al. 2008). The conceptualized survey is based on the 2009 version of the Community Key Informant Interview (CKI) provided by the Social Development Research Group (SDRG) (SDRG 2009). The translated and abbreviated version underwent cognitive pretesting and multiple loops of revision and initial validation analyses (Röding et al. 2023). Drawing on CYDS, a two-stage process was used to generate a sample of leaders in each of these communities (e.g., mayors, school principals, police officers, youth work leaders, or health officials). First, the research team identified individuals who held formal leadership positions and invited them to participate in the survey. Each surveyed key leader was then asked to identify two individuals in the community thought to be most knowledgeable about current prevention efforts. These individuals were also invited to participate. Data collection was conducted from May to July 2022, with a target of an average of 10 key individuals in each community. For sample-size calculation, see Röding et al. 2021 (Röding et al. 2021). Our sampling strategy yielded 879 community leaders, of whom 196 (22%) participated. Of the 196 respondents, 14 (7.1%) were dropped because the respondents could not provide information about the community. This deletion yielded 182 complete surveys, ranging from 2 to 10 per community, with an average number of 5.6 key informants per community. Data collection was primarily by computer-assisted telephone interview (CATI). As an alternative, a digital form of the instrument was offered as a self-administered survey.
Measures
At the individual level, the constructs presented below represent how key informants in the community rate their community. Based on intersubjective assessments by experts at the community level, they provide an indication of the (approximate) actual status of the community. A measure for the community level is calculated using the mean value of the respective individual-level measures for the community.
Dependent variable
The measure of adoption of evidence-based prevention is conceptually based on the diffusion of innovation metric (Rogers 1995; Arthur et al. 2005). This measure consists of 20 closed questions (e.g., Were risk and protective factors prioritized in your community to be addressed with prevention measures? Did your community decide which programs to implement based on this prioritization? Have prevention programs changed as a result of the evaluation? Has your community made funding decisions based on program evaluations?). An overview of all items is provided in Additional file 1. A total score between zero and five was calculated for each respondent. Thus, this value indicates one of the six levels of adoption of evidence-based prevention (Table 1) and provides a measure of how the respondent ranks their community in terms of adopting a evidence-based prevention (Arthur et al. 2005).
Table 1 Six stages of adoption of evidence-based preventionIndependent variables
Based on a previously conducted scoping review (Birgel et al. 2023), we identified nine commonly used domains to assess capacity for prevention and health promotion initiatives. On the basis of the definitions of these domains, it was possible to identify items from the CKI that allow measurement of each domain, notwithstanding that the CKI was not originally designed for comprehensive community capacity measurement. Nine domains of community capacity were assessed: (1) Community participation is an average of two items (agree to disagree) that ask community leaders if community members are committed to addressing community issues and believe that they could influence drug, alcohol, and tobacco abuse in the community. Response options for each item consisted of a 4-point scale (agree, somewhat agree, somewhat disagree, and disagree). (2) The construct knowledge & skills is an average of four items (agree to disagree on a 4-pointed Likert-Scale) that capture the knowledge and skills of community members to accomplish positive community development (e.g., My community never seems to be able to accomplish much at all. Generally, people in my community are knowledgeable about local prevention efforts.). (3) Resources is an average of four items. Three items were used to assess the impact of deficiencies in several resource areas. This included a lack of financial resources, lack of human resources, and lack of support in the community. Additionally, leaders were asked if current financial conditions pose a problem for community members. The four items were averaged and measured on a 4-point Likert scale ranging from very much to not at all. (4) Leadership was measured based on one item determining whether a lack of leaders constituted a problem for prevention work (1-4; a lot to not at all). (5) Community power is measured as the community's ability to develop plans that reflect community needs. A dichotomous scale was used to ask whether the community selects new prevention activities to address community needs. (6) Sense of community consists of the average of three items measuring the extent to which community members care about their community, whether the community is tight-knit, and whether most people in the community have a feeling of belonging (1-4; a lot to not at all). (7) Collaboration is measured using two validated multi-item scales. The first scale, consisting of nine items, assesses the quality of prevention collaboration (e.g., There is a network of people involved in prevention and/or health promotion who are in contact with each other. Prevention providers rarely coordinate their activities with each other. In your community, each organization has a clear role in implementing the local prevention plan.) (Brown et al. 2008). The item response scale is four-point: agree, tend to agree, tend to disagree, disagree. For each respondent, a mean is calculated from their responses to these items. We recoded the items so that lower values represent better collaboration. The second construct, sectoral-collaboration, assesses the degree of interagency collaboration perceived by community leaders across the ten community sectors voluntary groups, human service agencies, schools, businesses, social or cultural groups, youth recreation, law enforcement, juvenile justice, media, and religious organizations. This index consisted of responses to the question “In the past year, how much has [your organization] collaborated with [each sector] regarding prevention issues?” with response options coded: 0 = None, 1 = Some, 2 = A little, 3 = A lot. An overall score for each respondent was calculated by averaging responses across all ten sectors. (8) Critical awareness & problem-solving consists of the average of four items concerning the ability and capacity of the community to work together to identify and solve problems (e.g., In the last year, my community has been successful at addressing social problems. This community is willing to try new ideas to solve community problems. Community conflicts are usually resolved in a manner that is respectful of and satisfactory for the people involved.). (9) Community structure is measured as the proportion of individuals from diverse ethnic and cultural backgrounds participating in prevention planning and implementation (1-4; a lot to not at all). An overview of all capacity constructs and related items is provided in Additional file 2.
Confounders
Several possible individual-level confounders were captured in the CKI. Gender was assessed using the categories male, female, and non-binary. Current age was collected as well as migration background. Response categories are: Yes, I was not born in Germany. Yes, at least one parent is not from Germany. No. The respondents' educational status was collected according to the "Demographische Standards" (Beckmann et al. 2016). To have test criteria to determine whether the respondents were actually n the respective study community, it was asked: how many years have you lived in [community]? One answer option was: live elsewhere. This asked whether the person lived in the study community and, if so, how many years already. Furthermore, it was asked: How many years have you been working (including interruptions, if applicable) in [community]? One response option was: I do not work in the community. This question was used to assess whether the person works in the study community and, if so, how many years they have worked there. To have an indicator whether respondents are familiar with the main topic of the survey, it was asked: thinking about your previous professional and volunteer activities, have you worked in the prevention and health promotion field children and adolescents? Response options are: yes, no, and don't know. Respondents who answered yes to this were considered to have experience in this area.
Community-level characteristics potentially related to the adoption of evidence-based prevention were obtained from 2019 data provided by the Federal Institute for Research on Building, Urban Affairs, Spatial Development and consisted of (a) the total population of the community, (b) community fiscal power in € per inhabitant, and (c) the community type (very central, central, peripheral, very peripheral) (BBSR 2019).
Missing data
For the capacity constructs and the adoption score, the item non-response rate was, on average, in the higher single-digit percentage range. Details are shown in Additional file 3. These missing values were replaced in each case by the community-specific mean value of the item. For categorical data, this imputed value was commercially rounded to a whole number.
Analysis strategy
All analyses were conducted using SPSS 27.0 (IBM, Corp., Armonk, NY, USA). Confirmatory factor analysis was performed with the add-on SPSS2LAVAAN package.
To explore the measurement properties of the measures, structural validity, internal consistency, inter-rater agreement, and concurrent construct validity were examined. At this point, it should be noted that the measurement of the adoption of evidence-based prevention has already been validated in the U.S. CYDS (Arthur et al. 2005). As we conceptualized the capacity domains as unidimensional latent constructs, the capacity items were analyzed using confirmatory factor analysis (CFA). The calculation of a CFA is only appropriate for the six capacity domains that consist of more than two items. Evidence of structural validity would be realized if item-factor loadings for the indicator variables were large (i.e., ≥.50), statistically significant (p < 0.05), and if the overall factor model fit the data well. Five model fit indices were used to determine overall model fit: (a) nonsignificant X2, (b) comparative fit index (CFI) greater than .95, (c) Tucker-Lewis fit index (TLI) greater than .95, and (d) root mean square error of approximation (RMSEA) less than .06 (Hu and Bentler 1999; Kline 2015). No covariances between items were allowed. To measure internal consistency of the scales, Cronbach's alpha, McDonald's Omega (Hayes and Coutts 2020), and on the community level O'Brien's (1990) generalizability coefficient were calculated (O'Brien 1990). A 0.6 criterion was used to indicate acceptable internal reliability, with the understanding that constructs with low coefficients will need to be carefully evaluated for the potential of attenuated relationships with other variables (Schmitt 1996; O'Brien 1990). To assess inter-rater reliability the intraclass correlation coefficient (ICC) was determined based on unconditional 2-level hierarchical linear models (HLM) with random intercept (Sampson et al. 1997; Garner and Raudenbush 1991; Raudenbush and Bryk 2002). Additionally, we included the listed possible confounders as macro-regressors in the HLM to test whether they have an effect on the dependent or independent variables (Baltes-Götz n.d.).
The relationship between community capacity and community-wide adoption of an evidence-based prevention strategy was examined using logistic regression models. As the capacity dimensions and the adoption score are characteristics of communities and not individuals, this analysis was conducted at the community level. Therefore, the ratings of the key informants within each community were aggregated into a mean value for each community. For this analysis, the level of adoption of evidence-based prevention was dichotomized into 0 = level zero to level two, and 1 = level three or higher. The capacity dimensions were dichotomized into 0 = below average and 1= above average. In this analysis, confounders that are statistically significant in the previously calculated HLM models will be controlled for.


留言 (0)