
記住我


Firstly, we aimed to see how initial epileptic seizures affected proliferation of abDGCs, by adopting a hippocampal kindling model,34,35 which clinically resembles complex partial seizures with secondary generalized seizures (GS). After mice being fully kindled, we administered systemically BrdU to label mitotically active cells12 at different time points (Fig. 1a). Consistent with previous reports,13 kindling had stimulating effects on the proliferation of abDGCs in the SGZ. Quantitative analysis of BrdU labeling within the SGZ revealed a substantial increase in mitotic activity at 3 d and 7 d after kindling compared with controls and returned to baseline levels by 14 d after kindled status (Fig. 1b, c).
Fig. 1
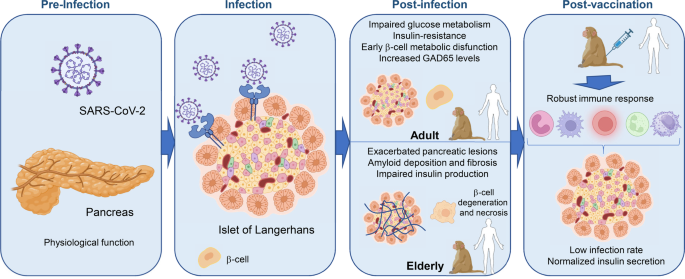
The abDGCs generated acutely after kindled status are functionally inhibited during later recurrent hippocampal seizures. a Experiment scheme of using BrdU to label cell proliferation in adult SGZ at different timepoints after mice being fully kindled. b Proliferative activity in the SGZ was significantly increased at 3 days, remained elevated at 7 days, and returned to baseline levels by 14 days after mice being fully kindled (n = 4 for each group *p < 0.05, ***p < 0.001, compared with control; One-way ANOVA followed by post hoc Dunnett test). c Representative images of BrdU labeling at different timepoints after mice being fully kindled (bar = 50 μm) and the enlarged images (bar = 10 μm). d Schematic diagram of the Ca2+ fiber photometry experiment. Fluorometric monitoring was carried out separately 4 or 8 weeks after the virus being injected to label 3-day abDGCs. e Configuration for fluorometric monitoring of Ca2+ signaling of abDGCs and simultaneous EEG recording during hippocampal seizures. f Histochemical verification of GCaMP6s expression in coronal sections in the DG (bar = 50 μm). White arrow points to the labeled abDGCs. g, h Representative GCaMP signals aligning with EEG recordings during hippocampal seizures when labeled abDGCs were 4-weeks-old (green) and 8-weeks-old (blue), respectively. The parameter of kindling stimulation is: monophasic square-wave pulses, 20 Hz, 1 ms/pulse, 40 pulses, 200μA. i Mean fluorescence values of abDGCs during hippocampal seizures (n = 8 for 4 w; n = 6 for 8 weeks). j The statistical value of ΔF/F0 was shown separately for each mouse in the 4-weeks-old group and 8-weeks-old group (*p < 0.05, Paired Wilcoxon-tests). k Histochemical verification of GCaMP6s expression in ebDGCs in coronal sections (bar = 50 μm). l Representative GCaMP signal of ebDGCs aligning with EEG recording during hippocampal seizure. m Mean fluorescence values of ebDGCs during hippocampal seizures (n = 5). n The statistical value of ΔF/F0 was shown for each mouse in the CaMKII-GcaMP6s group (*p < 0.05, Paired Wilcoxon-tests)
Then, to examine how proliferation of abDGCs would be involved in later recurrent epileptic seizures, we used Ca2+ fiber photometry to monitor the neural activity of abDGCs during later kindled seizures. We performed a dual-virus injection, a retroviral vector, which was previously used to target abDGCs,25,36 together with Cre-recombinase system to express genetically encoded Ca2+ indicator GCaMP6s (AAV-EF1a-DIO-GCaMP6s) in abDGCs, to “birthdate” abDGCs generated at 3 d after mice being fully kindled (named pUX-GCaMP6s mice, Fig. 1d). To verifiy the specificity of dual-virus strategies in labeling abDGCs with Ca2+ indicator GCaMP6, mice were perfused 3 weeks post virus injection and the immunostaining of doublecortin (DCX) was conducted. We found that 68.33% of GCaMP6-expressing cells were colocalized with DCX. Since the development and maturation of abDGCs is a dynamic process and DCX are only positive for a certain developmental stage of abDGCs, it is relatively difficult to use double-labeling with DCX to test the specificity, while this co-localization percentage is approximate to the published data.37 Thus, these results suggested that the strategies we used to label newborn abDGCs were relatively reliable (supplementary Fig. 1a–c). As the morphological and physiological phenotypes of abDGCs gradually become mature normally 4 weeks after birth,25,38 we measured changes in the GCaMP6s fluorescence of abDGCs by fiber photometry system with EEG monitoring, when they were 4-weeks-old and 8-weeks-old, separately (Fig. 1e, f). Aligning the GCaMP6 signals with EEG, our recordings revealed that at both 4- and 8- weeks post injection, kindled seizures coincided with decreased fluorescence signal in pUX-GCaMP6s mice (Fig. 1g, h). Accordingly, the mean ΔF/F0 recorded in abDGCs showed a significant decrease compared with the baseline state (Fig. 1i). Meanwhile, the maximum value of ΔF/F0 was shown separately for each trial (Fig. 1j). No significant GCaMP6s fluorescence change was observed in opsin-negative mice (supplementary Fig. 2d–f), suggesting seizure-dependent change of the neuronal activity was not due to movement artifacts. These results reveal a seizure-dependent inhibition of the neuronal activity of abDGCs, indicating both 4-weeks-old and 8-weeks-old abDGCs are directly involved in recurrent hippocampal seizures.
On the other hand, c-fos staining was also used to provide additional support for the inhibited activity of abDGCs (generated acutely after seizures) during seizures. We employed an alternative retroviral vector24,33 pROV-U6-ShRNA-EF1a-EGFP to “birthdate” abDGCs generated at 3 d after mice being fully kindled. After 4 weeks, mice were fully kindled again, perfusion was performed 1.5 h later and immunohistochemistry (IHC) was then conducted to evaluate c-fos expression. The results showed that only 15.3% of EGFP+-expressing cells were colocalized with fos (supplementary Fig. 2a–c), indicating that abDGCs generated at 3 d after mice being fully kindled may not be functionally activated during seizures. We also examined the neuronal activity of early-born dentate granule cells (ebDGCs) using Ca2+ fiber photometry as a comparison. In contrast, fluorescent signals recorded in ebDGCs increased during hippocampal seizures (Fig. 1k, l). Meanwhile, the mean ΔF/F0 also showed a significant increase and the maximum value of ΔF/F0 was shown separately for each trial, accordingly (Fig. 1m, n). Altogether, these results demonstrated that abDGCs and ebDGCs are functionally differently involved in recurrent seizures, and abDGCs are functionally inhibited during hippocampal seizures.
Optogenetic activation of abDGCs extends seizure durationTo further investigate the causal link between abDGCs and recurrent hippocampal seizures, we aimed to gain selective optogenetic activation of abDGCs. We microinjected AAV-EF1a-DIO-hChR2-EYFP together with pUX-cre into the DG 3 d after mice were fully kindled (named pUX-ChR2 mice, Fig. 2a). Representative images of EYFP-immunoreactive cells at different time points (3d, 7d, 2 week) showed the morphologic development of abDGCs in pUX-ChR2 mice (Fig. 2b), suggesting selective expression can be conferred to proliferating cells. The specificity of dual-virus strategies to selectively label abDGCs with ChR2 was also verified using IHC. The results showed that 61.97% of ChR2-expressing cells were colocalized with DCX (supplementary Fig. 3a–c). Further, IHC confirmed that ChR2 localized selectively to PROX1-expressing 8-weeks-old DGCs (82.35 ± 5.453% of EYFP+ neurons were PROX1+ neurons from 3 mice), indicating that 8-weeks-old abDGCs were mature DGCs (Fig. 2c).
Fig. 2
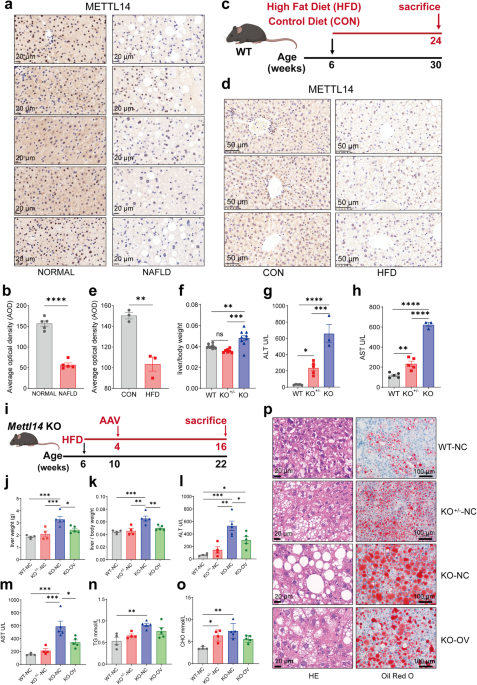
Optogenetic activation of abDGCs extends seizure duration. a Experiment scheme for optogenetic activation protocol in recurrent hippocampal seizures. The parameter of blue light stimulation is: 473 nm, 20 Hz, 10 ms/pulse and 600 pulses, 5 mW. b Representative images of EYFP-immunoreactive cells at different time points (3 days, 7 days, 2 weeks) after injection of virus cocktail (pUX-cre and AAV-EF1a-DIO-hChR2-EYFP) (bar = 50 μm). c Histochemical verification of ChR2-expressing abDGCs in the DG and double immunostaining of PROX1 (red) and ChR2-EYFP (green) in brain slices with 8-weeks-old abDGCs (bar = 50 μm) and the enlarged images (bar = 10 μm). White arrow points to the labeled abDGCs. d–g Effects of optogenetic activation of the 4-weeks-old abDGCs on seizure stage (d), latency to GS (e), ADD (f) and GSD (g) during hippocampal seizures (n = 8, *p < 0.05, **p < 0.01, Friedman-tests with post-hoc Dunn’s test for multiple comparisons). h–k Effects of optogenetic activation of the 8-weeks-old abDGCs on seizure stage (h), latency to GS (i), ADD (j) and GSD (k) during hippocampal seizures (n = 11, **p < 0.01, Friedman-tests with post-hoc Dunn’s test for multiple comparisons). l Typical EEGs and power spectrograms recorded from the hippocampus during seizures when optogenetically activating 8-weeks-old abDGCs; the solid black vertical bar indicates kindling stimulation artifact and the horizontal blue bar indicates the time for delivery of blue light. m Power spectral analysis of the EEGs of hippocampal seizures (*p < 0.05, Paired t-tests)
To evaluate the effect of activation of abDGCs on hippocampal seizures, we applied photo-stimulation to the DG immediately after hippocampal kindling stimulation, which was similar to the closed-loop stimulation pattern. As AAV transduction has been reported to impair the generation of abGCs,39 here we used self-control to test seizure-modulating effect with light on-off in optogenetic experiments. A recent study by McHugh et al., characterized the spiking activity of abDGCs, reporting that the average firing rate of abDGCs was significantly higher than that of the other DG pyramidal cells (abDGCs 2.3 Hz vs DG PCs 1.0 Hz),40 firstly provided evidence for the natural firing frequency of abDGCs under physiological states. While we were still lacking the evidence for the firing frequency of abDGCs during seizures, we selected the frequency 20 Hz, which is significantly higher than the natural firing rate of abDGCs under physiological states, to optogenetically stimulate them, based on our experience on optogenetic activation experiments.35,41We found that optogenetic activation of 4-weeks-old abDGCs did not influence seizure stage, possibly due to the ceiling effect. While, activation of abDGCs significantly prolonged afterdischarge duration (ADD) and GS duration (GSD) without interfering with the latency to GS (Fig. 2d–g), suggesting abDGCs may be involved in seizure maintenance. In parallel, optogenetic activation of 8-weeks-old abDGCs also extended seizure duration by increasing ADD and GSD (Fig. 2h–k). Typical ADDs and their corresponding power spectrums were shown in Fig. 2l. Spectral composition analysis of EEGs showed that optogenetic activation significantly increased the theta band power of seizure (Fig. 2m).
Furthermore, we employed an alternative retroviral vector24,38 pROV-EF1a-ChR2-mCherry to “birthdate” and optogenetically activate abDGCs. IHC confirmed that ChR2 localized selectively to PROX1-expressing DGCs (91.67 ± 9.28% of mCherry+ 8-weeks-old neurons were PROX1+ neurons from 3 mice, supplementary Fig. 4a, b). We found that optogenetic activation of both 4 (supplementary Fig. 4c–f) and 8-weeks-old abDGCs in this way also increased ADD and GSD (supplementary Fig. 4g–j). However, light delivery to opsin-negative controls has no effect on hippocampal seizures (supplementary Fig. 4k–n). Altogether, these results demonstrate that selective activation of abDGCs using two distinct approaches can both aggravate seizures by increasing their duration.
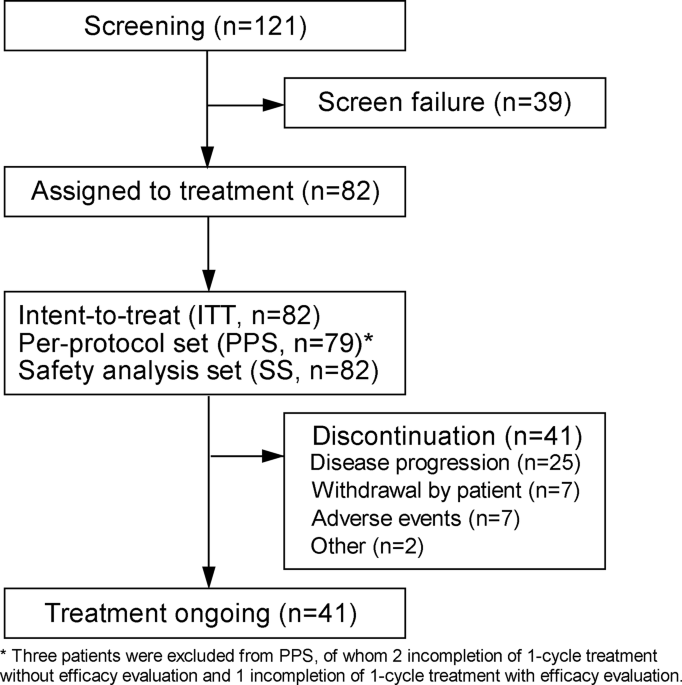
Optogenetic inhibition of the abDGCs shortens seizure durationNext, we used optogenetic method to selectively inhibit them, by injecting AAV-CAG-FLEX-ArchT-EGFP with pUX-cre into the DG (named pUX-Arch mice, Fig. 3a, b). To test the specificity of the retrovirus we used in the experiments, DCX expression was evaluated in pUX-Arch mice and we found that ~66.3% of retrovirus labeled cells were DCX+ (supplementary Fig. 5a, b). As the “natural” inhibition of abDGCs during seizures evolved gradually with the seizure development, optogenetics started immediately after the kindling stimulation would produce quicker and more powerful inhibition on abDGCs. We found that optogenetic inhibition of 4- and 8-weeks-old abDGCs, by the application of 589-nm yellow light, mitigated the severity of kindled seizures via shortening the ADD and GSD in pUX-Arch mice (Fig. 3c–j). Meanwhile, the seizure stage and the latency to GS were still left unaffected, suggesting abDGCs were involved in the maintenance of hippocampal seizures. Typical ADDs and their corresponding power spectrums were shown in Fig. 3k. Spectral composition analysis of EEGs showed that optogenetic inhibition of abDGCs did not affect seizure intensity in various rhythm bands (Fig. 3l). Here, interestingly, we found that optogenetic activation of abDGCs increased theta power, while inhibition did not change it, suggesting theta power in EEG of hippocampal seizure may not be pathological, but rather physiological and revelant to other functions. Thus, the above results indicate that the abDGCs generated at 3 days after mice are fully kindled bi-directionally modulate maintenance of hippocampal seizures.
Fig. 3
Optogenetic inhibition of abDGCs shortens seizure duration. a Experiment scheme for optogenetic inhibition protocol in recurrent hippocampal seizures. Continuous 30-s yellow light (589 nm, direct current, 5 mw) stimulation was applied. b Histochemical verification of Arch-expressing 4- and 8-weeks-old abDGCs in the DG (bar = 50 μm) and the enlarged images (bar = 10 μm). c–f Effects of optogenetic inhibition of the 4-weeks-old abDGCs on seizure stage (c), latency to GS (d), ADD (e) and GSD (f) during hippocampal seizure (n = 8, *p < 0.05, Friedman-tests with post-hoc Dunn’s test for multiple comparisons). g–j Effects of optogenetic inhibition of the 8-weeks-old abDGCs on seizure stage (g), latency to GS (h), ADD (i) and GSD (j) during hippocampal seizures (n = 8, *p < 0.05, **p < 0.01, Friedman-tests with post-hoc Dunn’s test for multiple comparisons). k Typical EEGs and power spectrograms recorded from the hippocampus during seizures when optogenetically inhibiting 8-weeks-old abDGCs; the solid black vertical bar indicates kindling stimulation artifact and the horizontal yellow bar indicates the time for delivery of yellow light. l Power spectral analysis of the EEGs of hippocampal seizures
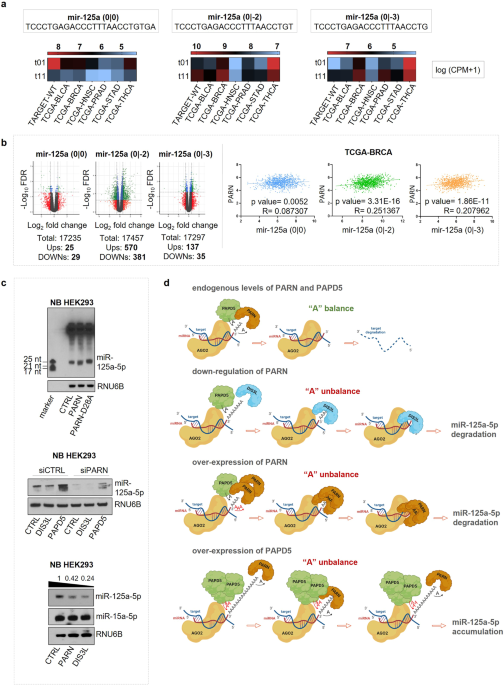
The abDGCs born at other stages do not affect hippocampal seizuresNext, we used optogenetic tools to dissect the sole contribution of abDGCs born at different stages in hippocampal seizures. In contrast to the initial transitory proliferative surge in the SGZ after kindled status, hippocampal neurogenesis, however, returns to the baseline level after 2 weeks.42 Here, instead of 3 days, a viral cocktail of pUX-cre and AAV-EF1a-DIO-hChR2-eYFP were microinjected 3 weeks after mice being fully kindled (Fig. 4a). IHC experiments confirmed that ChR2 localized selectively to PROX1-expressing 8-weeks-old abDGCs (74.33 ± 7.435% of 8-weeks-old EYFP+ neurons were PROX1+ neurons), while none was GFAP+ cell, indicating that most abDGCs born in the chronic phase after kindled status also mature into DGCs instead of astrocytes (Fig. 4b). We found that optogenetic activation of 8-weeks-old abDGCs exerted no significant effect on ADD, GSD, seizure stage and the latency to GS (Fig. 4c–f). Typical ADDs and their corresponding power spectrums were shown in Fig. 4g. Spectral composition analysis of EEGs showed no significant change of each band power (Fig. 4h).
Fig. 4
The abDGCs born at other stages of kindled status do not affect later recurrent hippocampal seizures. a Experiment scheme for optogenetic activation of abDGCs born at 3w after mice being fully kindled. b Histochemical verification of ChR2-expressing 8-weeks-old abDGCs in the DG. Left, double immunostaining of ChR2-EYFP (green) and PROX1 (red) and the enlarged images (bar = 50 μm). Right, double immunostaining of ChR2-EYFP (green) and GFAP (red) and the enlarged images (bar = 50 μm). c–f Effects of optogenetic activation of 8-weeks-old abDGCs, born 3 weeks after mice being fully kindled, on seizure stage (c), latency to GS (d), ADD (e) and GSD (f) during hippocampal seizures (n = 8). g Typical EEGs and power spectrograms recorded at the hippocampus during seizures when optogenetically activating 8-weeks-old abDGCs born at 3w after kindled status; the solid black vertical bar indicates kindling stimulation artifact and the solid horizontal blue bar indicates the time for blue light. h Power spectral analysis of the EEGs of hippocampal seizures. i Experiment scheme for optogenetic activation of abDGCs generated at −3d before kindling acquisition. j Histochemical verification of ChR2-expressing 8-weeks-old abDGCs in the DG. Left, double immunostaining of ChR2-EYFP (green) and PROX1 (red) and the enlarged images (bar = 50 μm). Right, double immunostaining of ChR2-EYFP (green) and GFAP (red) and the enlarged images (bar = 50 μm). k–n Effects of optogenetic activation of 8-weeks-old abDGCs, born 3 days before kindling acquisition, on seizure stage (k), latency to GS (l), ADD (m) and GSD (n) during hippocampal seizures (n = 10). o Typical EEGs and power spectrograms recorded at the hippocampus during seizures when optogenetically activating 8-weeks-old abDGCs born at −3d before kindling; the solid black vertical bar indicates kindling stimulation artifact and the solid horizontal blue bar indicates the time for blue light. p Power spectral analysis of the EEGs of hippocampal seizures
Further, immature DGCs born before the epileptogenic insult might also integrate improperly into the DG during epileptogenesis.14,43 Thus, the viral cocktail was also given 3 days before the beginning of kindling, approximately 1 week before mice being fully kindled (Fig. 4i). IHC also confirmed that ChR2 localized selectively to PROX1-expressing 8-weeks-old abDGCs but not GFAP+ glia (71.33 ± 4.677% of 8-weeks-old EYFP+ neurons were PROX1+ neurons, Fig. 4j). Unexpectedly, we found that optogenetic activation of 8-weeks-old abDGCs exerted no significant effect on ADD, GSD, seizure stage and the latency to GS (Fig. 4k–n). Typical ADDs and their corresponding power spectrums were shown in Fig. 4o. Spectral composition analysis of EEGs showed no significant change of each band power (Fig. 4p). Similarly, optogenetic inhibition of abDGCs born at 3 d before kindling also exerted no significant effect on seizure stage, latency to GS, ADD, and GSD (supplementary Fig. 6a–d). In addition, we also conducted fiber photometry experiments to assess the functional activity of 8-week-old abDGCs born at 3 weeks after kindled status. We found that although optogenetic activation of abDGCs born at 3 weeks after kindled status failed to intervene hippocampal seizures, they were functionally significantly activated during seizures (supplementary Fig. 6e–h). On the other hand, we calculated the number of total labeled abDGCs born at different timepoints and found that abDGCs born at 3 d after fully kindled were significantly more than 3 weeks after, while there is no significant correlation between number of total labeled neurons and their seizure-modulating effects (supplementary Fig. 7a–c). However, after calculating the number of ectopic abDGCs (located ectopically in the hilus), we found that seizure-modulating effect was proportional to the number of ectopic abDGCs (supplementary Fig. 7d), which is consistent with the previous study by Zhou et al.24 This suggests that number of ectopic abDGCs may account for the different effect of abDGCs born at different timepoints.
Additionally, we used a dual-virus tracing method (combining rabies virus-mediated retrograde trans-synaptic tracing with retroviral birthdating) to identify and compare the presynaptic inputs onto abDGCs generated at different timepoints relative to seizures. Generally, seizures influenced the connectivity ratio universally, which was defined as the number of input neurons per starter cell; meanwhile, such changes usually depended on the relative age of DGCs with regard to the seizure onsets. We found that abDGCs born acutely (3 days) after fully kindled showed significantly increased connectivity ratio; specifically, they received augmented inputs from neurons located both in the hippocampus and entorhinal cortex (EC). However, ebDGCs and abDGCs generated 3 weeks after fully kindled showed no significant changes in connectivity ratio from any of these areas (supplementary Fig. 8). According to the previous report,33 hippocampus DGCs receive axonal innervation diversely from many different brain structures, most of which convey excitatory signals. Notably, less attention has been paid to the GABAergic inputs of DGCs. However, as we have demonstrated in Fig. 1 and supplementary Fig. 6 using fluorometric monitoring of Ca2+ signaling; interestingly, while abDGCs born at 3 days after kindling were functionally inhibited, ebDGCs and abDGCs born 3 weeks after fully kindled were activated. Thus, distinguishing the inhibitory inputs of DGCs generated at different timepoints relative to seizures may also be of great importance. Calculating the input cells co-localized with GABA, we found that abDGCs generated acutely after seizures showed significantly increased percentage of GABA positive input cells in various subregions of hippocampus (supplementary Fig. 9), which may accout for the functional inhibition of abDGC born acutly after seizures. These above results indicated that abDGCs born at different timepoints experience different types of circuit re-organization.
Collectively, these data demonstrate that there is a critical early time period (3 days after fully kindled) after epileptogenic insult, for abDGCs to be involved in hippocampal seizures.
The abDGCs extend seizure duration via local recurrent excitatory circuit with ebDGCsNext, we aimed to see how the abDGCs born within above mentioned critical time period form pro-seizure neural circuits. We found that optogenetic activation of 8-weeks-old abDGCs born at 3 d after kindled status alone (without kindling stimulation) led to a large amount of c-fos expression in both ChR2-expressing abDGCs themselves and other neurons in the granule cell layer (GCL) (Fig. 5a, b). On the contrary, optogenetic activation of abDGCs in non-kindled (naïve) mice leads to sparse c-fos expression in GCL, with only several abDGCs located right under the optic fiber were c-fos+ (supplementary Fig. 10a, b), further suggesting circuit rearrangement of abDGC in epilepsy. Further, IHC verified that c-fos+ neurons were highly co-localized with PROX1-expressing neurons (94.73 ± 2.106% of c-fos+ neurons were PROX1+ neurons)(Fig. 5c), indicating that ChR2-expressing abDGCs can be optogenetically activated by the blue light and abDGCs may form excitatory connectivity with neighboring ebDGCs.
Fig. 5
The abDGCs activate local ebDGCs in epileptic mice. a Experimental scheme for optogenetic activation of 8-weeks-old abDGCs born at 3 days after kindled status leads to c-fos expression in both ChR2-expressing abDGCs and other PROX1+ neurons in the GCL. b Immunostaining of c-fos (red) and ChR2-EYFP (green) and the enlarged images (bar = 50 μm); c Immunostaining of PROX1 (purple), ChR2-EYFP (green) and c-fos (red) and the enlarged images (bar = 50 μm). d Scheme of experiment for in vivo single unit recording when optogenetically activating 8-weeks-old abDGCs born at 3d after kindled status. Insert, the typical DGC spike waveform. e Statistics of firing response of recorded DGCs with photo-stimulation of ChR2-expressing abDGCs in kindled status. f, g Representative peri-event raster histogram of DGCs firing in response to photo-stimulation of ChR2-expressing abDGCs (10 ms bins) with either instant (f) or delayed (g) latency. h Peristimulus time histogram of the representative DGC (aligned by the pulse light onset, blue rectangle) reveals its response frequency to the photo-stimulation (peak response latency ~15 ms). i The statistical value of firing rate was shown separately for each neuron (n = 6) (*p < 0.05, Paired Wilcoxon-tests). j Representative peri-event raster histogram of DGC firing in response to photo-stimulation of Arch-expressing abDGCs (10 ms bins). k Statistics of firing response of recorded DGCs with photo-inhibition of ArR2-expressing abDGCs in kindled status. l Experiment scheme for the Ca2+ fiber photometry experiment during optogenetic activation of abDGCs. m Immunostaining of ChrimsonR (red) and GCaMP6s (green) expression in the DG and the enlarged images (bar = 50 μm). n Left panel: Representative trace showed that optogenetic activation of abDGCs (10 s on-off, 635 nm) increased Ca2+ level in the mature ebDGCs reliably. Right panel: The statistical value of ΔF/F0 was shown separately for each mouse, which was calculated by averaging the peak ΔF/F0 values (n = 3). o Scheme of experiment for in vitro electrophysiology in the acute brain slices containing DG of kindled mice, photo-stimulation of ChR2-epressing abDGCs and whole-cell recording of them. p Typical whole-cell current recordings from ChR2-positive abDGCs. Membrane potential responses to a train of 10 ms pulses of blue light at 1 Hz. q Scheme of experiment for in vitro electrophysiology in the acute brain slices containing DG of kindling mice, photo-stimulation of ChR2-epressing abDGCs and whole-cell recording of neighboring ebDGCs. r Light-evoked excitatory postsynaptic currents (EPSCs) were recorded in ebDGCs during photo-stimulation (473 nm, 1 Hz, 10 ms, 5 pulses, 2 mW) of ChR2-expressing abDGCs in DG in normal ACSF (naive) in the presence of tetrodotoxin (TTX, 1 μM) and 4-amynopyridine (4-AP, 100 μM), and in the presence of the glutamate receptor antagonist D-2-Amino-5-phosphonovaleric acid (APV, 100 μM) and 6-cyano-7-nitroquinoxaline-2,3-dione. (CNQX, 40 μM)
Furthermore, we employed in vivo extracellular recordings and photo-stimulation to confirm the functional connection between ChR2-expressing abDGCs and ebDGCs in anesthetized pUX-ChR2 mice (Fig. 5d). According to previously published criteria,44,45 we discriminated DGCs based on their waveform and autocorrelogram of firing characteristics. The recorded DGCs (8 of 22) were found to be increased in spiking rates with different latencies by photostimulation. Specially, 6 out of 8 DGCs were found to be increased in spiking rates with an approximate 15-ms of latency (Fig. 5e–h). As the firing rate of ChR2-expressing neurons were usually immediately activated within much shorter latency (<4 ms) by the light stimulation,46,47 our data suggested ebDGCs might be activated by the pulsed laser from the upstream terminals of abDGCs. Conversely, optogenetic inhibition of Arch-expressing abDGCs were found to decrease the firing rate of DGCs in anesthetized pUX-Arch mice (Fig. 5i, j). On the other hand, we injected pUX-cre and AAV-hSyn-DIO-ChrimsonR-mCherry cocktail virus to label abDGCs. The ChrimsonR-expressed abDGCs can be functionally activated by the red light. Meanwhile, we also injected AAV-CaMKIIα-GCaMP6s-EGFP to label already mature ebDGC (Fig. 5l, m). We found that optogenetic activation of abDGCs (10 s on-off) largely increased Ca2+ level in the mature ebDGCs reliably (Fig. 5n), indicating that excitatory connections between abDGC and ebDGC.
Furthermore, we performed in vitro electrophysiology to confirm the functional connection between abDGCs and ebDGCs. Firstly, to test whether ChR2-labeled abDGCs can be reliably photo-activated, we conducted whole-cell current-clamp recordings of ChR2+ abDGCs in acute DG slices of kindled mice. Flashing blue light pulses (473 nm) were delivered to the slice and ChR2+ abDGCs recorded fired single action potentials in response to each light pulse (Fig. 5o, p). Then, glutamate-mediated synaptic currents were evoked by flashing blue light pulses during whole-cell recording from ebDGCs. Tetrodotoxin (TTX) and 4-amynopyridine (4-AP) are often used to block action potential-dependent synaptic transmission in indirect circuits; thus, the light-evoked excitatory postsynaptic currents (EPSCs) still existed in the presence of them in our experiments, demonstrating the existence of direct monosynaptic input from abDGCs to ebDGCs. The synaptic currents were eliminated when the glutaminergic receptor antagonists D-APV and CNQX were applied (Fig. 5q, r), confirming the transmission of glutamate. Altogether, these results indicate that activation of abDGCs can result in increased neuronal activity of neighboring ebDGCs in the DG.
Then, we aimed to evaluate whether ebDGCs in the GCL are involved in hippocampal seizures. Three days after the mice were fully kindled, AAV-CaMKIIα-ChR2-mCherry and AAV-CaMKIIα-Arch-EYFP were used to label and modulate ebDGCs as previous studies (named CaMKIIα-ChR2 or CaMKIIα-Arch mice respectively, Fig. 6a).48,49 IHC confirmed that ChR2 was successfully expressed on DGCs (99.13% ± 5.332 of mCherry+ neurons were PROX1+ neurons) (Fig. 6b). We found that directly optogenetic activation of ebDGCs was capable of inducing seizures in kindled mice without kindling stimulation in CaMKIIα-ChR2 mice (Fig. 6c), while optogenetic inhibition of ebDGCs decreased the ADD and GSD in CaMKIIα-Arch mice (Fig. 6d). However, different from the photo-stimulation of abDGCs, the severity of seizure (ADD and GSD) returned to their baseline level after withdrawal of the light. Typical ADDs and their corresponding power spectrums were also shown (Fig. 6e). These data suggest that ebDGCs in the GCL also directly contribute to hippocampal seizures.
Fig. 6
The abDGCs extend seizure duration via local recurrent excitatory circuit with ebDGCs. a Experiment scheme for optogenetic activation/inhibition of ebDGCs. b Histochemical verification of ChR2- and Arch-expressing ebDGCs in the GCL. Left, immunostaining of ChR2-mCherry (red) and PROX1 (green) (bar = 50 μm) and the enlarged images of co-localization of both stains (bar = 10 μm); Right, histochemical verification of ArchT-expressing ebDGCs in the DG (bar = 50 μm). c Light delivery to activate ebDGCs was sufficient to induce seizures in kindled CaMKIIα-ChR2 mice. Left panel: Typical EEGs of ebDGC activation-evoked seizure. Right panel: The incidence of ebDGC activation-induced seizures was 100% (n = 4). d Inhibition of ebDGCs shortened the ADD and GSD during hippocampal seizures in CaMKIIα-Arch mice (n = 7, *p < 0.05, **p < 0.01, Friedman-tests with post-hoc Dunn’s test for multiple comparisons). e Typical EEGs and power spectrograms recorded from hippocampus when optogenetically inhibiting ebDGCs; the solid black vertical bar indicates kindling stimulation artifact and the horizontal yellow bar indicates the time for yellow light. f Experiment scheme for optogenetic activation protocol in the presence of glutamate antagonists (intra-DG injection, CNQX 10 μM plus AP-5 25 μM, 1:1, 0.5 μL). The drugs were injected 5 min before the insertion of optic fiber to deliver blue light. g Optogenetic activation of abDGCs in pUX-ChR2 did not have any pro-seizure effects in the presence of intra-DG injection of glutamate antagonists (n = 7). h Intra-DG injection of glutamate blocker cocktails alone did not influence the ADD and GSD. i Experiment scheme for chemogenetic silencing of ebDGC and simultaneous optogenetic activation of abDGCs. CNO was injected (3.0 mg/kg, i.p.) 30 min before the 4th stimulation. j Representative histochemical image of ChR2-EYFP-expressing abDGCs (green) and hM4D-mCherry-expressing ebDGCs (red)(bar = 50 µm). k Effects of optogenetic activation of abDGCs on kindled seizures, while simultaneously chemogenetic inhibiting ebDGCs (n = 9, *p < 0.05, Friedman-tests with post-hoc Dunn’s test for multiple comparisons). Mice using in this experiment were tested beforehand to ensure that optogenetic activating of abDGCs reliably prolonged seizure duration. l CNO treatment alone did not influence the ADD and GSD of control animals injected with AAV-CamKIIα-GFP (n = 9)
Further, to examine whether the local ebDGCs were essential for mediating the pro-seizure effect of abDGCs, we used a pharmacological method to block excitatory glutamatergic transmission in the DG. We found that optogenetic activation of abDGCs did not have any pro-seizure effects in the presence of intra-DG injection of cocktail blockades of glutamate receptors CNQX and AP-5 (Fig. 6f, g), suggesting local glutamatergic transmission was required for pro-seizure effects of abDGCs. Surprisingly, the injection of cocktail blockades alone did not affect hippocampal seizure (Fig. 6h), which may be due to the possibility that glutamatergic transmission was inhibited in both glutamatergic and GABAergic neurons. Meanwhile, to more selectively silence ebDGCs, we focally injected chemogenetic virus AAV-CaMKIIα-hM4Di-mCherry in pUX-ChR2 mice, thus inactivation of ebDGCs can be achieved simultaneously when photo-activating ChR2-expressing abDGCs (Fig. 6i, j). The pUX-ChR2 mice used in this experiment were given blue light stimulations beforehand to confirm that optogenetic activating of abDGCs reliably prolonged seizure duration. We found that chemogenetic inhibition of ebDGCs alone significantly truncated ADD compared with control; Meanwhile, optogenetic activation of abDGCs cannot reproduce its pro-seizure effect upon the treatment of Clozapine N-oxide (CNO) (Fig. 6k). Moreover, we did not observe any significant reduction in seizure severity during CNO treatment in control mice (Fig. 6l), indicating that the anti-seizure effect was not due to the drug effect of CNO itself. In summary, all the above results indicate that ebDGCs may be the downstream effector mediating the pro-seizure effect of abDGCs. The abDGCs generated within a critical early period extended seizure duration by local recurrent excitatory circuits with ebDGCs.
Repeated inhibi
留言 (0)