
記住我


Colistin, a polycationic peptide, serves as a last-resort antimicrobial, which can be used to treat infections caused by multidrug-resistant (MDR), extensively drug-resistant (XDR), and pan-drug-resistant (PDR) Gram-negative bacteria (El-Sayed Ahmed et al., 2020; Binsker et al., 2022). Consequently, colistin has been designated by the World Health Organization (WHO) as a highest priority critically important antimicrobial for human medicine (World Health Organization, 2019). Due to the critical importance of colistin as an antibiotic of last resort, colistin resistance among Gram-negative pathogens represents an increasingly dire global public health threat (El-Sayed Ahmed et al., 2020; World Health Organization, 2021; Binsker et al., 2022).
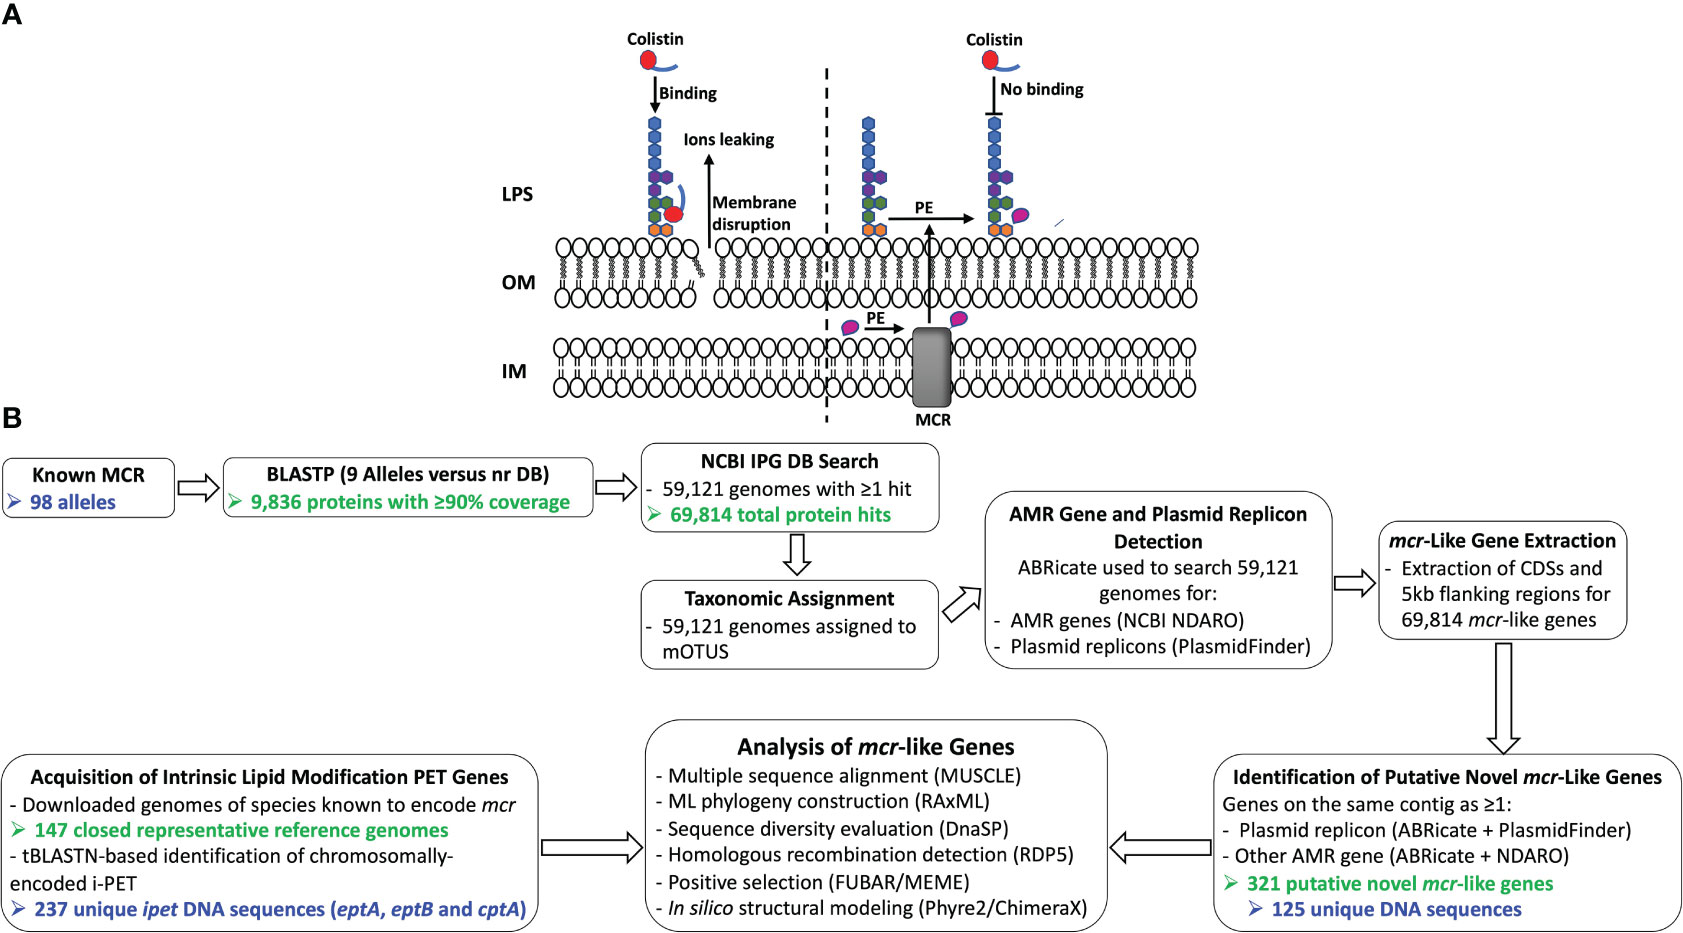
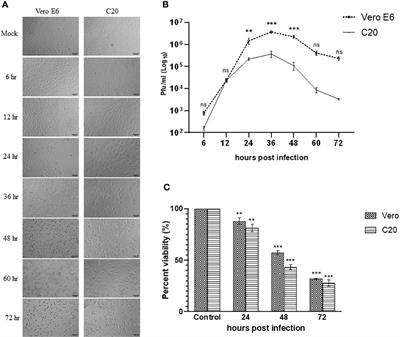
The binding of colistin to bacterial cells is initiated by an electrostatic attraction between the colistin cationic head group and the anionic phosphate group on the lipid A of the bacterial lipopolysaccharide (LPS), which displaces Ca2+ and Mg2+ ions (Olaitan et al., 2014; El-Sayed Ahmed et al., 2020). Subsequently, colistin’s hydrophobic tail integration in the lipid bilayers leads to cell membrane disruption and cell death by targeting cytoplasmic membrane LPS (Trimble et al., 2016; Sabnis et al., 2021) (Figure 1A). Multiple colistin resistance mechanisms have been reported, including (i) modification of lipid A (Guo et al., 1997; Gunn et al., 1998); (ii) expression of a multi-drug efflux system in Pseudomonas aeruginosa (Abuoun et al., 2017); (iii) the complete loss of LPS in Acinetobacter baumannii (Moffatt et al., 2010); (iv) overproduction of capsular polysaccharide in Klebsiella pneumoniae (Campos et al., 2004); and (v) enzymatic degradation of colistin via colistin-degrading proteases in Stenotrophomonas maltophilia (Ito-Kagawa and Koyama, 1980; Lee et al., 2022). The main mechanism of bacterial colistin resistance is the modification of lipid A via the addition of a cationic group, such as phosphoethanolamine (pEtN), 4-amino-4-deoxy-L-arabinose, and glycine to lipid A (Trimble et al., 2016), which reduces the overall membrane negative charge and subsequently decreases colistin binding affinity to the cell (Olaitan et al., 2014; El-Sayed Ahmed et al., 2020). While it has been shown that lipid A is essential for growth in most bacterial species, lipid A modifications are dispensable for cell survival under laboratory growth conditions (Trent, 2004; Raetz et al., 2007; Parsons and Rock, 2013). However, lipid A modification plays a significant role in bacterial adaptation to different stress conditions, including mild acid stress, change in oxygen level, increase in growth temperature, pH change, osmotic stress, and the presence of cationic antimicrobial compounds (Trent, 2004; Raetz et al., 2007; Gunn, 2008; Anandan and Vrielink, 2020a; Troudi et al., 2021).
Figure 1 (A) Schematic diagram of colistin’s mode of action and resistance mechanism. Colistin, a cationic antimicrobial peptide, binds to the negatively charged lipid A, displacing membrane-bound cations and disrupting membrane integrity by inserting the hydrophobic tail into the membrane’s lipid (panel A, left). Lipid A modification neutralizes the negative membrane charge, thus reducing colistin binding and cell susceptibility to colistin (panel A, right). IM, inner membrane; LPS, lipopolysaccharide; MCR, mobilized colistin resistance protein; OM, outer membrane; PE, phosphoethanolamine. (B) Schematic outline of the main methodologies used to acquire and characterize MCR and MCR-like proteins from publicly available whole-genome sequencing (WGS) data (see the Materials and Methods section for details). The number of MCR, putative novel MCR-like, and/or intrinsic lipid modification phosphoethanolamine transferase (i-PET) proteins produced at relevant steps are shown in green text; the number of such genes/proteins used in final analyses are shown in blue text. AMR, antimicrobial resistance; BLASTP, protein basic local alignment search tool; CDSs, coding sequences; DB, database; IPG, Identical Protein Group; LPS, lipopolysaccharide; MCR, mobilized colistin resistance amino acid sequences; ML, maximum likelihood; mOTUs, marker gene-based operational taxonomic units; NCBI, National Center for Biotechnology Information; NDARO, National Database of Antibiotic Resistant Organisms; nr, non-redundant protein sequence; (i) -PET, (intrinsic) phosphoethanolamine transferases; tBLASTN, translated nucleotide basic local alignment search tool.
Some Gram-negative bacteria (e.g., Neisseria, Serratia, Brucella, Burkholderia spp.) showcase intrinsic resistance to colistin; others, including pathogenic Enterobacteriaceae, can acquire resistance via numerous mechanisms, including chromosomal mutations (e.g., those that modify the bacterial cell surface) and/or mobilized colistin resistance (mcr) genes (El-Sayed Ahmed et al., 2020; World Health Organization, 2021; Binsker et al., 2022). mcr genes represent a particularly notable and concerning mechanism of colistin resistance, as they are predominantly plasmid-borne and/or associated with transposon insertional elements and can facilitate the acquisition and rapid dissemination of colistin resistance (Kieffer et al., 2017; Trebosc et al., 2019; El-Sayed Ahmed et al., 2020). mcr encodes an inner membrane-anchored protein that belongs to a complex group of phosphoethanolamine transferase (PET) enzymes (Gao et al., 2016), which add phosphoethanolamine (pEtN) to the 4’ phosphate group of lipid A (Cox et al., 2003; Reynolds et al., 2005; Tamayo et al., 2005b; Raetz et al., 2007; Parsons and Rock, 2013; Anandan et al., 2017). Gram-negative bacterial species possess one or more chromosomal PET genes, which function in intrinsic lipid modification, including EptA, EptB, and CptA (Anandan and Vrielink, 2020a). For example, Escherichia coli str. K-12 substr. MG1655 harbors homologs of EptA, EptB, and CptA (Reynolds et al., 2005; Zhao et al., 2019; Anandan and Vrielink, 2020b). We will collectively refer to eptA, eptB, and cptA genes as ipet (intrinsic lipid modification PET) genes and their products as i-PET enzymes or proteins. Lipid A modifying i-PET enzymes phylogenetically cluster into three distinct groups that correlate with the enzyme specificity to the pEtN-acceptor substrate site on the LPS. More specifically, (i) EptA adds pEtN to the N-acetylglucosamine moiety of lipid A, (ii) EptB adds pEtN to the 3-deoxy-d-manno-octulosonic acid (KDO) of the LPS core region, and (iii) CptA/EptC adds pEtN to the second heptose of the LPS core region (Harper et al., 2017; Anandan and Vrielink, 2020a).
Interestingly, MCR proteins share a high degree of sequence and structural similarity with i-PET enzymes present in many Gram-negative bacteria (Bakovic et al., 2007; Anandan and Vrielink, 2020a; Samantha and Vrielink, 2020), including pathogenic members of Enterobacteriaceae (El-Sayed Ahmed et al., 2020; Gogry et al., 2021). PET protein structure includes two discretely folded domains connected by a bridging helix and extended loop, an N-terminal transmembrane domain, and a C-terminal periplasmic soluble catalytic domain (Anandan et al., 2017; Anandan and Vrielink, 2020a). Moreover, PET proteins are metalloenzymes that share a conserved zinc-binding site tetrahedrally coordinated by the side chains of conserved Glu246, Thr285, His466, and Asp465 residues (numbers corresponding to the MCR-1 sequence), with the Thr285 residue acting as the catalytic nucleophile for the pEtN transfer (Stojanoski et al., 2016; Anandan et al., 2017). While multiple conserved or partially conserved amino acid (AA) residues were suggested to be involved in pEtN binding (Sun et al., 2017; Dortet et al., 2018; Stogios et al., 2018; Carroll et al., 2019; Garcia-Menino et al., 2020), the lipid-binding pocket remains poorly defined (Carroll et al., 2019).
As of April 2022, ten major groups of MCR proteins have been defined based on their AA identities/similarities (termed MCR-1 to -10, which are encoded by mcr genes mcr-1 to -10, respectively) (Liu et al., 2016; Xavier et al., 2016; Abuoun et al., 2017; Borowiak et al., 2017; Carattoli et al., 2017; Yin et al., 2017; Wang et al., 2018b; Yang et al., 2018; Carroll et al., 2019; Wang et al., 2020). Here, we will refer to these major groups as “mcr families” or “MCR families” (for nucleotide sequences/genes and amino acid sequences/proteins, respectively), as has been proposed previously (Partridge et al., 2018). Within MCR families, AA sequence identities and similarities can vary. Here, we will use the term “mcr allele” or “MCR allele” to denote specific variants of genes and proteins within a given MCR family, respectively (e.g., alleles within the mcr-3 family are denoted as mcr-3.1, mcr-3.2, mcr-3.3, and so on, and their products as MCR-3.1, MCR-3.2, MCR-3.3, and so on, respectively) (Partridge et al., 2018). In total, >95 MCR alleles have been described as of April 2022.
While MCR proteins share a conserved overall structure (Stojanoski et al., 2016; Sun et al., 2017; Xu et al., 2018a; Carroll et al., 2019; Son et al., 2019), the genes that encode them vary in terms of sequence similarity (Li et al., 2018; Carroll et al., 2019; Ramaloko and Osei Sekyere, 2022). Moreover, it has been suggested that mcr alleles can vary in terms of the colistin resistance levels they confer (Nang et al., 2019; El-Sayed Ahmed et al., 2020). However, the molecular bases of mcr genetic and phenotypic heterogeneities are poorly understood. Furthermore, it has been suggested that mcr evolved from an eptA chromosomal gene copy via mobilization and that Moraxella spp. are a potential source for MCR-like colistin resistance determinants (Kieffer et al., 2017). Indeed, several lines of evidence support the notion that mcr evolved from eptA through mobilization, including: (i) MCR and EptA share a conserved overall protein structure and acceptor substrate specificity, (ii) ISApl1-dependent mobilization of mcr has been demonstrated (Abuoun et al., 2017; Kieffer et al., 2017), and (iii) insertion of ISApl1 upstream of eptA increased eptA expression and led to an increased level of colistin resistance in XDR Acinetobacter baumannii isolates (Trebosc et al., 2019). However, the exact ancestor of mcr and the molecular mechanism of evolution of intrinsic lipid modification eptA to mobilized colistin-resistant determinant remain unknown.
Here, we aim to provide further insight into the evolutionary relationships between mcr families, all within the context of ipet. We show that some ipet genes (e.g., eptA) may differ from canonical mcr in terms of their genomic context, and we identify differentially conserved residues, which may play a role in the levels of colistin resistance conferred by different mcr alleles. Finally, using a large number (>69,000) of MCR and MCR-like proteins extracted from publicly available bacterial genomes, we identify 125 putative novel mcr-like genes (representing 13 clusters at an 80% AA identity threshold), which may be co-harbored on plasmids with other antimicrobial resistance (AMR) genes. Overall, the results presented here provide insight into the evolution and diversity of mcr and ipet genes.
2 Materials and methods2.1 Acquisition of MCR and MCR-like amino acid sequencesA representative amino acid (AA) sequence from each published MCR family (i.e., at the time of the search, MCR-1 to -9, accessed April 23, 2019; Supplementary Table S1) was queried against the National Center for Biotechnology Information (NCBI) non-redundant (nr) protein database using the protein BLAST (BLASTP) webserver (https://blast.ncbi.nlm.nih.gov/Blast.cgi?PAGE=Proteins; accessed April 23-24, 2019) (Johnson et al., 2008). BLASTP default settings were used for all parameters except max target sequences, which was raised to 5,000. BLASTP hits corresponding to proteins with high query coverage (i.e., ≥90% of the length of the original MCR query) were maintained in subsequent steps (n = 41,270 of 45,001 total hits). Because MCR families can share low degrees of AA identity (e.g., < 40%) (Partridge et al., 2018), no additional sequence identity thresholds were employed so that potentially novel, remote MCR homologs could be identified. From all 41,270 BLASTP hits, the union of all nr protein accession numbers was taken, yielding a total of 9,866 nr protein accession numbers associated with MCR and MCR-like proteins. The AA sequences of all 9,866 MCR and MCR-like proteins, as well as all associated NCBI Identical Protein Group (IPG) accession numbers, were downloaded using the rentrez package version 1.2.1 (Winter, 2017) in R version 3.5.3 (R Core Team, 2021). Finally, known MCR families are similar in terms of sequence length (e.g., the representatives of MCR-1 to -9 listed in Supplementary Table S1 ranged from 538-565 AA in length, with an average/median length of 545/541 AA). We thus removed BLASTP hits that represented extreme outliers based on sequence length as follows: the median absolute deviation of the lengths of the AA sequences of all MCR and MCR-like proteins was calculated, and AA sequences of MCR-like proteins falling outside the range of sequence lengths encompassed by 15 times the median absolute deviation were removed (with 30 proteins removed by this step).
Overall, this initial BLASTP search yielded a total of 9,836 MCR and MCR-like AA sequences, which were used in subsequent steps (Supplementary Table S2). While this search did not specifically query MCR families and alleles described after the access date (i.e., April 23, 2019), the selected BLASTP parameters allowed us to detect MCR families and alleles, which were in NCBI’s nr database but were not yet discovered and published. For example, MCR-10 was not specifically queried in the initial BLASTP search (Supplementary Table S1), as it had not yet been discovered (Wang et al., 2020). However, the approach described above identified MCR-10.1 in NCBI’s nr database prior to its discovery, and MCR-10.1 was thus included among the 9,836 MCR and MCR-like proteins used in subsequent steps (NCBI Protein Accession WP_023332837.1; Supplementary Table S2).
2.2 Acquisition and characterization of genomes harboring MCR-like proteinsNCBI RefSeq Assembly accession numbers for all genomes associated with ≥1 MCR or MCR-like protein in NCBI’s IPG database were acquired via rentrez (see section “Acquisition of MCR and MCR-like amino acid sequences” above). Latest assembly versions for all RefSeq genomes were then downloaded via NCBI’s FTP site (n = 59,129 total genomes; accessed May 19, 2020). To confirm that ≥1 MCR or MCR-like protein could be detected in each genome, the BLASTX algorithm implemented in DIAMOND version 0.9.13.114 (Buchfink et al., 2015) was used to perform a translated search of each genome against AA sequences of all 9,836 MCR and MCR-like proteins identified as described above, plus the AA sequences of all 53 known MCR alleles available in ResFinder at the time (so that proteins that most closely resembled a known MCR allele would be labeled as such; https://cge.cbs.dtu.dk/services/ResFinder/, see section “Acquisition of MCR and MCR-like amino acid sequences” above) (Zankari et al., 2012). The following DIAMOND BLASTX parameters were used to confirm the presence of MCR and/or MCR-like proteins: a maximum E-value threshold of 1e-5 (-e 0.00001), a minimum subject coverage threshold of 90% (–subject-cover 90), a minimum percent AA identity of 90% (–id 90). This resulted in a total of 69,814 confirmed hits of MCR and MCR-like proteins in 59,121 RefSeq genomes, which were used in subsequent steps (Supplementary Table S2).
To assign each genome to a species using a standardized taxonomic framework, all 59,121 genomes were assigned to a marker-gene based operational taxonomic unit (mOTU) using classify-genomes (accessed June 3, 2020; https://github.com/AlessioMilanese/classify-genomes) and version 2.5 of the mOTUs taxonomy (Milanese et al., 2019) (Supplementary Table S2). Antimicrobial resistance (AMR) genes were detected in each genome via the nucleotide BLAST-based approach implemented in ABRicate version 0.9.8 (https://github.com/tseemann/abricate), using the NCBI National Database of Antibiotic Resistant Organisms (NDARO; accessed April 19, 2020) (Feldgarden et al., 2019). ABRicate was additionally used to detect plasmid replicons present in the PlasmidFinder database (Carattoli et al., 2014) in each genome (accessed April 19, 2020). AMR genes and plasmid replicons were considered to be present in a genome using minimum nucleotide identity and coverage thresholds of 80% each (Supplementary Table S2). PlasFlow version 1.1.0 (Krawczyk et al., 2018) was additionally used to predict whether contigs were plasmid-associated or chromosomal in origin (using default settings; Supplementary Table S2).
2.3 Identification of putative novel mcr-like genesOf the 69,814 MCR and MCR-like proteins identified in 59,121 genomes from NCBI’s RefSeq database (see section “Acquisition and characterization of genomes harboring MCR-like proteins” above), we identified 321 MCR-like proteins, which were located on the same contig as (i) ≥1 plasmid replicon (detected via ABRicate and the PlasmidFinder database) and (ii) ≥1 additional AMR gene (detected via ABRicate and the NDARO), with contigs harboring previously described mcr alleles excluded (see section “Acquisition and characterization of genomes harboring MCR-like proteins” above for details regarding plasmid replicon and AMR gene detection; Supplementary Table S2). These criteria were used to identify and prioritize putative novel MCR-like proteins, as (i) the presence of a plasmid replicon on the same contig as an MCR-like protein indicated that the MCR-like protein and plasmid replicon were likely to be in close proximity (thus predicting that the gene was on a plasmid, rather than a chromosome); and (ii) the presence of other AMR genes on the same contig as an MCR-like protein indicated that the MCR-like protein may have been harbored on a plasmid that was potentially associated with multidrug-resistance. These 321 MCR-like proteins represented 125 unique nucleotide sequences, which we will refer to hereafter as “putative novel mcr-like genes” and their products as “putative novel MCR-like proteins” (Supplementary Table S3).
2.4 Acquisition of chromosomally encoded intrinsic lipid modification PET genesClosed representative genome sequences of 147 reference species known to harbor mcr genes were downloaded from the NCBI RefSeq Assembly database (accessed March 12, 2021). These included Enterobacteriaceae (NCBI txid543), Proteus (NCBI txid583), Aeromonas (NCBI txid642), and Moraxella (NCBI txid475) species (Supplementary Table S4). Assembled genomes were imported into Geneious version 2019.2.3 (Biomatters, Auckland, New Zealand), and sequences of complete closed chromosomes were extracted for subsequent analysis. AA sequences of E. coli str. K-12 substr. MG1655 CptA (NCBI Protein Accession WP_000556306.1), EptA (NCBI Protein Accession WP_000919792.1), and EptB (NCBI Protein Accession WP_001269197.1) were queried against the closed chromosome sequences using translated nucleotide BLAST (tBLASTN, as implemented in Geneious version 2019.2.3). A total of 237 unique hits that showed ≥90% query coverage were selected to represent chromosomally encoded intrinsic lipid modification PET genes (Supplementary Table S5). We will collectively refer to eptA, eptB, and cptA intrinsic lipid modification PET-encoding genes as ipet genes and their products as i-PET enzymes or proteins.
2.5 Construction of maximum likelihood phylogeny of mcr and mcr-like genesMaximum likelihood (ML) phylogenies were inferred from the nucleotide sequences of (i) all mcr alleles available in NCBI’s NDARO (n = 98, accessed March 12, 2021; Supplementary Table S6), (ii) putative novel mcr-like genes identified in this study (n = 125; see section “Identification of putative novel mcr-like genes” above) and/or (iii) ipet (n = 237) coding sequences (see section “Acquisition of chromosomally encoded intrinsic lipid modification PET genes” above; Supplementary Table S7). Back-translated nucleotide multiple sequence alignments (NTbtn-MSA) were constructed using MUSCLE (Edgar, 2004) with the default settings in Geneious version 2019.2.3. The resulting NTbtn-MSAs were used to construct ML phylogenies with 100 bootstrap replicates via RAxML, using the GTRGAMMA nucleotide substitution model and default settings (RAxML GUI version 2.0.7 and RAxML version 8.2.12) (Stamatakis, 2014). The resulting trees were visualized and edited using iTOL version 6.5 (https://itol.embl.de/) (Letunic and Bork, 2007).
2.6 Clustering of PET amino acid sequencesAA sequences of the MCR, putative novel MCR-like, and i-PET proteins (n = 98, 125, and 237 proteins, respectively; Supplementary Table S7) were clustered into families using CD-HIT version 4.8.1 (Li and Godzik, 2006; Fu et al., 2012) with an 80% AA sequence identity threshold (-c 0.8) and a word length of 5 (-n 5; i.e., the value suggested by CD-HIT for the given AA sequence identity threshold). CD-HIT clusters that did not contain a known MCR allele at the 80% AA sequence identity threshold were treated as putative novel MCR families, as 80% AA identity represents a conservative threshold for MCR family delineation (e.g., at this threshold, MCR-1, MCR-2, and MCR-6 clustered together and would be considered to be members of the same MCR family) (Partridge et al., 2018).
2.7 Descriptive sequence analysisThe number of polymorphic sites, nucleotide diversity per site, average pairwise nucleotide differences per sequence, number of synonymous substitutions (S) and non-synonymous substitutions (N), and the dN/dS ratio for each NTbtn-MSA were calculated using DnaSP version 6.12.03 (Supplementary Table S7; see section “Construction of maximum likelihood phylogeny of mcr and mcr-like genes” above) (Rozas et al., 2017).
2.8 Homologous recombination detectionThe Recombination Detection Program (RDP5) was used to detect homologous recombination events within the NTbtn-MSA of mcr, putative novel mcr-like, and ipet genes (n = 98, 125, and 237 genes, respectively; Supplementary Table S7) (Martin et al., 2021). Seven homologous recombination detection methods (RDP, BOOTSCAN, GENECON V, MAXCHI, CHIMAERA, SISCAN, and 3Seq) were used to perform a full exploratory recombination analysis using the default settings in RDP5. Only recombination events detected by at least three methods were selected for further analysis to reduce false positives. Recombination events with similar breakpoints were merged into a single event, and the overall significance of the recombination evidence for each event was evaluated via the Pairwise Homoplasy Index (PHI) test with default settings in RDP5.
2.9 Positive selection analysisThe Datamonkey server (https://www.datamonkey.org/) (Weaver et al., 2018) was used to identify mcr residues that evolved under positive selection. The “hyphy cln” command within HyPhy version 2.5.32(MP) (Kosakovsky Pond et al., 2020) was used to remove stop codons within the NTbtn-MSA of the 98 known mcr alleles (see section “Construction of maximum likelihood phylogeny of mcr and mcr-like genes” above; Supplementary Table S6). The resulting cleaned alignment was supplied as input to the command line implementation of GARD (Kosakovsky Pond et al., 2006; Weaver et al., 2018; Kosakovsky Pond et al., 2020), which was used to detect recombination breakpoints within the alignment using default settings. GARD partitioned the dataset into fragments of 1-1,204 bp and 1,205-1,779 bp.
The resulting partitioned dataset produced by GARD (with suffix ".best.gard") was supplied as input to the following (both accessed January 27, 2022): (i) FUBAR (Fast, Unconstrained Bayesian AppRoximation; https://www.datamonkey.org/fubar), which uses a Bayesian approach to infer non-synonymous (dN) and synonymous (dS) substitution rates on a per-site basis and assumes constant selection pressure for each site along the entire phylogeny (Murrell et al., 2013); (ii) MEME (mixed-effect model evolution-based positive selection analysis; https://www.datamonkey.org/meme), which tests the hypothesis that individual sites have been subjected to episodic positive selection (Murrell et al., 2012). For both FUBAR and MEME, the universal genetic code option was selected; for FUBAR, additional parameters under “advanced options” were set to their default values.
2.10 In silico structural modeling and construction of sequence logosStructural modeling of MCR-1 was done using the Phyre2 server (accessed June 20, 2021) (Kelley et al., 2015) based on Neisseria meningitidis lipooligosaccharide phosphoethanolamine transferase EptA (Anandan et al., 2017). The protein structure was viewed and annotated using UCSF ChimeraX version 1.3 (Pettersen et al., 2021). Residues predicted to have evolved under positive selection were mapped on the MCR-1 protein 3D structural model using UCSF ChimeraX (Pettersen et al., 2021).
An NTbtn-MSA and encoded AA-based MSA of the 98 known mcr alleles were constructed using MUSCLE (Edgar, 2004) with default settings in Geneious version 2019.2.3. The ESPript 3 server version 3.0.8 was used to align MCR-1 secondary structure elements onto the AA MSA of the 98 known MCR alleles (Robert and Gouet, 2014). Residues under negative or positive selection were mapped onto the AA MSA of the 98 known MCR alleles in Geneious version 2019.2.3. The 19 AA residues and codons (57 bases) identified by MEME were extracted from the corresponding MSA across the 98 mcr alleles in Geneious and saved as separate MSA FASTA files. The resulting MSA FASTA files were used to construct AA and nucleotide graphical representation logos via the WebLogo3 server (accessed May 26, 2022) (Crooks et al., 2004).
An AA-based MSA of MCR, putative novel MCR-like, and i-PET proteins (n = 98, 125, and 237 proteins, respectively; Supplementary Table S7) was constructed using MUSCLE with default settings in Geneious version 2019.2.3 (Edgar, 2004). The ESPript 3 server version 3.0.8 was used to align EptA secondary structure elements onto the MSA (Robert and Gouet, 2014). The resulting MSA was used to visually identify cysteine residues involved in disulfide bond formation across the different proteins based on the experimentally identified disulfide bonds in the EptA structure (Anandan et al., 2017) and site-directed mutagenesis analyses of the corresponding sites in CptA (Zhao et al., 2019).
2.11 Characterization of the genomic context of PET-encoding genesTo characterize the genomic context surrounding different PET-encoding genes, genomic regions 5 Kb upstream and downstream of all PET-encoding genes were extracted from each PET-harboring genome (i.e., all genomes in which MCR and MCR-like proteins were detected, and all i-PET-harboring genomes used in this study; Supplementary Tables S2, S4, respectively). NCBI Prokaryotic Genome Annotation Pipeline (PGAP) annotations (Tatusova et al., 2016) were used to identify genes directly upstream and downstream of PET-encoding genes (i.e., not separated from PET-encoding genes by another ORF). Sequences were visually examined, and genes were considered to be in the same operon if they were located within approximately < 20 nucleotides and had no apparent promoter-like sequence in this intergenic region.
2.12 Collection of phenotypic colistin resistance dataColistin minimum inhibitory concentration (MIC) data were collected from the literature (Supplementary Table S8) (Di Pilato et al., 2016; Liu et al., 2016; Xavier et al., 2016; Abuoun et al., 2017; Borowiak et al., 2017; Carattoli et al., 2017; Ling et al., 2017; Liu et al., 2017; Lu et al., 2017; Poirel et al., 2017; Tijet et al., 2017; Yang et al., 2017; Yin et al., 2017; Zhao et al., 2017; Alba et al., 2018; Carattoli et al., 2018; Chavda et al., 2018; Dortet et al., 2018; Duggett et al., 2018; Eichhorn et al., 2018; Fernandes et al., 2018; Garcia-Graells et al., 2018; Hammerl et al., 2018; Kieffer et al., 2018; Li et al., 2018; Liu et al., 2018; Poirel et al., 2018; Rebelo et al., 2018; Shen et al., 2018; Teo et al., 2018; Wang et al., 2018b; Wang et al., 2018c; Wise et al., 2018; Xiang et al., 2018; Xu et al., 2018b; Xu et al., 2018c; Yang et al., 2018; Abdul Momin et al., 2019; Bitar et al., 2019; Chavda et al., 2019; Cui et al., 2019; Deshpande et al., 2019; Hadjadj et al., 2019; Li et al., 2019; Long et al., 2019; Wang et al., 2019; Yang et al., 2019; Yuan et al., 2019; Zhang et al., 2019; Zheng et al., 2019; Bitar et al., 2020; Cha et al., 2020; Fan et al., 2020; Garcia-Menino et al., 2020; Hatrongjit et al., 2020; Lei et al., 2020; Martins-Sorenson et al., 2020; Neumann et al., 2020; Ngbede et al., 2020; Wang et al., 2020; Anyanwu et al., 2021; Hu et al., 2021; Khanawapee et al., 2021; Leangapichart et al., 2021; Snyman et al., 2021; Stosic et al., 2021; Uddin et al., 2021; Yu et al., 2021). A search of NCBI’s PubMed database (https://pubmed.ncbi.nlm.nih.gov/) was conducted on August 13, 2021, using keywords [mcr and colistin resistance]. The search results were exported to an EndNote library (EndNote 20, Clarivate, Philadelphia, USA). A similar search was performed on the Web of Science Core Collection database (Clarivate, Philadelphia, USA), and the search results were used to amend the EndNote library. Duplicate entries in the EndNote library were deleted, and full-text PDF files were downloaded using EndNote “Find Full Text”. When needed, Supplementary Materials were downloaded and incorporated into the PDF file.
The EndNote library was searched for each known mcr allele using the allele designation (e.g., mcr-3.3) with the “Any Field + PDF with Notes” search criteria. The search results were sorted by date to identify the primary publication(s) describing the allele for the first time. The full-text articles were visually scanned to identify the publication(s) describing (i) the identification of the allele and (ii) the functional characterization of colistin resistance. The “Materials and Methods” and “Results” sections that described colistin resistance phenotypic data were examined carefully, and colistin MIC data were collected. We opted to use MIC values determined by the broth microdilution method, which is recommended by the European Committee on Antimicrobial Susceptibility Testing (EUCAST) (Jayol et al., 2018). We excluded MIC data determined by agar dilution and gradient agar disk diffusion (colistin gradient strip zone of inhibition) methods, which have been suggested to be less accurate in determining colistin resistance levels when compared to the broth microdilution method (Chew et al., 2017; Garcia-Menino et al., 2020; Yusuf et al., 2020). If no data were identified in the EndNote library for specific mcr alleles, we performed an additional search using Google Scholar, using the given allele’s designation.
Colistin MIC values reported for native mcr-harboring strains (Supplementary Table S8) were base-2 logarithm-transformed using the log2 function in R and displayed in a heatmap using iTOL version 6. An ML phylogeny of species reported for the native mcr-harboring strains was additionally supplied to iTOL. Briefly, a type strain and/or NCBI species reference genome was downloaded from NCBI’s RefSeq Assembly database for each mcr-harboring native strain species (n = 18 total species, with one genome selected per species; Supplementary Table S8). The “classify_wf” workflow implemented in the Genome Taxonomy Database Toolkit (GTDB-Tk) version 2.1.0 was used to construct an AA MSA of all 18 genomes, as well as to confirm species assignments reported in NCBI (using version R207_v2 of GTDB) (Chaumeil et al., 2019; Parks et al., 2022). The AA MSA produced by GTDB-Tk (i.e., the file named “gtdbtk.bac120.user_msa.fasta”) was supplied as input to IQ-TREE version 1.5.4 (Nguyen et al., 2015), which was used to construct the ML phylogeny, using (i) the optimal AA substitution model selected via Bayesian Information Criteria values produced via ModelFinder (i.e., the “LG+F+R3” model) (Yang, 1995; Le and Gascuel, 2008; Soubrier et al., 2012; Kalyaanamoorthy et al., 2017); and (ii) one thousand replicates of the ultrafast bootstrap approximation (Minh et al., 2013).
3 Results3.1 MCR-like proteins are distributed across a wide range of Gram-negative bacterial taxaA protein BLAST (BLASTP)-based search for MCR and MCR-like proteins in NCBI’s nr and IPG databases showed that MCR- and MCR-like proteins were distributed across a wide range of Gram-negative bacterial taxa (Figure 1). More than 69,000 BLASTP hits against known MCR families were detected in whole-genome sequencing (WGS) data spanning 256 bacterial genera, including Escherichia, Shigella, Salmonella, Klebsiella, Aeromonas, Moraxella, Enterobacter, Xanthomonas, and Pseudomonas spp. (per the mOTUs taxonomy; Supplementary Table S2). Among the 69,814 total BLASTP hits to MCR and MCR-like proteins identified here, 15,321 (21.9%) corresponded to proteins annotated as EptA (i.e., the associated protein was annotated in NCBI with the term “EptA” or “eptA”; Supplementary Table S2). Mobilization is a hallmark of mcr, and insertion sequence (IS) elements have been found to flank some mcr alleles; thus, we also searched for transposon-related elements (e.g., IS elements or transposase genes) within the 5 Kb flanking regions of the 69,814 mcr and mcr-like genes identified here (Supplementary Table S2). Overall, we found that 1,097 of the 69,814 mcr and mcr-like genes possessed transposon-related elements within their 5 Kb flanking regions (based on NCBI Prokaryotic Genome Annotation Pipeline [PGAP] annotations within these regions, accessed May 19-21, 2020; Supplementary Table S2) (Tatusova et al., 2016). It has been reported that multiple mcr alleles have lost one or both IS elements (Snesrud et al., 2017; Snesrud et al., 2018; Wang et al., 2018a; El-Sayed Ahmed et al., 2020). Thus, we did not include the presence of IS elements as a criterium for the identification of mcr and putative novel mcr-like genes in this study.
As mcr genes are typically plasmid-borne, while intrinsic lipid modification PET-encoding genes (ipet genes) are typically chromosomally encoded, we hypothesized that mcr-like genes detected on the same contig as a plasmid replicon and other antimicrobial resistance (AMR) genes were more likely to encode PET associated with colistin resistance. Initially, we identified 321 BLASTP hits to MCR proteins, which met these criteria (defined here as “putative novel MCR-like proteins” and their encoding genes designated as “putative novel mcr-like genes”; Figure 1B and Supplementary Table S3). Sequence similarities showed that the 321 putative novel mcr-like genes represented 125 unique nucleotide sequences, which were selected for further analyses (Figure 1B and Supplementary Tables S3, S7). To further analyze these genes, we created a back-translated nucleotide multiple sequence alignment (NTbtn-MSA) of the 125 unique, putative novel mcr-like genes identified here, along with 98 known mcr alleles (Supplementary Tables S3, S6). These 223 sequences showed an average pairwise nucleotide diversity per site (p) of 0.42675, with an average number of pairwise nucleotide differences per sequence (k) of 623.052 over 1,776 sites. The relatively high p value observed here was not surprising, as it has been shown previously that mcr families encompass an extensive degree of genetic diversity (Khedher et al., 2020); this is also evident within an NTbtn-MSA constructed using the 98 known mcr alleles alone (i.e., p = 0.3614 and k = 553.669 over 1,776 sites; Supplementary Table S6).
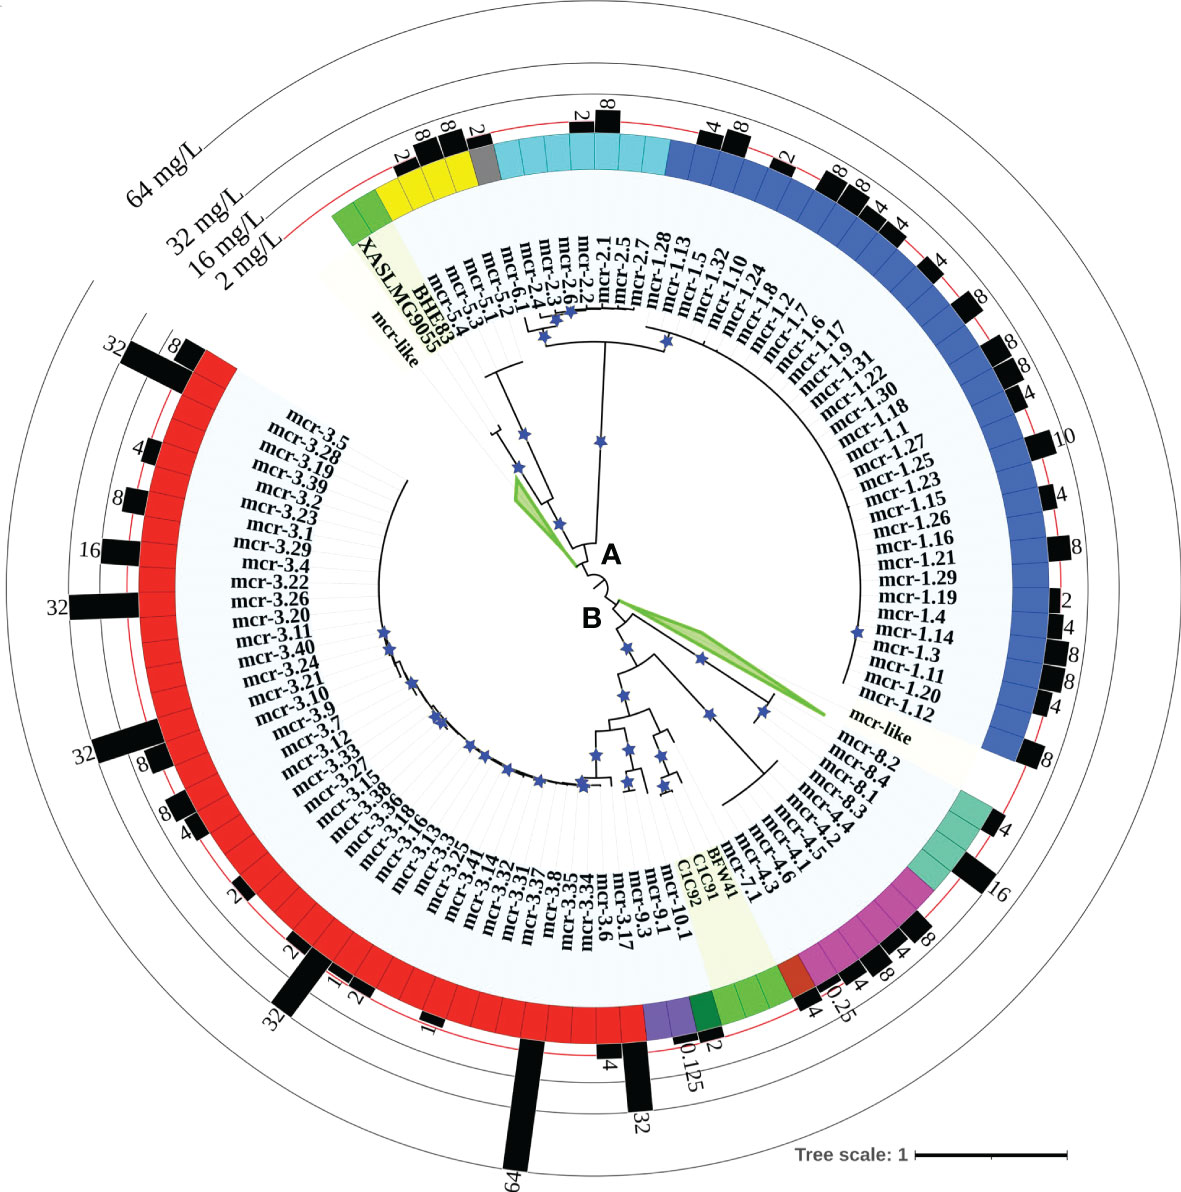
A maximum likelihood (ML) phylogeny inferred from the NTbtn-MSA of known mcr alleles and putative novel mcr-like genes showed a robust separation of clades and subclades representing different mcr families (Figure 2 and Supplementary Figure S1). Specifically, mcr alleles clustered into two distinct phylogenetic lineages: (i) lineage A included alleles belonging to the mcr-1, mcr-2, mcr-5, and mcr-6 families, and (ii) lineage B included all remaining mcr alleles (Figure 2 and Supplementary Figure S1). Interestingly, both clades contained putative novel mcr-like genes, with 21 and 103 putative novel mcr-like genes clustering into lineage A and B, respectively (Figure 2 and Supplementary Figure S1). While some putative novel mcr-like genes clustered with known mcr families (i.e., three genes clustered with mcr-7.1 and two genes clustered with mcr-5; Supplementary Figure S1), the majority of novel mcr-like genes grouped into two large phylogenetic clades that were distinct from known mcr families (Figure 2 and Supplementary Figure S1).
Figure 2 Maximum likelihood (ML) phylogeny inferred from a nucleotide back-translation-based multiple sequence alignment (NTbtn-MSA) of (i) 98 mcr alleles and (ii) 125 unique sequences of mcr-like genes located on the same contig as ≥1 plasmid replicon and ≥1 other antimicrobial resistance (AMR) gene (i.e., “putative novel mcr-like genes”). Sequences were aligned using MUSCLE. The ML phylogeny was constructed with RAxML, using the GTRGAMMA nucleotide substitution model and 100 bootstrap replicates. The tree was edited using the iTOL web server (https://itol.embl.de/) and rooted at the midpoint, with branch lengths reported in substitutions per site. Branches with bootstrap values ≥70% are denoted by blue stars. Clades exclusively composed of putative novel mcr-like genes were collapsed for clarity (green branches; see Supplementary Figure S1 for a fully expanded tree). Tip label shading corresponds to known mcr alleles (light blue) and putative novel mcr-like genes identified in this study (light green). The colors of the inner ring represent different mcr families (mcr-1 to -10). The outer graph represents the maximum reported colistin minimum inhibitory concentration (MIC) values of native strains harboring different mcr alleles. The colistin breakpoint established by the Clinical and Laboratory Standards Institute (CLSI) is 2 mg/L (red line). Isolates with colistin MIC ≥2 mg/L are considered colistin-resistant. Colistin MIC values were compiled from different mcr-harboring Gram-negative species as listed in Supplementary Table S8; metadata associated with each gene can be found in Supplementary Table S6.
3.2 Some mcr alleles are more closely related to eptA than to other mcr allelesConsistent with the wide range of genetic diversity observed among nucleotide sequences of mcr families, AA sequence similarities among MCR families also varied widely, with similarities ranging from 59.3% to 100% and identities ranging from 29.7% to 99.8% (Supplementary Tables S9, S10). To gain further insight into MCR diversity in the context of intrinsic lipid modification PET (i-PET), we identified and aggregated AA and nucleotide sequences associated with 237 chromosomally encoded i-PET proteins (i.e., EptA, EptB, and CptA; Supplementary Table S5). These i-PET proteins were extracted from 147 genomes of genera, which had been reported to harbor mcr (e.g., Aeromonas, Citrobacter, Cronobacter, Enterobacter, Escherichia, Klebsiella, Moraxella, Proteus, and Salmonella spp.; Supplementary Tables S4, S5) (Nang et al., 2019). The nucleotide and AA sequences of the 237 chromosomally encoded i-PET proteins identified here were compared to those of the 98 known MCR alleles, as well as the sequences of the 125 putative novel MCR-like proteins identified here (n = 460 total PET; Supplementary Table S7). Based on nucleotide sequences, all 460 PET-encoding genes queried here displayed extensive sequence diversity (i.e., p = 0.50571 and k = 450.085; Supplementary Table S7).
Based on AA sequences, MCR alleles shared a relatively low degree of AA similarity with EptB and CptA, ranging from 46% to 58% and 42% to 49%, respectively (Supplementary Tables S9 and S10). Notably, however, MCR alleles differed in terms of the degree of AA similarity they shared with EptA: overall, MCR allele AA similarities to EptA ranged from 61% to 76%, while some MCR alleles shared a higher degree of AA similarity to EptA than to other MCR alleles (Supplementary Tables S9, S10). For example, MCR-8.1 showed average similarities of 72.8 ± 1.1% to EptA and 70 ± 7% to other MCR alleles (Supplementary Tables S9 and S10). Conversely, MCR-1.1 showed average similarities of 64.5 ± 1.5% to EptA and 76.1 ± 18.1% to other MCR alleles (Supplementary Tables S9 and S10). This suggests that sequence similarity alone cannot sufficiently discriminate canonic EptA from MCR.
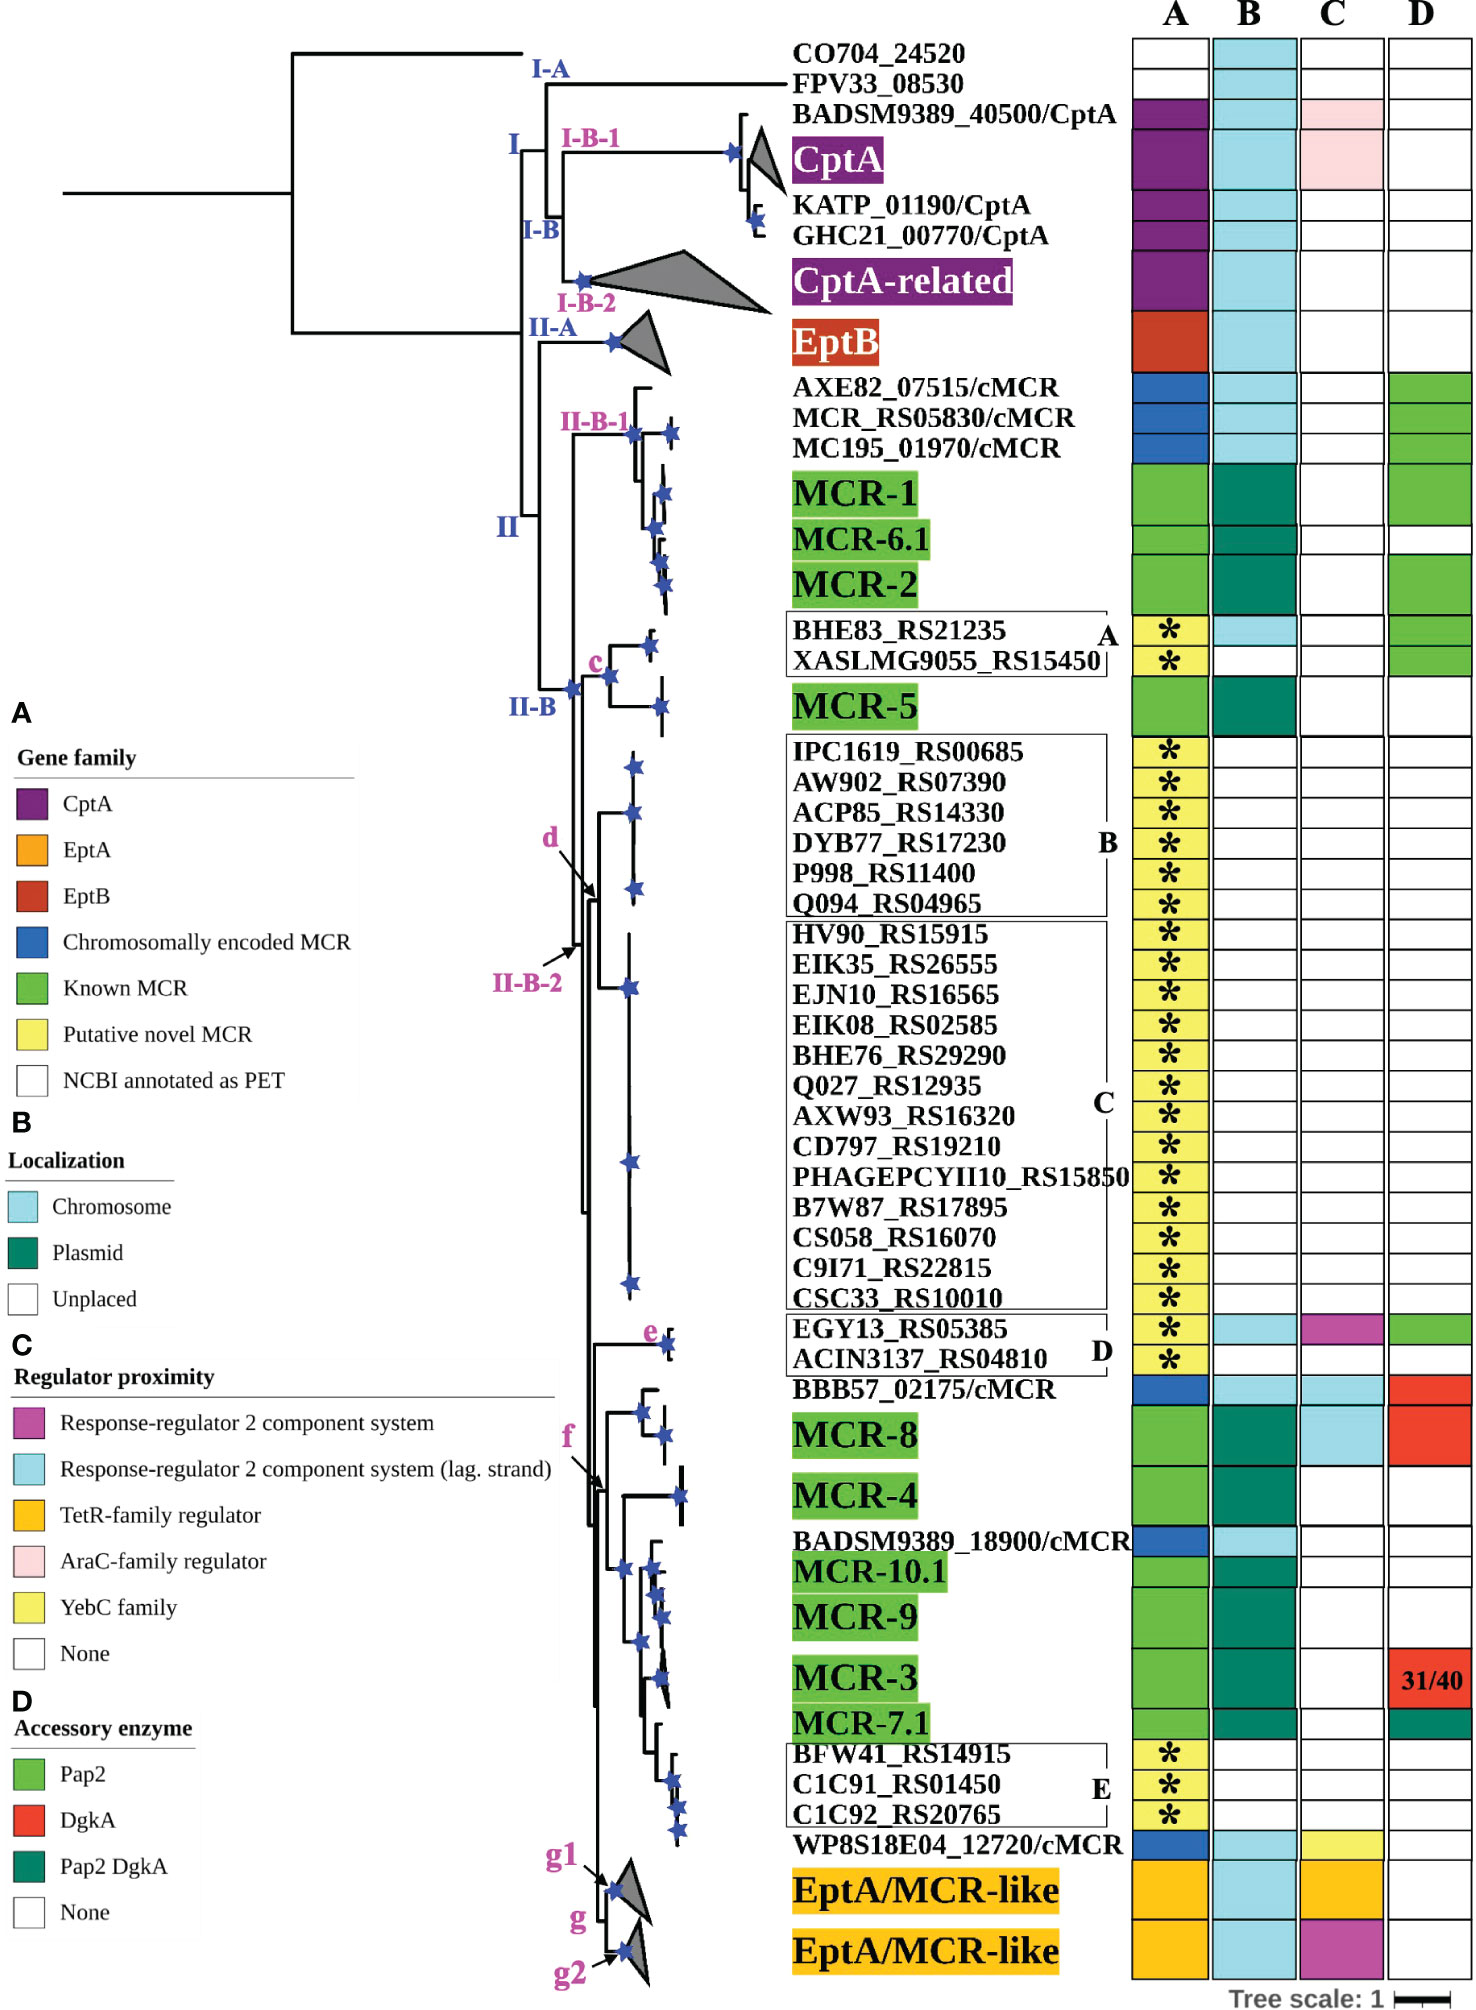
3.3 Colistin resistance and intrinsic lipid modification PET proteins represent distinct clades, which show some associations with PET functionalityTo further characterize the diversity and evolution of PET-encoding genes, we constructed an ML phylogeny using the nucleotide sequences of the 98 known mcr, 125 putative novel mcr-like, and 237 ipet genes identified here (representing a total of 460 PET-encoding nucleotide sequences; monophyletic groups within this phylogeny will be referred to as “lineages”, followed by “clades”, “subclades”, and “clusters”, Supplementary Table S7). The phylogeny of these 460 PET-encoding genes included one singleton gene, as well as (i) lineage I (105 taxa), which included cptA genes, and (ii) lineage II (354 taxa), which included eptA, eptB, mcr, and all 125 putative novel mcr-like genes (Figure 3 and Supplementary Figure S2). Lineage I included clades I-A and I-B, with two large I-B subclades (subclade I-B-1 and I-B-2; Figure 3 and Supplementary Figure S2). Subclade I-B-1 represented bona fide cptA, based on sequence similarity to experimentally confirmed cptA genes (Tamayo et al., 2005a). Subclade I-B-2, on the other hand, represented 71 chromosomally encoded ipet genes, but did not include any experimentally confirmed cptA genes (Figure 3 and Supplementary Figure S2). The fact that subclade I-B-2 clustered with the cptA-containing subclade I-B-1 may, however, indicate that genes in subclade I-B-2 encode enzymes with acceptor substrate specificities similar to, but not identical to, the substrate specificity of CptA. Within lineage II, eptA and eptB clustered into distinct phylogenetic groups (clade II-A and cluster II-B-2g, respectively; Figure 3 and Supplementary Figure S2). Overall, this suggests clustering of PET-encoding genes is correlated with the enzymes’ acceptor substrate specificities, consistent with previous reports (Harper et al., 2017) (Figure 3 and Supplementary Figure S2).
Figure 3 Maximum likelihood (ML) phylogeny inferred from a nucleotide back-translation-based multiple sequence alignment (NTbtn-MSA) of (i) 98 mcr alleles, (ii) 125 unique sequences of mcr-like genes located on the same contig as ≥1 plasmid replicon and ≥1 other antimicrobial resistance (AMR) gene (i.e., “putative novel mcr-like genes”), and (iii) 237 chromosomal phosphoethanolamine transferase (ipet) genes. Sequences were aligned using MUSCLE. The ML phylogeny was constructed with RAxML, using the GTRGAMMA nucleotide substitution model and 100 bootstrap replicates. The tree was edited using the iTOL web server (https://itol.embl.de/) and rooted at the midpoint, with branch lengths reported in substitutions per site. Branches with bootstrap values ≥70% are denoted by blue stars. Linages and clades described in the main text are numbered in blue, while subclades and clusters are numbered in magenta. Clades exclusively composed of genes from the same family were collapsed and color-coded, as shown in the left color legend key (see Supplementary Figure S2 for a fully expanded tree). Five PET families clustered based on an 80% AA identity threshold representing 26 putative novel mcr genes are identified by black boxes around the taxa names with capital letters A to E and asterisks in color strip (A). Color-coded regions in strip (A) denote mcr families, putative novel mcr-like genes, and eptA, eptB, and cptA homologues. Color-coded regions in strip (B) denote gene localization as chromosomally encoded (cyan), plasmid-encoded (green), or unplaced (white); localization was assigned based on the first gene reported in the literature (note that for some gene families, e.g., mcr-3, chromosomally encoded genes have also been reported). Color-coded regions in strip (C) represent the regulatory system juxtaposing phosphoethanolamine transferase (PET)-encoding genes: magenta regions represent genes contained within the same operon as a two-component response sensor-regulatory system; cyan regions represent genes located divergent of a two-component response sensor-regulatory system; orange regions represent genes located adjacent to a TetR-type regulator; pink regions represent genes located adjacent to an AraC-type regulator; yellow region represents gene located adjacent to a YebC-type regulator; white regions represent genes represented by single-gene operons with no upstream or downstream regulatory protein. Color-coded regions in strip (D) represent PET-encoding genes localized adjacent to accessory enzyme-encoding genes, including pap2 encoding lipid A phosphatase (light green), dgkA encoding diacylglycerol kinase (red), or both pap2 and dgkA genes (dark green); white regions represent the absence of accessory enzyme-encoding genes upstream or downstream of PET-encoding genes.
Clade II-B represented subclades II-B-1 and II-B-2; alleles belonging to the mcr-1, mcr-2, and mcr-6 families clustered into subclade II-B-1, while alleles belonging to the remaining mcr families clustered into subclade II-B-2 (along with the eptA genes, which represent cluster II-B-2g; Figure 3 and Supplementary Figure S2). Overall clustering was consistent between this phylogeny (Figure 3) and the phylogeny based only on mcr and mcr-like genes (Figure 2), expect for the placement of the mcr-5 family and two closely related genes (i.e., gene loci BHE83_RS21235 and XASLMG9055_RS15450), which were placed with mcr-1, mcr-2 and mcr-6 in Figure 2 and with mcr-3, mcr-4, mcr-7, mcr-8, mcr-9, and mcr-10 in Figure 3 (consistent with the fact that the mcr-5 branch did not receive strong bootstrap support in either phylogeny; Figures 2, 3). Notably, all 125 putative novel mcr-like genes were grouped into subclade II-B-2; 99 of these genes clustered with eptA genes (cluster II-B-2g) rather than with known mcr alleles (Figure 3), even though these 99 genes were co-localized on a contig with a plasmid replicon and additional AMR gene(s) (Supplementary Tables S2, S3). The remaining 26 putative novel mcr-like genes clustered with known mcr alleles in the ML phylogeny, including (i) two and three genes that clustered with mcr-5 and mcr-7 (clusters II-B-2c and II-B-2f; Figure 3), and (ii) 21 putative novel mcr-like genes that formed two distinct phylogenetic clusters (groups II-B-2-d and II-B-2e; Figure 3). These data suggest that these 26 putative novel mcr-like genes are likely to be previously unidentified mcr genes.
Our phylogeny also provided further evidence that some mcr families and alleles (i.e., mcr-3, mcr-4, mcr-5, mcr-8, and mcr-7.1) are more closely related to eptA than to other mcr alleles (i.e., mcr-1, mcr-2, and mcr-6.1; Figure 3 and Supplementary Figure S2) and that mcr genes and eptA share a single common ancestor. Interestingly, the phylogeny constructed here also showed that chromosomally encoded mcr genes, which have previously been reported (Ling et al., 2017; Dortet et al., 2018; Stogios et al., 2018; Wang et al., 2021), represent four distinct phylogenetic groups. The chromosomally encoded mcr genes of three Moraxella spp. were included in subclade II-B-1 (loci numbers AXE82_07515, MC195_01970, and MCR_RS05830; Figure 3 and Supplementary Figure S2). Chromosomally encoded mcr genes from Kosakonia sacchari (locus number BBB57_02175), Aeromonas caviae (locus number WP8S18E04_12720), and Buttiauxella agrestis (locus number BADSM9389_18900) grouped into clusters II-B-2e, II-B-2f, and II-B-2f, respectively (Figure 3 and Supplementary Figure S2).
3.4 The genomic contexts of mcr genes and eptA are widely diverseTo identify additional criteria that may aid in mcr gene identification, we assessed the genomic context of eptA, eptB, cptA, mcr, and the 125 putative novel mcr-like genes identified here (Figure 3; Supplementary Figure S2 and Supplementary Table S11). Genes in lineage I represented two different genomic contexts: (i) the majority of cptA genes in subclade I-B-1 (n = 26 out of 33) were located 70-200 nucleotides upstream of an AraC-type transcriptional regulator-encoding gene, while (ii) all 71 cptA-related genes in subclade I-B-2 were represented by single gene operons (Figure 3; Supplementary Figure S2 and Supplementary Table S11). In comparison, genes in clade II-A (which represented eptB; n = 66) were always represented by single-gene operons (Figure 3; Supplementary Figure S2 and Supplementary Table S11).
The 99 putative novel mcr-like genes that clustered with eptA into cluster II-B-2g, as well as the 59 chromosomally encoded eptA genes, represented two genomic contexts that partitioned into two distinct phylogenetic subgroups (g1 and g2) within cluster II-B-2g (Figure 3 and Supplementary Figure S2). All genes in the “g1” subgroup (n = 37) were found to be located adjacent to a putative TetR/AcrR family transcriptional regulator (Figure 3; Supplementary Figure S2 and Supplementary Table S11). In contrast, all genes in the “g2” group (n = 121) were located in an operon with a PmrAB-like two-component sensor histidine kinase-response regulator system (Figure 3, Supplementary Figure S2, and Supplementary Table S11). Importantly, the known mcr genes (which were grouped into subclades II-B-1 and II-B-2) showed genomic contexts that were distinct from the genomic context of the ipet genes (detailed in the preceding paragraph); genomic context also differed among the mcr families (Figure 3; Supplementary Figure S2 and Supplementary Table S11). Among the mcr genes in subclade II-B-1, mcr-1 and mcr-2 alleles were located in a putative operon upstream of PAP2 family lipid A phosphatase-encoding pap2 (with some pap2 in proximity to mcr-2 showing evidence for truncation), while mcr-6.1 represented a single gene operon. Interestingly, among the mcr genes in cluster II-B-2f, mcr-7.1 was located 125 nucleotides upstream of an operon that contained pap2, as well as dgkA (which encodes a diacylglycerol kinase), while mcr-3 alleles were located upstream of dgkA. This is of relevance, as it has been shown that pap2 and dgkA play a role in mcr-dependent colistin resistance through recycling and modification of lipid metabolism byproducts (Choi et al., 2020; Gallardo et al., 2020; Purcell et al., 2022). Among the other mcr genes in subclade II-B-2, mcr-8 alleles were located adjacent to, but divergent from, an operon containing a two-component sensor histidine kinase-response regulator, while alleles belonging to the remaining mcr families (mcr-4, mcr-5, mcr-9.1, and mcr-10.1) were single-gene operons (Figure 3; Supplementary Figure S2 and Supplementary Table S11). The genomic context of the 26 putative novel mcr-like genes in clade II-B included the following: (i) the 19 genes in cluster II-B-2d, as well as the three genes in cluster II-B-2f, and the gene ACIN3137_RS04810 in cluster II-B-2e were classified as single gene operons; (ii) the two genes in cluster II-B-2c were located within an operon with a pap2 gene; and (iii) the EGY13_RS05385 gene in cluster II-B-2e was located in an operon with a PmrAB-like two-component sensor histidine kinase-response regulator system and divergent from a pap2 gene (Figure 3; Supplementary Figure S2 and Supplementary Table S11). This suggests that the genomic contexts of the 26 putative novel mcr-like genes in clade II-B are similar to those of known mcr genes.
3.5 Structurally and functionally important disulfide bonds are differentially conserved among different MCR and i-PET familiesSequence analysis of EptA, EptB, CptA, and known MCR proteins showed that five disulfide bonds, which were identified in the EptA structure (Anandan et al., 2017), were differentially conserved among different MCR families (Supplementary Figure S2 and Supplementary Table S7). Previously, structural and mutational analyses of the E. coli EptC, a CptA homolog, revealed that the inability of EptC to confer colistin resistance was due to the lack of several disulfide bonds (Zhao et al., 2019). Zhao et al. (Zhao et al., 2019) suggested that the disulfide bonds function synergistically to restrain the flexibility of different loops, especially a loop near the active site, which forms part of a potential substrate entry tunnel. Our sequence analysis showed that CptA homologs (i.e., lineage I) did not have any predicted disulfide bonds. In contrast, EptA and EptB homologs (cluster II-B-2g and clade II-A, respectively) were predicted to contain five and three disulfide bonds, respectively (Supplementary Figure S2 and Supplementary Table S7). Interestingly, three predicted disulfide bonds were conserved in MCR-1, MCR-2, and MCR-6 alleles (which group into subclade II-B-1), while five predicted disulfide bonds were conserved i
留言 (0)