
記住我

Human pro-monocytic cell line (U937) was purchased from (Institute Pasture, Iran). Sodium alginate (medium viscosity, viscosity > 2000 cps), gelatin, calcium chloride, citrate sodium, and HEPES were prepared from Sigma-Aldrich. Roswell park memorial institute medium (RPMI 1640, Invitrogen), penicillin/streptomycin (pen/strep), fetal bovine serum (FBS), phosphate-buffered saline (PBS), and 0.25% Trypsin-EDTA solution were obtained from Gibco (France).
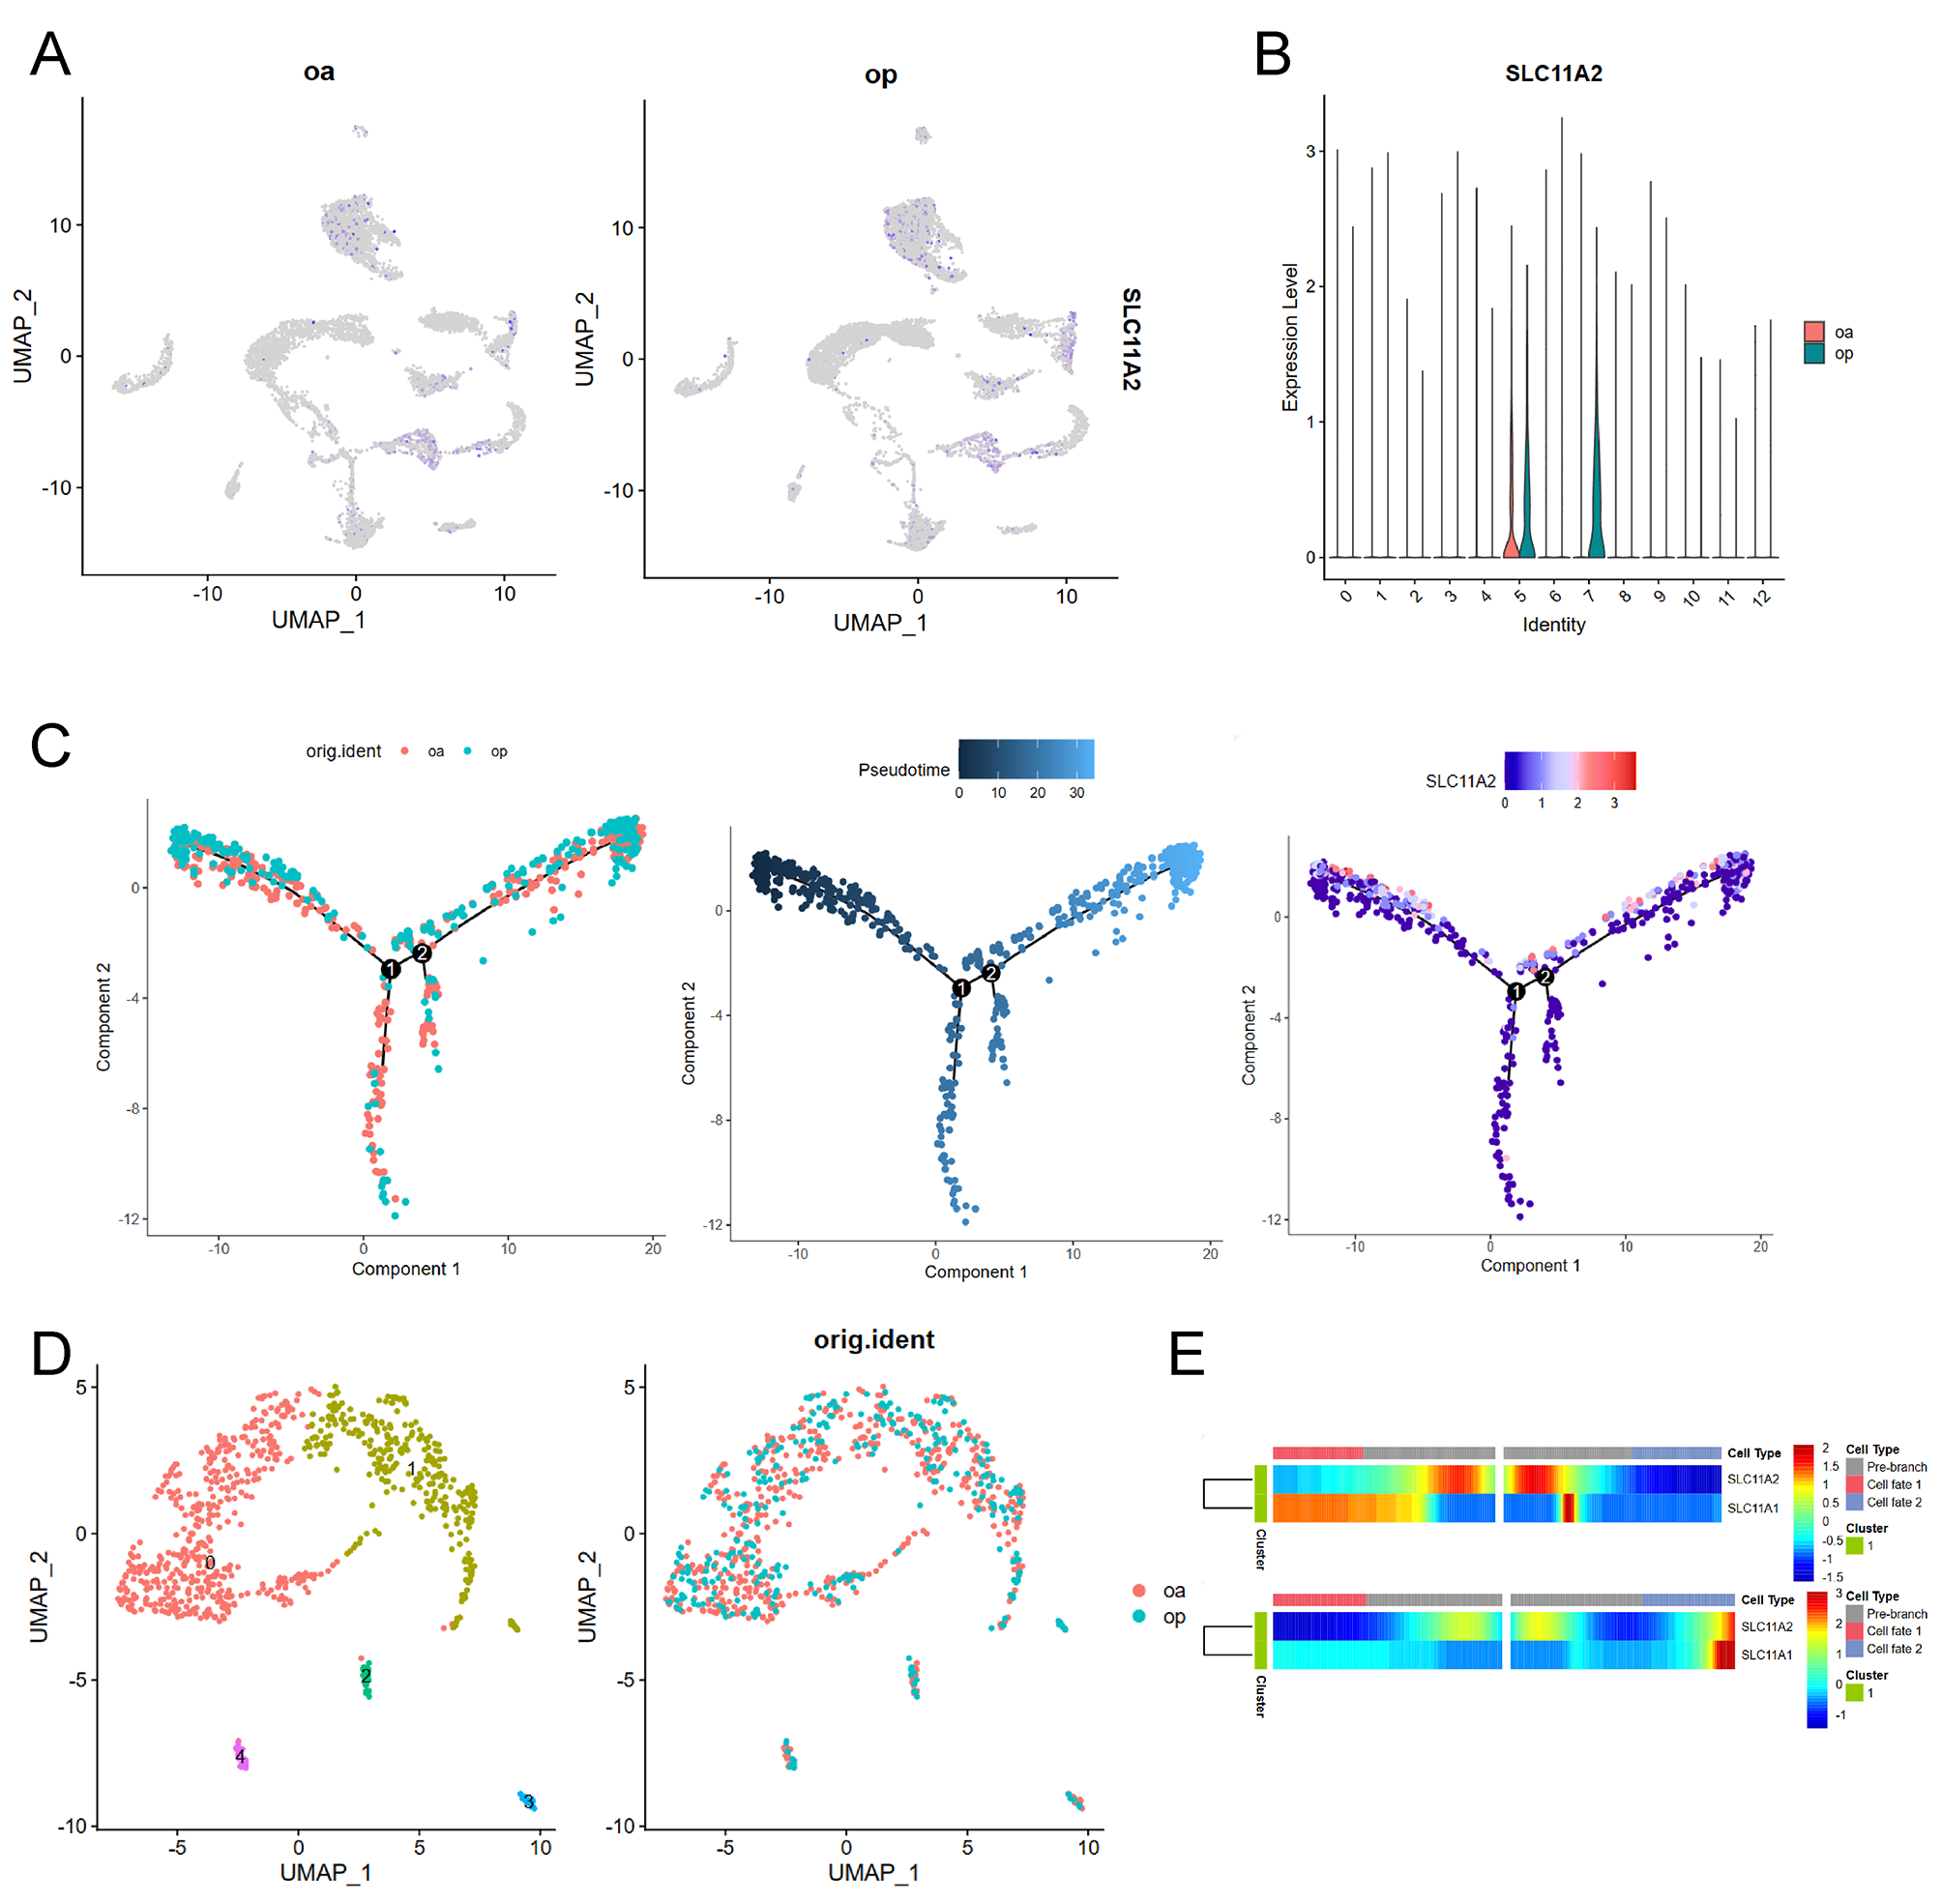
Bioreactor systemDynamic cultures were performed in a lab-scale stirred tank bioreactor. The cylindrical glass bioreactor with 100 ml working volume was equipped with a flat blade paddle impeller rotated by an external motor (Fig. 1). Temperature was under control at 37°C by using a water circulator having temperature controller (UC5000, Sahand Azar Co.). The culture medium was aerated by the surface aeration method. The inlet gas (5% CO2 and 95% air) entered the bioreactor at an aeration rate of 0.1 vvm after passing through a humidifier. The aspect ratio, the medium height (H) to the diameter of the bioreactor (D), was 0.46. The diameter of impeller (d) was 3.25 cm, resulting in the ratio of the diameter of the stirrer’s blade to the diameter of the vessel (d/D) of 0.5.
Fig. 1
Schematic of the stirred bioreactor developed
Cell cultureHuman pro-monocytic U937 cells were used as the hematopoietic cell model to inoculate static and dynamic culture systems. RPMI1640 supplemented with 10% (v/v) FBS and 100 U/ml antibiotics were used as a culture medium. Experiments were carried out at an initial seeding density of 105 cells/ml in both the bioreactor and T- flask for 7 days. The T-flasks were incubated at 37°C without agitation in a humidified 5% CO2 incubator. The 50% of the culture medium was replaced with fresh medium on days 1, 3, and 5, and the used medium was stored at -20°C for analysis. At determined culture days, the concentrations of glucose and lactate, and the pH levels of the medium were measured. The agitation rates of 50 and 100 rpm were studied for the suspended cells.
Shear stress considerationAgitation is essential for suspending cells and obtaining the homogeneity of nutrition and oxygen in stirred bioreactors. It has been stated that excessive agitation is a cause of death and dedifferentiation of cells [16]. To investigate the shear stress, the maximum threshold, which depends on the cell type, should be checked because of its harmful effects on the cells at higher values. Based on the previous studies, the maximum shear stress imposed on a cell/aggregate could be estimated by the following equation [16,17,18,19]:
$$_=5.33\rho \left(\varepsilon \vartheta \right)}^\frac$$
(1)
where ρ is the medium density (kg/m3), υ is the kinematic viscosity of the medium (m2/s) and ε is the power dissipated per unit mass (W/kg) which is calculated by Eq. 2:
$$\varepsilon =\frac_}.\rho }$$
(2)
where P is the power consumed (W) and VL is the bioreactor working volume (m3). The consumed power can be obtained from Eq. 3 [20]:
where N is the impeller speed (rps) and d is the impeller diameter (m). The value of the dimensionless power number (NP) which is a weak function of impeller geometry and Reynolds number (Re > 1000), can be calculated from the Nagata correlation [20].
The physical properties of water can be considered for the culture medium due to the similarity of fluid properties of the culture medium to those of water.
The damages caused by shear stress make it necessary to select the appropriate mixing rate. Additionally, shear stress depends on the geometric characteristics of the vessel as well as the impeller and the physical properties of the culture medium. Integrated shear factor (ISF) defined by Sinskey et al. [21] for mammalian cells was used to examine the damage caused by the shear between the impeller and the walls of the vessel (Eq. 4) [19, 22]:
where D and d are the diameters of the impeller and the vessel, respectively.
Metabolic ratesThe bioreactor was operated in the batch mode, so the following is the cell’s mass balance for the whole process [17]:
$$M.B. :In-Out+Conv. =ACC$$
(5)
$$M.B. \left(X\right):0-0+\left(\mu ._\right).V=d(_.V)/\mathrm$$
(6)
Assuming the logarithmic growth for the cell cultures and constant working volume (V) (Eq. (6)), the cell density (Cx) could be obtained from Eq. (7).
$$_=_\mathrm(\mu t)$$
(7)
Where Cx0 is the initial cell density (cells/ml) and μ is the specific cellular growth rate (h-1) which is obtained from the cellular growth profile, and t is time (h).
Considering glucose as the main source of energy production and lactate as the major product of cells, the mass balance for each batch of the medium could be written as Eq. (8) [17]:
$$M.B.\left(S\right):0-0+\left(_._\right).V=d(_.V)/dt$$
(8)
The specific metabolite rate (qmet) for glucose consumption and lactate production in the batch process was assumed to equal an average constant value measured for each cell type. Therefore, at constant volume, the mass balance could be written as [22, 23]:
Which, t is the period, and Cx is the average viable cell density during the same period (cells/ml).
Quantitative analysis of cell morphologyThe cell morphology was quantitatively evaluated by a parameter named cell roundness, Rc as described elsewhere [13, 24]. Briefly, the images of cells were captured by using a light microscope (Model: BX51; Olympus, Japan). The roundness of cells was evaluated with image analyzing software (Image J, version 1.52). In this study, the cells which have Rc > 0.8 were considered round. The frequency of round-shaped cells (fr) was determined as follows [25, 26]:
$$f\mathrm r=\frac\;\mathrm\;\mathrm\;\mathrm\;R_c>0.8}\;\mathrm\;\mathrm\;\mathrm\;\mathrm}$$
(10)
Flow cytometry analysis and cell countingThe total number of cells was determined by staining with trypan blue with a hemocytometer at days 0, 3, 5, and 7. The count of suspension cells was performed under an optical microscope (Olympus CKX31). To elucidate the possible effect of the dynamic culture method on the induction of apoptotic cell death, flow cytometry analysis was performed.
Measuring cell apoptosis using flow cytometry analysisTo test whether the exposure of U937 cells to shear force can promote apoptotic change, we performed a flow cytometric analysis of Annexin-V. To this end, cells were collected after 7 days and washed twice with PBS, and fixed with 4% paraformaldehyde solution. After that, cells were permeabilized using 0.05% Triton X100 and blocked with 1% BSA solution. Using FITC labeled anti-human Annexin-V antibody (Sigma-Aldrich), the cells were stained and washed twice with PBS. Cells were analyzed using the FACSCalibur system (BD Biosciences) and FlowJo software (version 7.6).
Statistical analysisExperiment results were presented as mean ± SD. Difference among samples were considered statistically significant by the confidence interval of 95% (p ˂ 0.05).
留言 (0)