
記住我


Three unprecedented outbreaks of human coronavirus (HCoV) at the beginning of the twenty-first century, indicated coronavirus as a major public health problem worldwide (1, 2). Less than a decade after the last human disease outbreak, caused by the Middle East Respiratory Syndrome Coronavirus (MERS-CoV) in 2012, a new outbreak of the severe acute respiratory syndrome, caused by coronavirus 2 (SARS-CoV-2), is spreading around the world (2). This pandemic is now defined as the 2019 novel coronavirus (COVID-19). The virus was primarily spread by COVID-19 infected individuals. Therefore, the main way to control the spread of COVID-19 disease is to isolate the source of infection. In this regard, the differential screening of COVID-19 highlights the necessity for readily available, accurate and fast screening testing methods (3).
The current gold standard for etiological diagnosis of COVID-19 infection is real-time reverse transcription polymerase chain reaction (RT-PCR) in respiratory specimens (4). However, some studies have shown some problems in using this method to detect COVID-19 infection, such as low sensitivity and specificity (5). These studies suggested that causes of these problems may include performing screening outside the diagnostic window, virus mutation and recombination, using insufficiently validated tests, and instrument failure (5). Therefore, more and more studies are taking cross-disciplinary methods to better understand screening and diagnosis of COVID-19 infection in order to improve diagnostic accuracy, for example, by combining clinical evidence, chest computed tomography (CT), and interpreting RT-PCR results on the basis of epidemiological, clinical, and CT evidence (6). Chest CT could accurately and rapidly evaluate the extent of lung lesions caused by COVID-19, which plays an important role in early detection and is valuable for the diagnosis of COVID-19 pneumonia (7, 8). At the same time, CT scans whose sensitivity can reach 67–100% can compensate for the problem of moderate sensitivity (53–88%) of RT-PCR and have extra value in the diagnosis of COVID-19 (9).
However, none of the current meta-analyses have systematically summarized these strategies (10–12). Although the association between CT and SARS-CoV-2 infection has been discussed in some recently published meta-analyses, the studies included in these studies are relatively limited, the number of studies included ranged from 9 to 15 (13–15).
This study aims to 1) systematically summarize the sensitivity and specificity of the major screening methods for COVID-19, 2) analyze the possible causes of false negatives or false positives as regards the efficacy of the screening methods, and 3) explore how to further improve the sensitivity and specificity of the screening methods. The study will also discuss epidemiological methods that could be used to further help identify more patients with latent infections by investigating their exposure history. It was speculated that, in a public health emergency, a combination of multidisciplinary approaches may be of some help in the control and prevention of COVID-19.
2. Methods 2.1. Search strategy and selection criteriaStandard procedures for meta-analyses according to the Cochrane Handbook; and the Preferred Reporting Items for Systematic Reviews and Meta-Analyses (PRISMA) guidelines were used to conduct this study (16). Thus, using these procedures, two independent reviewers (XP and AK) systematically searched in the electronic databases, Web of Science, Cochrane Library, Embase, PubMed, CNKI, and Wanfang, for relevant studies published on 1 September 2022, or earlier. Then, from the search outcomes, they selected eligible studies according to the purpose of this study, using predefined selection criteria. Noteworthy, China has accumulated valuable experience in screening and diagnosing COVID-19, but very much literature related to China on this subject has been published in Chinese language. Therefore, to avoid publication bias, gray literature, and studies published in Chinese were included in this study. That is, studies published in English or Chinese were included in this study. In order to retrieve as much literature as possible, the search strategy, among other important terms, included the professional name, COVID-19, and its variant names. Based on both historical and current COVID-19 names, Boolean operators, truncation, and wildcards were used appropriately to include all other variant names for COVID-19. The complete search strategy is shown in the Appendix 1. Experienced librarians designed the search strategy and adjusted it to meet the requirements of each of the databases specified above.
2.2. Study selectionSelection of studies for this meta-analysis was based on the following inclusion criteria: (1) diagnostic and screening studies; (2) studies reported methods for diagnosing COVID-19; and (3) original studies. Studies were excluded based on the following criteria: (1) conference papers, case reports, letters, or reviews; and (2) studies not on humans. The details about the excluded studies are shown in the Appendix 1.
2.3. Data extractionTwo reviewers (YC and AK) translated the Chinese articles into English, and entered all the data and removed duplicates in EndNote (version x9.1), Then used custom data extraction tool, EpiData (version 3.0) grids, and extracted (17, 18). The key characteristics of interest were extracted from each eligible study in the EpiData (version 3.0) grids, including first author, year of publication, study area, number of subjects, sensitivity, and specificity. Any differences between the two reviewers were resolved by consensus involving the third reviewer (AL).
2.4. Quality evaluationThe Quality Assessment of Diagnostic Accuracy Studies-2 checklist (QUADAS-2) was used to assess the quality of the eligible studies. The selected studies were grouped based on their score into high (6–7 points), moderate (4–5 points), and low (0–3 points) quality categories (19, 20).
2.5. Patient and public involvementThere were no patients involved in our study.
2.6. Statistical analysisIn this study, meta-analyses were carried out using MetaDiSc (version 1.4) and R software (version R i386 3.4.2). For the diagnostic meta-analysis, the number of subjects with a true-positive (TP), false-positive (FP), true-negative (TN), and false-negative (FN) values for each study unit was extracted to calculate the pooled sensitivity [TP/(TP + FN)], specificity [TN/(TN + FP)], positive likelihood ratio (PLR) [(sensitivity/(1–sensitivity)], negative likelihood ratio (NLR), [(1–specificity)/specificity)], diagnostic odds ratio (dOR) [PLR/NLR], and their corresponding 95% confidence intervals (CIs) using a bivariate random-effect meta-analysis model (21). The summary receiver operator characteristic (SROC) curve was plotted, and the area under the SROC Area Under Curve (AUC) was calculated to evaluate the pooled diagnostic performance of CT in confirmed cases, CT in suspected cases for predicting COVID-19 diagnosis (22, 23). Heterogeneity between enrolled studies was quantified by the I2 statistic and assessed by the Cochran's Q-statistic. I2 = 0% indicated no heterogeneity, and I2 = 100% indicated maximal heterogeneity (24, 25). The assumption of heterogeneity was deemed valid for I2 > 50% and P < 0.10. Finally, in all analyses, the level of significance for the effect size estimation was set at 5%, and all tests were two-sided.
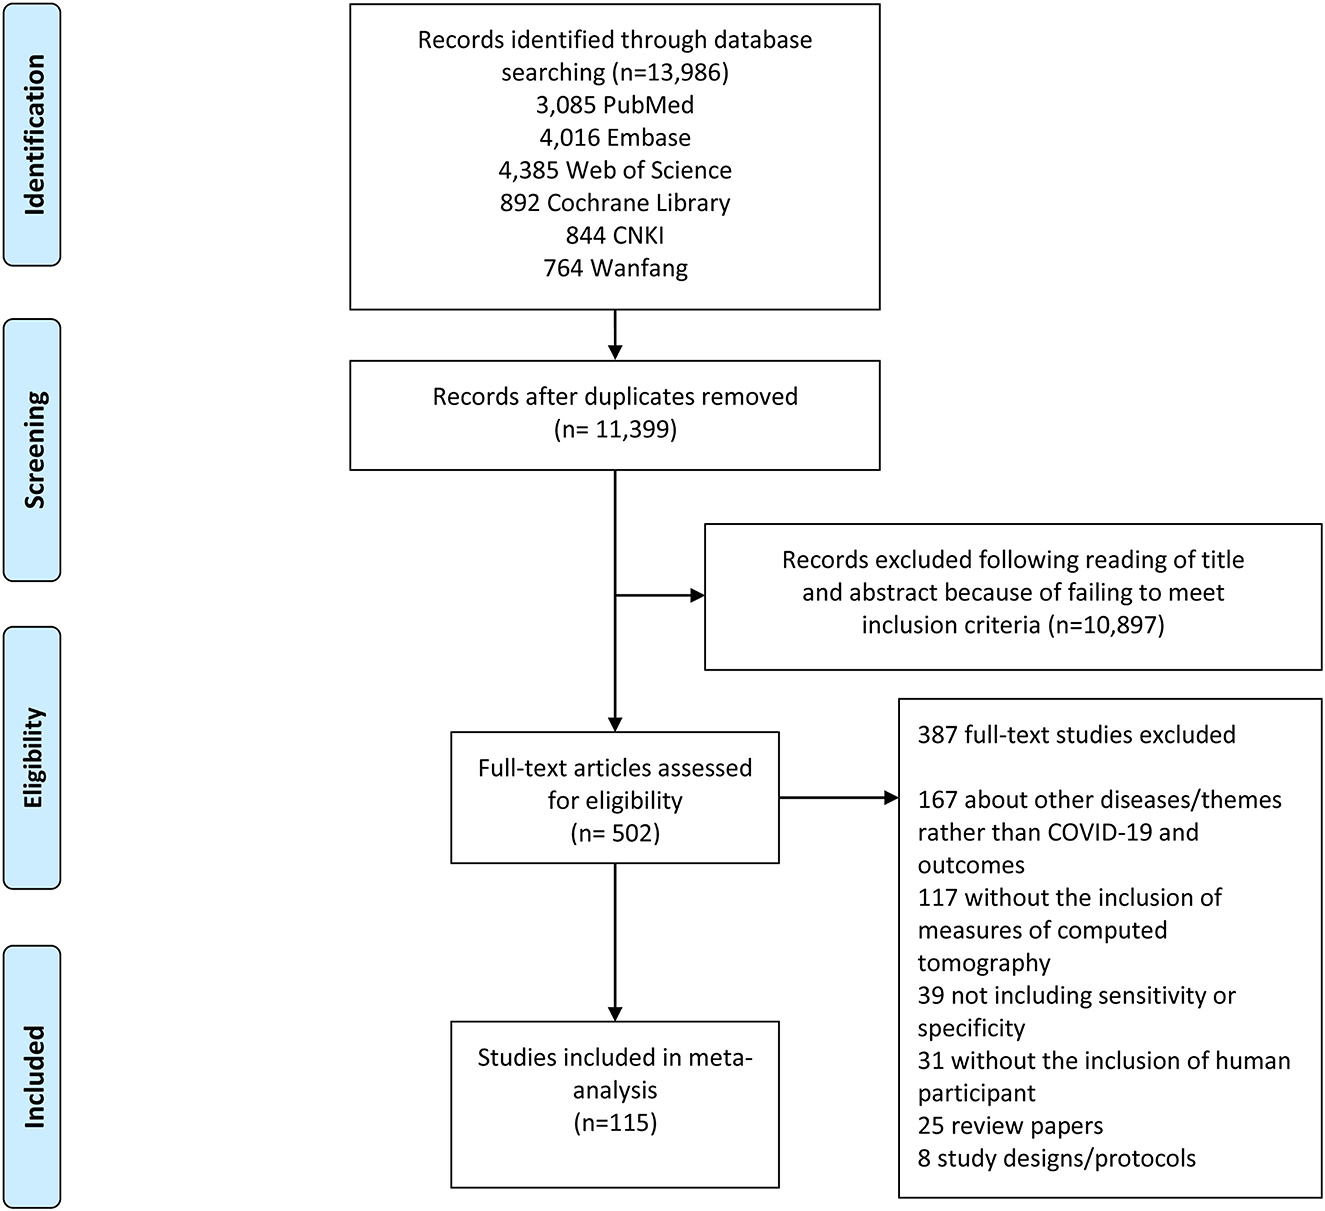
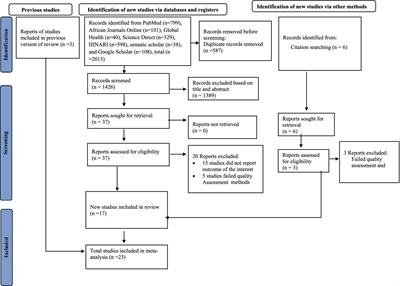
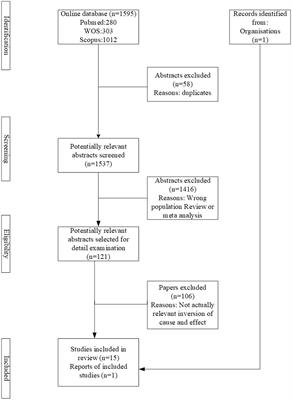
3. Results 3.1. Study selectionThe search strategy retrieved a total of 13,986 studies, of which 3,085 were from PubMed, 4,016 were from Embase, 4,385 were from Web of Science, 892 were from Cochrane Library, 844 were from CNKI, and 764 were from Wanfang. Following a full review of 502 of these studies, 115 met the inclusion criteria for this meta-analysis. The PRISMA flowchart in Figure 1 shows the number of studies and the selection process.
Figure 1. Study selection flow chart. A Preferred Reporting Items for Systematic Reviews and Meta-Analyses (PRISMA) flow chart demonstrating the selection process of articles included in the analysis as well as in the qualitative summary.
3.2. Characteristics of eligible studiesCharacteristics of the eligible studies are shown in Appendix 2. Further, focusing on test method, 115 studies reported on CT. The QUADAS-2 score of these studies varied between 1 and 7, with 42 studies of high quality, 58 of moderate quality, and 15 studies of low quality.
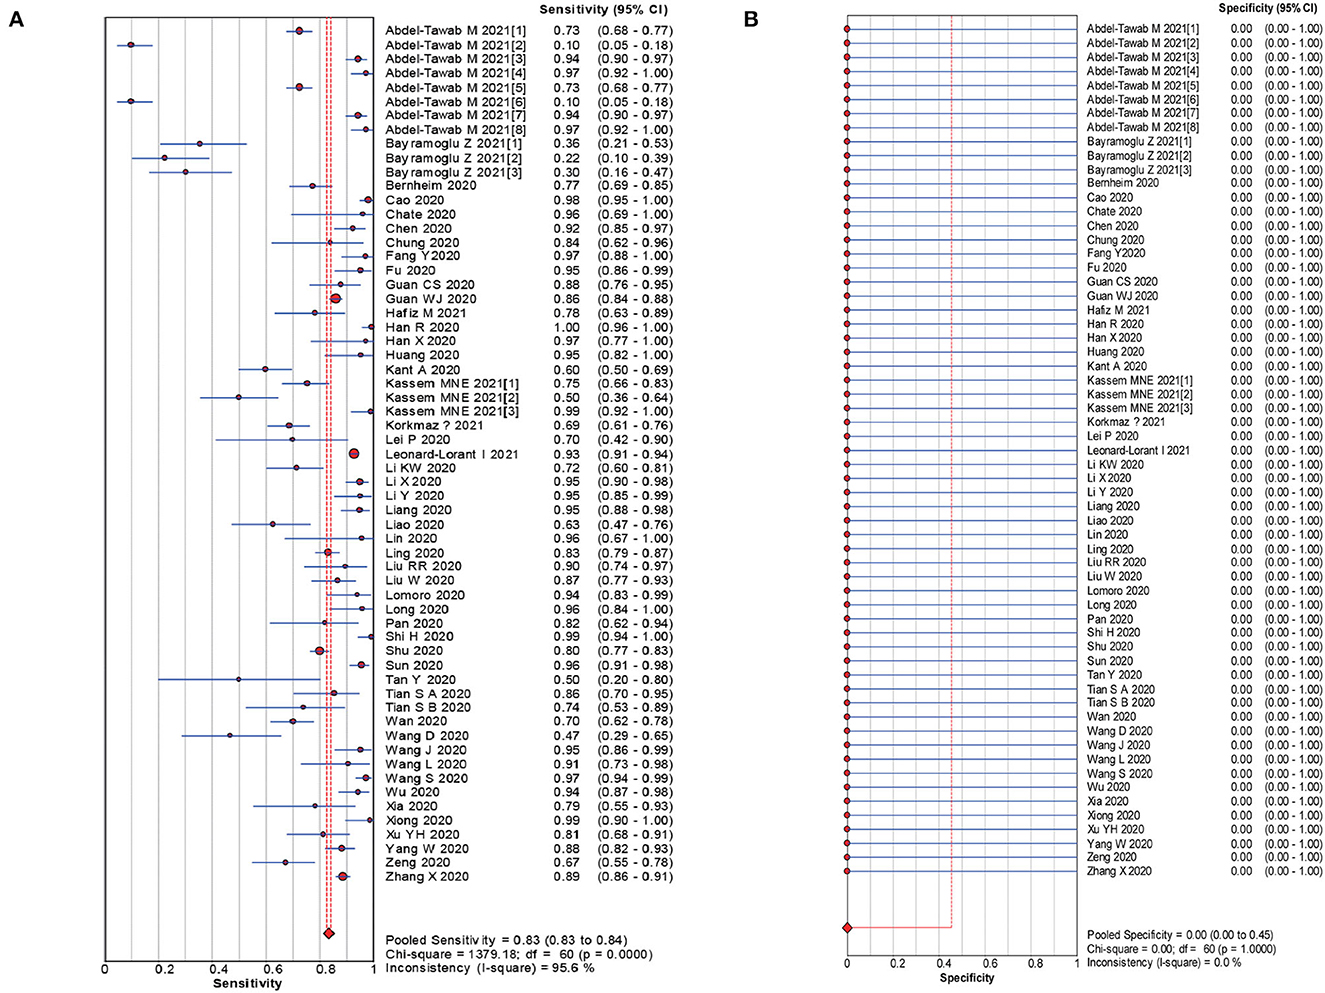
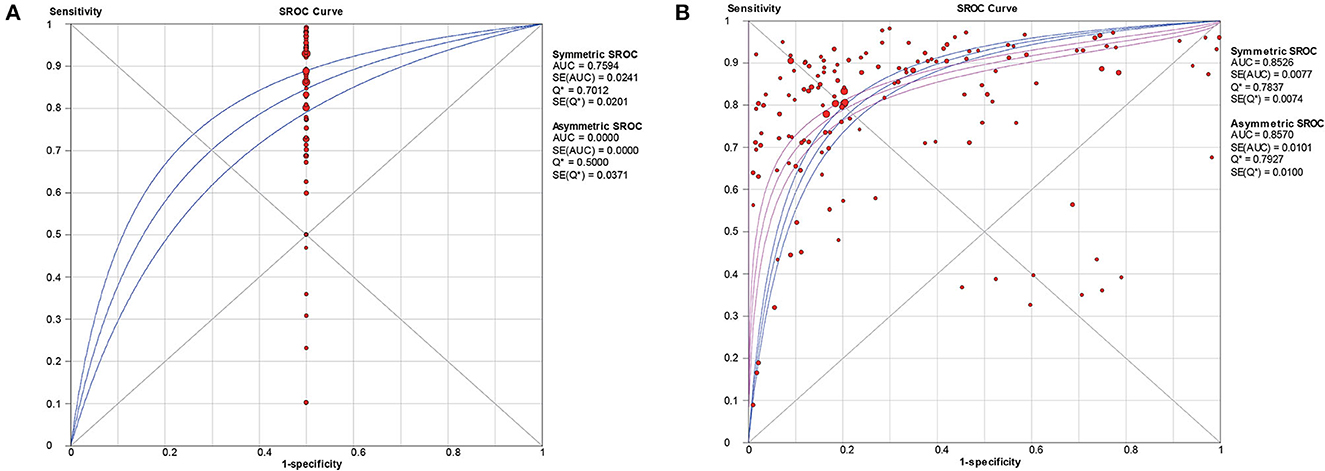
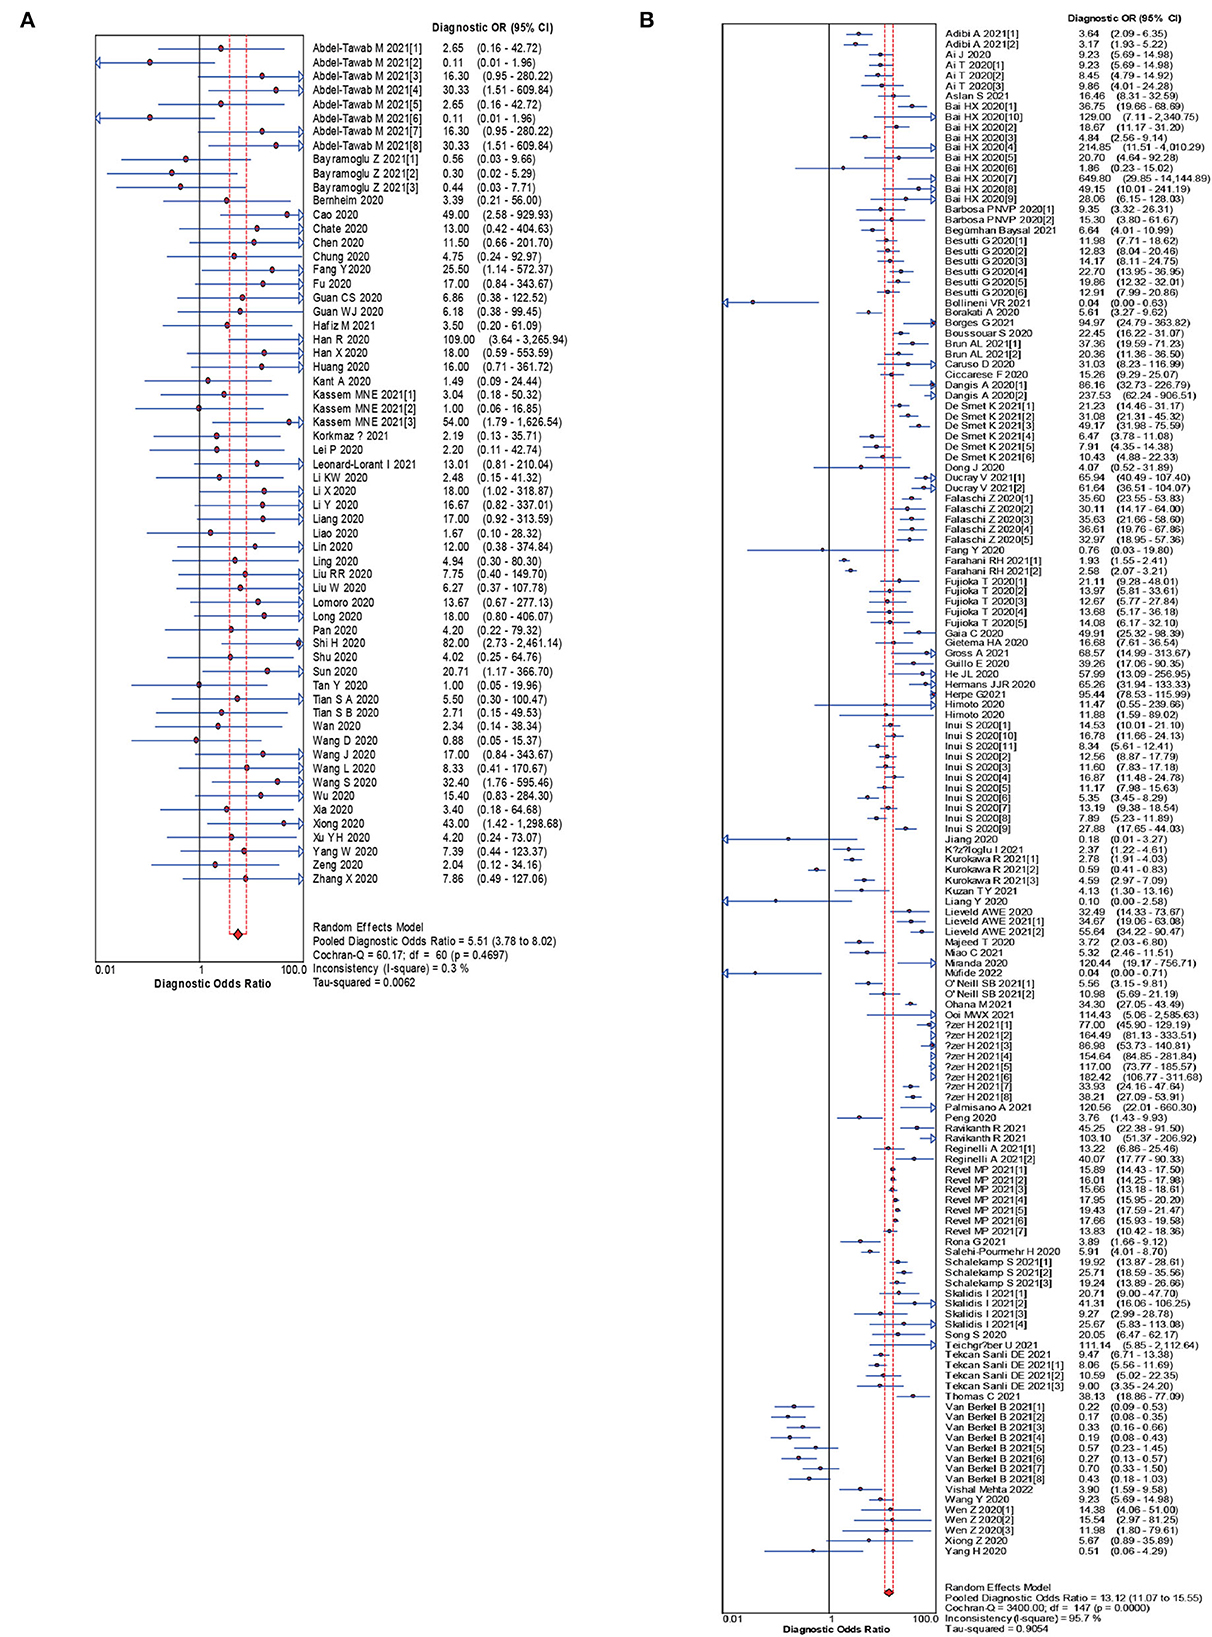
3.3. Main outcomesThe pooled estimates for sensitivity and specificity of CT in confirmed cases to predicting COVID-19 diagnosis were 0.83 (95% CI: 0.83–0.84) and 0.00 (95% CI: 0.00–0.45), respectively (Figure 2), corresponding to a PLR of 1.50 (95% CI: 1.25–1.79) (Appendix 3) and an NLR of 0.28 (95% CI: 0.22–0.37) (Appendix 4). The overall AUC was 0.76 (Figure 4) and the dOR was 5.51 (95% CI: 3.78–8.02) (Figure 5).
Figure 2. Forest plot of sensitivities (A) and specificities (B) of CT in confirmed cases for predicting COVID-19 diagnosis.
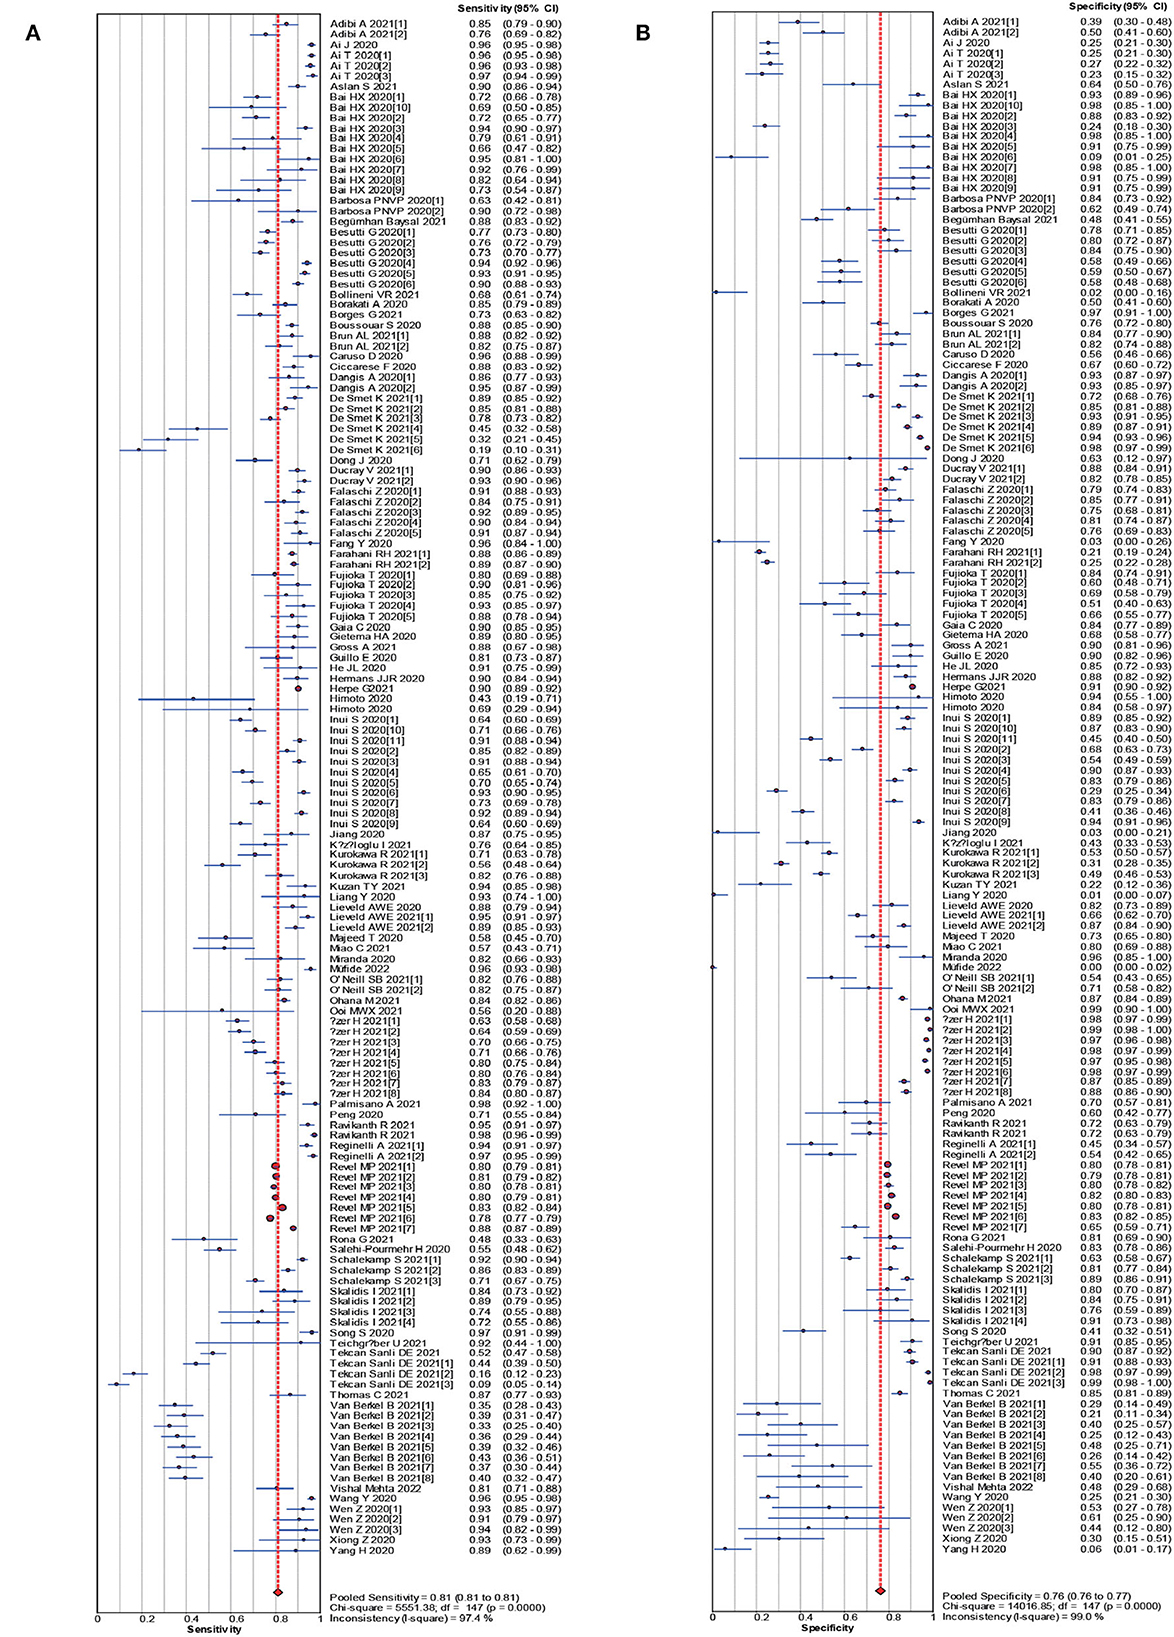
The pooled estimates for sensitivity and specificity of CT in suspected cases to predicting COVID-19 diagnosis were 0.81 (95% CI: 0.81–0.81) and 0.76 (95% CI: 0.76–0.77), respectively (Figure 3), corresponding to a PLR of 3.28 (95% CI: 2.80–3.84) (Appendix 5) and an NLR of 0.27(95% CI: 0.24–0.30) (Appendix 6). The overall AUC was 0.85 (Figure 4) and the dOR was 13.12 (95% CI: 11.07–15.55) (Figure 5).
Figure 3. Forest plot of sensitivities (A) and specificities (B) of CT in suspected cases for predicting COVID-19 diagnosis.
Figure 4. SROC curve with pooled estimates of sensitivity, specificity, and the AUC for all included studies of CT in confirmed cases (A), CT in suspected cases (B) for predicting COVID-19 diagnosis. AUC, area under the SROC curve; SROC, summary receiver operator characteristic.
Figure 5. Forest plot of the pooled dOR of CT in confirmed cases (A), CT in suspected cases (B) for predicting COVID-19 diagnosis.
4. DiscussionThere are several meta-analyses that discussed the relationship between CT and SARS-CoV-2 infection. But the number of studies included in previous meta-analyses was relatively limited. One hundred and fifteen studies were included with 51,500 participants in our meta-analysis. This is the maximum sample size, comprehensive, and updated review of the latest advances in the CT auxiliary screening of COVID-19 (10, 12, 26). In view of the relatively strong infectivity of COVID-19, early detection, reporting, isolation and treatment are of great significance for the prevention and control of the spread of the infection. Following their encouraging accuracy as shown in the reviewed studies, RT-PCR nucleic acid detection is recommended as the main screening criteria (27).
Current studies have shown that nucleic acid detection technology has the characteristics of early diagnosis, high sensitivity and specificity (28). However, in practice, this technology often yields false negatives. Therefore, the potential methods to reduce false negative results from the aspects of sample collection time, sample collection site and nucleic acid extraction process are worth discussing (10). First, mutations in the primers design area of the viral RNA may result in false negative test results. Thus, based on the preceding possibility, we recommend the following: collecting nasopharyngeal swabs within 3–7 days of onset (29), testing sputum samples in patients with negative RT-PCR results from pharyngeal swabs, and suspecting or confirming a high probability of infection (30).
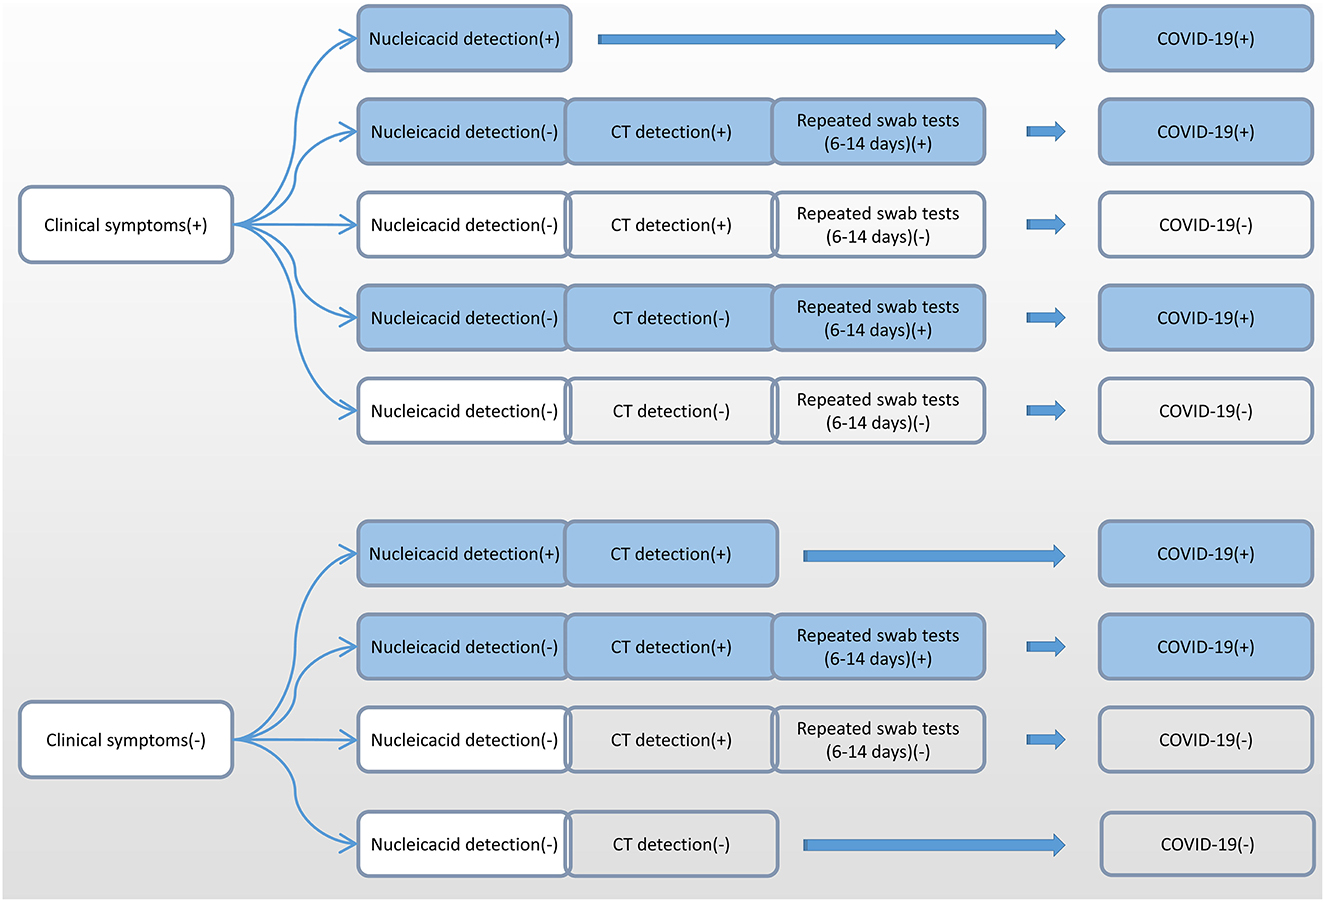
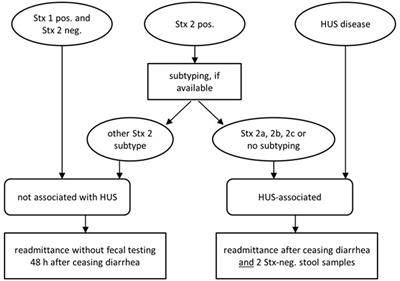
Due to the differences in the incubation period of individuals, we recommend multiple nucleic acid tests for clinically symptomatic patients in order to improve the detection rate (31). Alveolar lavage fluid sampling is not recommended because of the risk of trauma and cross-infection. According to the accurate selection of appropriate detection methods at different infection periods, we recommend nucleic acid detection and CT detection immediately after showing clinical symptoms (Figure 6). Six to fourteen days after the onset of clinical symptoms, repeated swab tests may be helpful for individuals with positive CT screening but negative RT-PCR screening.
Figure 6. Flow chart of the selection of different detection methods for SARS-CoV-2 at different infection periods. SARS-CoV-2, severe acute respiratory syndrome coronavirus 2.
Furthermore, the results suggested that CT scan can be used as a reliable method for screening COVID-19, especially in patients with a history of COVID-19 exposure, to facilitate early diagnosis and isolation of cases (32). The CT findings of COVID-19 and non-COVID-19 patients were significantly different with high specificity (33). Most of the patients with COVID-19 had bilateral pneumonia, and the CT findings were multiple spots and ground hyaline shadows (7). About 10 days after the initial onset of symptoms, chest CT showed the most severe lung abnormalities, and about 14 days after the initial onset of symptoms, chest CT began to improve (34). However, there are contradictions in the sensitivity of CT scan. Some studies have shown that chest CT has a high sensitivity to the screening of COVID-19 (32), while other studies have shown that chest CT has a moderate sensitivity to the screening of COVID-19 (35).
This study also has some limitations. First, there were heterogeneities in our meta-analyses, which might be originated from basic characteristics of our included studies, such as race, sex, age, smoking, and obesity. Due to the included studies were from different countries and above confounders could not be adjusted for, so our study was highly heterogeneous. Additionally, many patients may have no symptoms in the early stages of COVID-19 infection, these patients may lack CT data and the existing data may be scattered (36, 37). Finally, in rural areas of some developing countries, they are expensive because they are based on CT expensive equipment, hence their popularity is not high.
5. ConclusionsMultidisciplinary cooperation can improve the diagnostic efficiency of COVID-19. We recommend the use of RT-PCR nucleic acid as the main screening criteria. Through standard sampling, sample processing, combined CT and accurate selection of appropriate detection methods in different infection stages of laboratory methods, sensitivity of detection can be improved.
Data availability statementThe original contributions presented in the study are included in the article/Supplementary material, further inquiries can be directed to the corresponding author.
Author contributionsXP, PJ, and AL contributed to the study design, while YC and AK contributed to the data collection. Interpretation of results was performed by AL and YC, whereas XP, AL, and SW drafted the manuscript and edited the language. All authors participated in the critical revisions and approved the final version of the manuscript.
FundingThis work was supported by the National Natural Science Foundation of China (42271433), Jiangxi Provincial 03 Special Foundation and 5G Program (20224ABC03A05), Wuhan University Specific Fund for Major School-level Internationalization Initiatives (WHU-GJZDZX-PT07), and the International Institute of Spatial Lifecourse Health (ISLE).
AcknowledgmentsWe are also grateful to Central South University Library for his assistance during the literature search. Furthermore, we sincerely appreciate the hard work of the distinguished editors and reviewers, which improved the clarity of this article.
Conflict of interestThe authors declare that the research was conducted in the absence of any commercial or financial relationships that could be construed as a potential conflict of interest.
Publisher's noteAll claims expressed in this article are solely those of the authors and do not necessarily represent those of their affiliated organizations, or those of the publisher, the editors and the reviewers. Any product that may be evaluated in this article, or claim that may be made by its manufacturer, is not guaranteed or endorsed by the publisher.
Supplementary materialThe Supplementary Material for this article can be found online at: https://www.frontiersin.org/articles/10.3389/fpubh.2023.974542/full#supplementary-material
References2. Jia P, Dai S, Wu T, Yang S. New approaches to anticipate the risk of reverse zoonosis. Trends Ecol Evol. (2021) 36: 580–90.
PubMed Abstract | Google Scholar
3. Yang S, Pan X, Yuan D, Zeng P, Jia P. Cross-disciplinary approaches to assist with nucleic acid testing for SARS-CoV-2. Appl Microbiol Biotechnol. (2021) 105:6291–9. doi: 10.1007/s00253-021-11498-2
PubMed Abstract | CrossRef Full Text | Google Scholar
4. Tang A, Tong Z-D, Wang H-L, Dai Y-X, Li K-F, Liu J-N, et al. Detection of novel coronavirus by RT-PCR in stool specimen from asymptomatic child, China. Emerg Infect Dis. (2020) 26:1337–9. doi: 10.3201/eid2606.20.0301
PubMed Abstract | CrossRef Full Text | Google Scholar
5. Liu R, Han H, Liu F, Lv Z, Wu K, Liu Y, et al. Positive rate of RT-PCR detection of SARS-CoV-2 infection in 4880 cases from one hospital in Wuhan, China, from Jan to Feb 2020. Clin Chim Acta. (2020) 505:172–5. doi: 10.1016/j.cca.2020.03.009
PubMed Abstract | CrossRef Full Text | Google Scholar
8. Xu YH, Dong JH, An WM, Lv XY, Yin XP, Zhang JZ, et al. Clinical and computed tomographic imaging features of novel coronavirus pneumonia caused by SARS-CoV-2. J Infect. (2020) 80:394–400. doi: 10.1016/j.jinf.2020.02.017
PubMed Abstract | CrossRef Full Text | Google Scholar
9. Kovács A, Palásti P, Veréb D, Bozsik B, Palkó A, Kincses ZT. The sensitivity and specificity of chest CT in the diagnosis of COVID-19. Eur Radiol. (2021) 31:2819–24. doi: 10.1007/s00330-020-07347-x
PubMed Abstract | CrossRef Full Text | Google Scholar
11. Salehi S, Abedi A, Balakrishnan S, Gholamrezanezhad A. Coronavirus disease 2019 (COVID-19): a systematic review of imaging findings in 919 patients. AJR Am J Roentgenol. (2020) 215:87–93. doi: 10.2214/AJR.20.23034
PubMed Abstract | CrossRef Full Text | Google Scholar
12. Rodriguez-Morales J, Cardona-Ospina JA, Gutierrez-Ocampo E, Villamizar-Pena R, Holguin-Rivera Y, Escalera-Antezana JP, et al. Clinical, laboratory and imaging features of COVID-19: a systematic review and meta-analysis. Travel Med Infect Dis. (2020) 34:101623. doi: 10.1016/j.tmaid.2020.101623
PubMed Abstract | CrossRef Full Text | Google Scholar
13. Zhang JJY, Lee KS, Ong CW, Chan MY, Ang LW, Leo YS, et al. Diagnostic performance of COVID-19 serological assays during early infection: a systematic review and meta-analysis of 11 516 samples. Influenza Other Respir Viruses. (2021) 15:529–38. doi: 10.1111/irv.12841
PubMed Abstract | CrossRef Full Text | Google Scholar
14. Pang C, Hou Q, Yang Z, Ren L. Chest computed tomography as a primary tool in COVID-19 detection: an update meta-analysis. Clin Transl Imaging. (2021) 9:341–51. doi: 10.1007/s40336-021-00434-z
PubMed Abstract | CrossRef Full Text | Google Scholar
15. Santura I, Kawalec P, Furman M, Bochenek T. Chest computed tomography versus RT-PCR in early diagnostics of COVID-19—a systematic review with meta-analysis. Pol J Radiol. (2021) 86:e518–31. doi: 10.5114/pjr.2021.109074
PubMed Abstract | CrossRef Full Text | Google Scholar
16. Moher D, Liberati A, Tetzlaff J, Altman DG. Preferred reporting items for systematic reviews and meta-analyses: the PRISMA statement. BMJ. (2009) 339:b2535. doi: 10.1136/bmj.b2535
PubMed Abstract | CrossRef Full Text | Google Scholar
17. Pan X, Chiwanda Kaminga A, Liu A, Wen SW, Chen J, Luo J. Chemokines in non-alcoholic fatty liver disease: a systematic review and network meta-analysis. Front Immunol. (2020) 11:1802. doi: 10.3389/fimmu.2020.01802
PubMed Abstract | CrossRef Full Text | Google Scholar
18. Pan X, Kaminga AC, Chen J, Luo M, Luo J. Fetuin-A, and fetuin-B in non-alcoholic fatty liver disease: a meta-analysis and meta-regression. Int J Environ Res Public Health. (2020) 17:2735. doi: 10.3390/ijerph17082735
PubMed Abstract | CrossRef Full Text | Google Scholar
19. Pan X, Kaminga AC, Wen SW, Wu X, Acheampong K, Liu A. Dopamine and dopamine receptors in Alzheimer's disease: a systematic review and network meta-analysis. Front Aging Neurosci. (2019) 11:175. doi: 10.3389/fnagi.2019.00175
PubMed Abstract | CrossRef Full Text | Google Scholar
20. Pan X, Wu X, Kaminga AC, Wen SW, Liu A. Dehydroepiandrosterone and dehydroepiandrosterone sulfate in Alzheimer's disease: a systematic review and meta-analysis. Front Aging Neurosci. (2019) 11:61. doi: 10.3389/fnagi.2019.00061
PubMed Abstract | CrossRef Full Text | Google Scholar
21. Zamora J, Abraira V, Muriel A, Khan K, Coomarasamy A. Meta-DiSc: a software for meta-analysis of test accuracy data. BMC Med Res Methodol. (2006) 6:31. doi: 10.1186/1471-2288-6-31
PubMed Abstract | CrossRef Full Text | Google Scholar
23. Pan X, Kaminga AC, Wen SW, Liu A. Catecholamines in post-traumatic stress disorder: a systematic review and meta-analysis. Front Mol Neurosci. (2018) 11:450. doi: 10.3389/fnmol.2018.00450
PubMed Abstract | CrossRef Full Text | Google Scholar
25. Pan X, Wang Z, Wu X, Wen SW, Liu A. Salivary cortisol in post-traumatic stress disorder: a systematic review and meta-analysis. BMC Psychiatry. (2018) 18:324. doi: 10.1186/s12888-018-1910-9
PubMed Abstract | CrossRef Full Text | Google Scholar
26. Adhikari SP, Meng S, Wu Y-J, Mao Y-P, Ye R-X, Wang Q-Z, et al. Epidemiology, causes, clinical manifestation and diagnosis, prevention and control of coronavirus disease (COVID-19) during the early outbreak period: a scoping review. Infect Dis Poverty. (2020) 9:29. doi: 10.1186/s40249-020-00646-x
PubMed Abstract | CrossRef Full Text | Google Scholar
27. Liang Y, Si M, Liu S, Wu SM. Diagnostic value of novel coronavirus antibody in the diagnosis of new coronavirus pneumonia. J Wuhan Univer. (2020) 33:21–24.
28. Wölfel R, Corman VM, Guggemos W, Seilmaier M, Zange S, Müller MA, et al. Virological assessment of hospitalized patients with COVID-2019. Nature. (2020) 581:465–9. doi: 10.1101/2020.03.05.20030502
PubMed Abstract | CrossRef Full Text | Google Scholar
29. Liu YB, Liu T, Cui Y, Wang B, Luo FM. Comparative study of novel coronavirus nucleic acid screening methods using two methods of nasal swabs and throat swabs. China J Respir Crit Care. (2020) 23:1–3.
30. Chen W, Chun YZ, Zhu Y, Yan HZ, You LB, Wu BS, et al. Chinese new novel coronavirus infection: comparison of virus nucleic acids in throat swabs and sputum specimens. Chin J Zoo. (2020) 20:211–7.
32. Ai T, Yang Z, Hou H, Zhan C, Chen C, Lv W, et al. Correlation of chest CT and RT-PCR testing in Coronavirus disease 2019 (COVID-19) in China: a report of 1014 cases. Radiology. (2020) 22:11–9. doi: 10.1148/radiol.2020200642
PubMed Abstract | CrossRef Full Text | Google Scholar
33. Cheng Z, Lu Y, Cao Q, Qin L, Pan Z, Yan F, et al. Clinical features and chest CT manifestations of Coronavirus disease 2019 (COVID-19) in a single-center study in Shanghai, China. AJR Am J Roentgenol. (2020) 215:121–6. doi: 10.2214/AJR.20.22959
PubMed Abstract | CrossRef Full Text | Google Scholar
34. Feng P, Tianhe Y, Peng S, Shan G, Bo L, Lingli L, et al. Time course of lung changes on chest CT during recovery from 2019 novel coronavirus (COVID-19) pneumonia. J Radiol. (2020) 295:715–21. doi: 10.1148/radiol.2020200370
PubMed Abstract | CrossRef Full Text | Google Scholar
35. Bai HX, Hsieh B, Xiong Z, Halsey K, Choi JW, Tran TML, et al. Performance of radiologists in differentiating COVID-19 from viral pneumonia on chest CT. Radiology. (2020) 296:E46–54. doi: 10.1148/radiol.2020200823
PubMed Abstract | CrossRef Full Text | Google Scholar
37. Jia P, Yang S. Early warning of epidemics: towards a national intelligent syndromic surveillance system (NISSS) in China. BMJ Glob Health. (2020) 5:e002925. doi: 10.1136/bmjgh-2020-002925
留言 (0)