
記住我
Managing acute pain for hospitalized patients has become increasingly challenging as health care systems have attempted to shift from relying on opioid medication toward providing evidence-based nonpharmacologic pain treatment while maintaining high-quality patient-centered care.11,56 In 2018, the Joint Commission established a requirement for hospitals to promote and provide nonpharmacologic pain treatments, such as music therapy (MT).53–56 With this requirement, there is an opportunity to advance clinical knowledge about the effectiveness of nonpharmacologic interventions for pain and symptom management because these approaches are increasingly used in clinical practice within large health systems.43
Adults receiving inpatient hospital care often experience psychological distress, which can complicate medical treatment.51 Recent studies have found associations between psychological symptoms and diagnoses (eg, depression and anxiety) and increased length of stay in various clinical populations.1,8,19 A review of the 2016 National Inpatient Sample found that hospital admissions for patients with mental and/or substance use disorders had a higher cost ($14,300 vs $11,500) and length of stay (5.4 vs 4.2 days) than hospital admissions for patients without these conditions.40
Several clinical effectiveness studies have evaluated the impact of inpatient integrative therapies for pain management, with most studies taking place in academic medical settings. For example, a study of acupuncture provided during 1867 hospital admissions for adults undergoing total hip or knee arthroplasty found an average short-term pain reduction of 1.91 units on the 0 to 10 numeric rating scale (NRS).9 Hospitalized adults receiving various integrative therapies (eg, acupuncture, massage therapy, MT, and/or holistic nursing) provided during 2730 hospital admissions reported an average pain reduction of 2.05 units, which was associated with a cost savings of $898 per admission.11 A subsequent study limited to first integrative therapy sessions provided during 3635 admissions found clinically meaningful reductions (ie, at least 1.3 units7) in acute pain (1.97 units) among hospitalized adults after adjusting for severity of illness, clinical population, sex, treatment, and pain medication status. Pain medications (ie, narcotic, nonnarcotic, both, or none) active at the time of the intervention were not significantly associated with pre-to-post session pain changes, and patients receiving maternity care reported the largest reductions in pain (2.34 units).12 Outside of the academic medical setting, a study of nurse-delivered aromatherapy provided to 10,262 hospital admissions across 10 hospitals found that patients receiving a variety of essential-oil aromatherapy treatments reported significant reductions in pain (3.31 units in response to sweet marjoram), anxiety (2.73 units in response to lavender and sweet marjoram), and nausea (2.02 units in response to ginger).26
Music therapists have provided services within medical settings in the United States since the mid-20th century.52 Several randomized controlled trials (RCTs) support the efficacy of MT for improving symptom management in patients with cancer6; patients with sickle cell disease47,48; patients receiving palliative care18; patients undergoing orthopedic,15,30 breast,42 or spinal surgery39; and patients receiving cardiovascular care.17,36,50 Recent systematic reviews support the use of music interventions for addressing pain,27 anxiety,34 and stress.10 However, some systematic reviews do not distinguish between studies of MT (interventions provided by board-certified music therapists) and music medicine (listening to prerecorded music offered by medical staff).
Despite convincing evidence from RCTs and the increased delivery of MT in clinical care, few clinical effectiveness studies have evaluated the impact of MT within health systems. To date, most clinical effectiveness studies of MT have been limited to adult inpatient oncology, with studies reporting clinically significant improvements in pain, anxiety, fatigue, and depression.3,4,16,29,31,32 Given the paucity of clinical effectiveness research evaluating MT within general medical/surgical areas and the overall lack of research investigating any integrative therapies in community medical settings, studies are needed to evaluate the impact of MT on patient-reported outcomes (PROs) within community medical settings and examine whether demographic and clinical characteristics are associated with changes in PROs.
University Hospitals Connor Whole Health is currently conducting a large research project entitled Effectiveness of Medical Music therapy Practice: Integrative Research using the Electronic health record (EMMPIRE). The first aim of EMMPIRE is a retrospective study examining the effectiveness of MT throughout 10 medical centers (2 academic and 8 community medical centers) in the University Hospitals (UH) Health System. Thus, the purpose of this retrospective study was to examine changes in PROs and explore variables associated with pain reduction of 2 or more units among hospitalized patients with moderate-to-severe pain, anxiety, and stress who received at least 1 MT session within community medical centers.
2. Methods 2.1. Participants and designThis study is a retrospective review of all initial individualized MT sessions provided to adult patients (ages 18 and older) receiving care at 1 of 8 UH community medical centers between January 1, 2017 and July 30, 2020 who met the following criteria: (1) the MT session was the first session provided during the hospital admission; (2) the patient was hospitalized for at least 24 hours; (3) the patient had at least 1 pre-session PRO of ≥4 on a NRS (ie, moderate-to-severe pain, anxiety, and/or stress)41; (4) the patient either reported a complete (pre- and post-session) set of PROs or reported a pre-session PRO and fell asleep in response to the MT intervention; and (5) the session featured at least 1 MT intervention (ie, not an assessment and/or education session). Music therapy sessions not meeting these criteria were excluded from the sample.
2.2. Setting and care deliveryWithin each of the 8 community medical centers, music therapists routinely collaborate with the medical care team (eg, physicians, advanced practice providers, nurses, social workers, chaplains, etc.) to address patients' symptoms and enhance psychosocial support. Music therapists developed specific initiatives such as interdisciplinary pain rounds, a collaboration with pharmacy and nursing to optimize pain management and minimize patients' exposure to opioids. Music therapy services were designed to be initiated through referrals recorded in the electronic health record (EHR) from the medical team or through EHR lists of patients reporting pain scores of ≥7 on the NRS at the time of admission.
The focus of each MT session, including goals and interventions, are determined by the music therapist in a collaborative therapeutic relationship with the patient following an assessment of the patient's coping skills, music preferences, and symptoms. Each MT session may have 1 or more goals (eg, coping, pain management, and/or anxiety reduction) and may include multiple MT interventions (eg, active music making, songwriting, and/or music-assisted relaxation and imagery [MARI]). After the MT session, the music therapists document the details of the MT intervention and clinical outcomes in the EHR. During the retrospective study period, assessment of patients' symptoms (ie, pain, anxiety, and/or stress) was not established as a clinical expectation in all MT sessions. In most cases, if patients reported a particular symptom during the music therapist's assessment, that symptom was documented in the EHR using the appropriate NRS.
2.3. Ethics and permissionsThis study was approved by the UH Cleveland Medical Center Institutional Review Board (STUDY20191213) as a retrospective chart review with a waiver of informed consent. This study was conducted in accordance with the Declaration of the World Medical Association.
2.4. Data collectedThe following data were extracted from all EHR records meeting eligibility criteria: (1) demographic information including age, sex, race, ethnicity, marital status, and primary insurance; (2) clinical characteristics including International Classification of Diseases (ICD)-10 codes for primary and mental health diagnoses, discharge location, and length of stay; (3) MT documentation data including session beginning and end time, session goal(s), MT intervention(s) used, session narrative, pre- and post-session PROs (ie, 0–10 NRS measures of pain, anxiety, and stress), and whether the patient had fallen asleep in response to MT. The NRS is a validated and widely used measure for acute pain intensity,41 and acute pain intensity reductions of 1.3 to 1.9 units are considered clinically meaningful in noncancer patients.7 The 0 to 10 NRS has been used to measure other domains including anxiety in clinical effectiveness studies of integrative medicine24–26 and stress in a RCT of MT.49
2.5. Data analysisTo summarize patients' primary diagnoses, ICD-10 codes were categorized into Major Expanded Diagnosis Clusters (MEDCs). Descriptive statistics were calculated for patient demographics (ie, age, sex, race, ethnicity, and primary insurance), clinical characteristics (ie, inpatient length of stay, primary diagnosis, and mental health diagnosis), and MT session characteristics (ie, length, goals, and interventions). Means and bootstrapped 95% confidence intervals (CI) were used to summarize unadjusted pre- and post-session pain, anxiety, and stress scores among patients reporting pre-session symptoms of ≥4 of 10. Prior studies of integrative therapies for patients with cancer have described reductions in Edmonton Symptom Assessment Scale (ESAS) 0 to 10 scores of ≥1 as being clinically significant.33 However, other studies of acupuncture37 and MT4 among patients with cancer have defined NRS reductions of ≥2 units as clinically significant. Thus, we reported counts and percentages of NRS reductions of ≥1 and ≥2 units in defining clinical significance in this study. Instances of patients falling asleep during MT sessions were described with counts and percentages and subcategorized as asleep post-session or awake post-session. Sessions in which patients fell asleep in response to MT (and thus did not provide a post-session NRS rating) were not included in the paired comparisons or logistic regression analysis.
Before examining paired differences in PROs, histograms, box plots, and normal Q–Q plots were examined. This revealed that the data were not normally distributed. Therefore, we used a bootstrapping approach to calculate 95% CI for the changes in mean PROs (ie, post-session score minus pre-session score) with 10,000 bootstrap samples, as previously recommended in the literature.35,38 Bootstrapping is an alternative method of comparing means that does not require normally distributed data and involves examining a large number of samples with replacement from the original sample to determine a mean that is deemed to be statistically different from 0 if the 95% CI does not include 0.21 Descriptive statistics and bootstrapping procedures (ie, “smean.cl.boot” function from the “Hmisc” library20) were performed within RStudio Version 2022.12.0 + 35345 and R Version 4.2.2.44
A logistic regression model was used to explore variables associated with pain reduction of ≥2 units. Analyses of stress and anxiety reduction were beyond the scope of this article and not as feasible given the smaller samples of complete pre- and post-session data on these measures. The model included 751 observations in which (1) pre-session pain was rated ≥4, (2) post-session pain was rated, (3) the patient was discharged from either a medical/surgical or intensive care unit, and (4) there were no missing data related to race, sex, or marital status. Model covariates included (1) demographic characteristics including age, sex (ie, female or male), marital status (ie, divorced/separated/widowed, married/life partner, or single), and race (ie, Black/African American, White, or other); (2) clinical characteristics including the type of floor from which the patient was discharged (ie, medical/surgical or intensive care unit) and whether the patient had any of the following primary diagnoses that had a prevalence of ≥28 within the sample (ie, cardiovascular, general surgery, musculoskeletal, gastrointestinal/hepatic, infectious disease, respiratory, endocrine, general signs and symptoms, genitourinary, neurologic, renal, or toxic effects and adverse events); (3) operational characteristics including the calendar year in which the patient was hospitalized and the medical center where the patient was admitted (ie, hospitals coded as 1–8); and (4) whether pain management was a goal of the MT session. There were no imputation processes used to model missing covariates or pain scores. The logistic regression model was generated using Proc Logistic within SAS software, Version 9.4 of the SAS System for Windows (Cary, NC).
Model covariates were chosen based on their availability within the EHR, associations with pain in previous studies, and their role in examining predictors of pain intensity change in prior studies of inpatient integrative therapies.12 Specifically, age and sex were chosen because a recent analysis of the 2019 National Health Interview Survey found that chronic pain prevalence increased with age and was higher among women.59 Marital status (ie, divorced/widowed/single) has been associated with higher pain intensity ratings among female participants in a study of 416 patients undergoing cardiac surgery.5 Race was included given the history of racial bias among health care professionals treating pain, racial disparities in pain management,14 and findings from a recent study where Black patients with cancer receiving MT reported higher pre-session pain (4.2 vs 3.1 on ESAS) than White patients with cancer receiving MT.29
Year, floor type, and medical center were included as covariates to account for the development of the MT program as it expanded to different locations from 2017 to 2020 and differences in pain management practices based on floor type and medical center. Primary diagnoses that had a prevalence of ≥28 within the sample were included as binary indicators to determine whether odds of pain reduction ≥2 differed based on the major clinical populations prevalent within the sample. A cutoff of 28 was chosen to avoid convergence issues with smaller clinical populations (ie, n < 28) in the sample (Table 2). Finally, pain management as a session goal was included as an indicator of music therapists' intention to prioritize this domain within the session. Music therapy intervention categories described in Table 3 were not included in the model because these categories were applied retrospectively based on an analysis of music therapists' free-text descriptions of their interventions and may not have reflected the total scope of the interventions they provided.
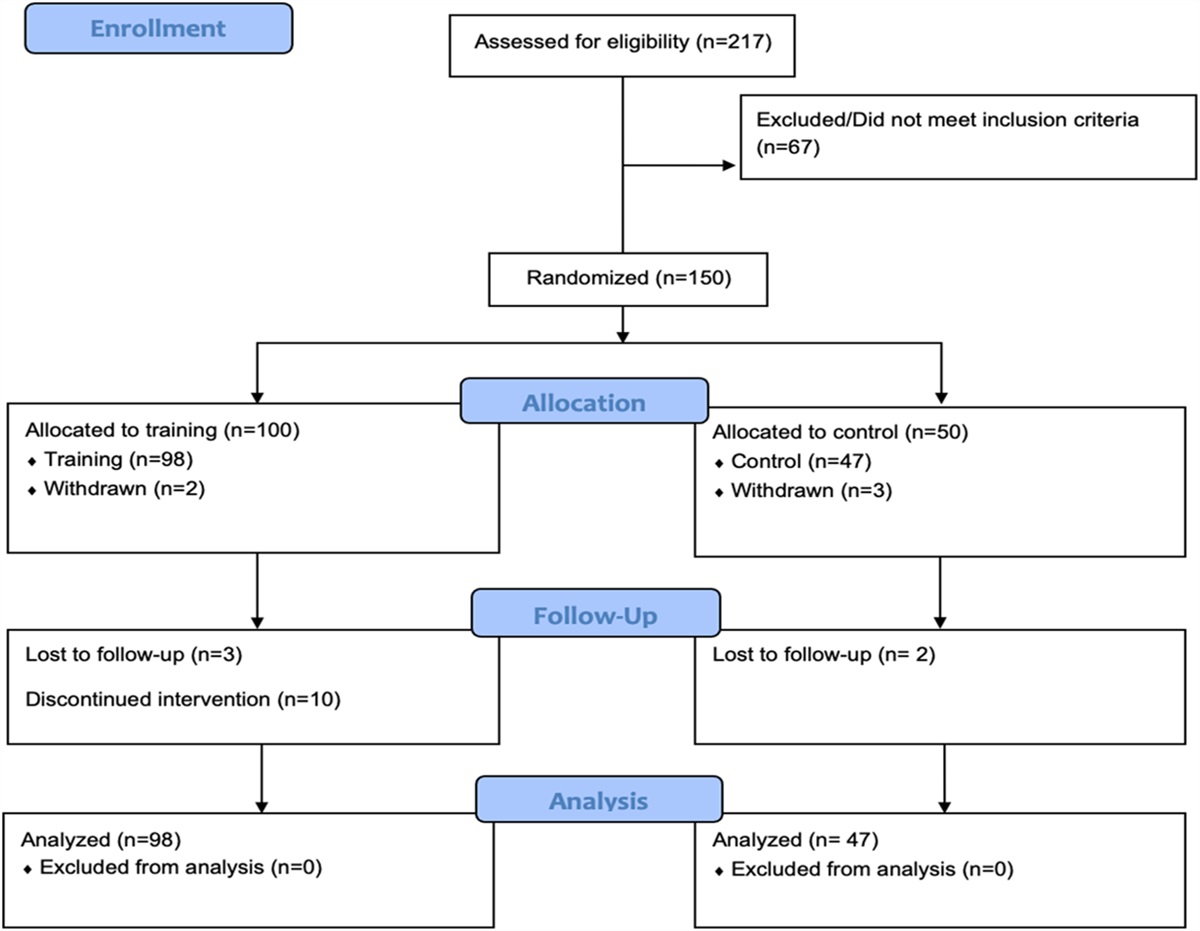
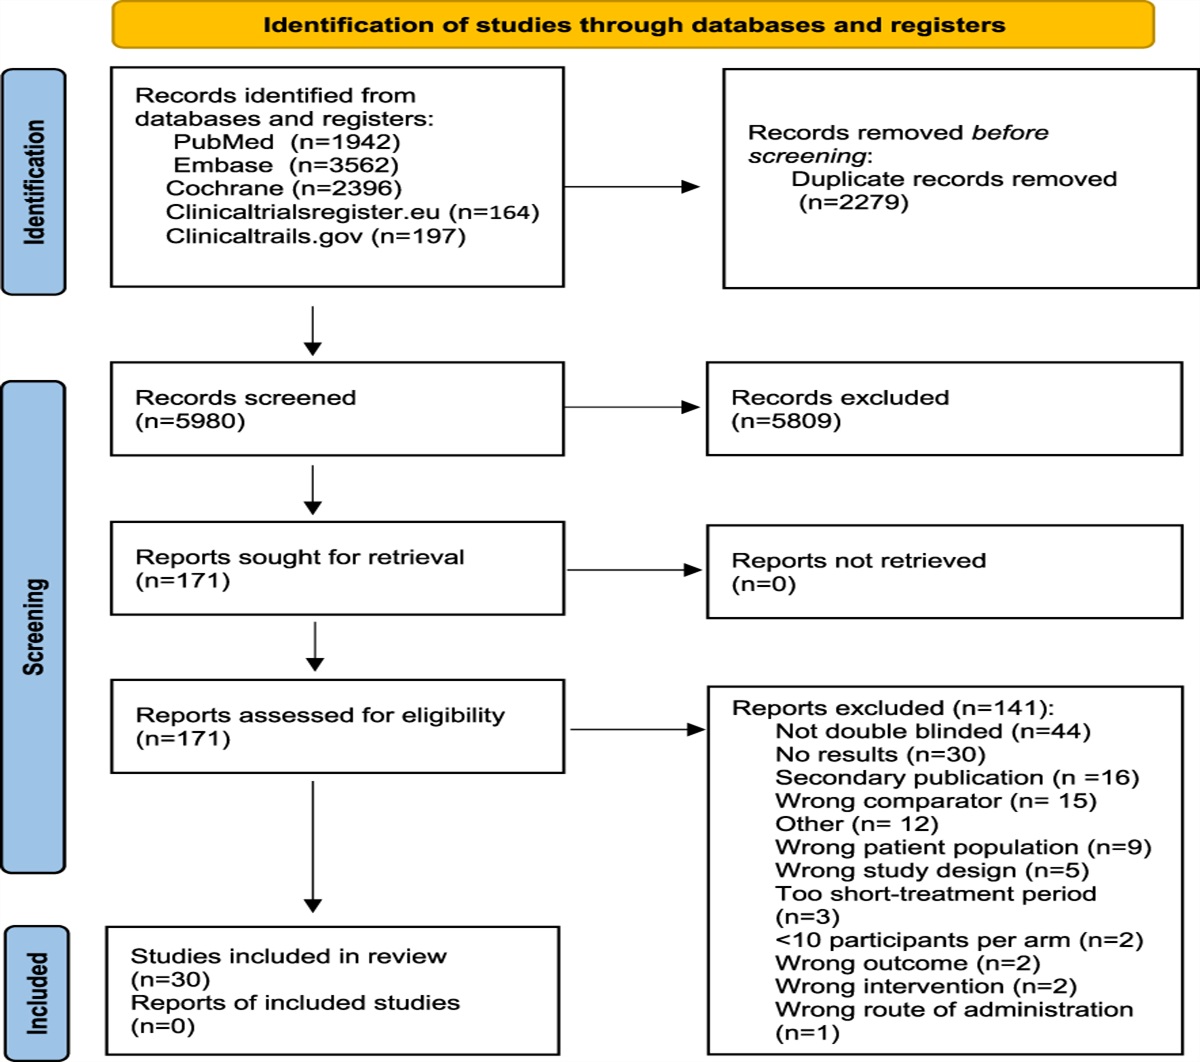
3. Results 3.1. Demographics and clinical characteristicsFigure 1 provides a flow chart of the patients, hospital admissions, and MT EHR documents/notes included in this sample. Between January 2017 and July 2020, music therapists provided 1056 MT sessions meeting eligibility criteria to adults hospitalized in community medical centers. Table 1 summarizes the demographics of the study sample. Patients were mostly female (76.1%), White (57.1%) or Black/African American (41.1%), and non-Hispanic (96.6%). The mean age at the time of hospital admission was 63.83 ± 15.98 years, and patients were insured under Medicare (43.9%), Medicaid (13.2%), or private insurance (11.0%). Table 2 summarizes the clinical characteristics of patients' hospital admissions. Patients were primarily discharged from general medical/surgical units (95.1%). Patients' hospital admissions (median length of stay 4 days) were primarily for musculoskeletal (18.8%), cardiovascular (11.5%), general surgery (10.2%), respiratory (8.6%), or gastrointestinal/hepatic (7.5%) conditions. In addition, 376 hospital admissions (35.6%) included a mental health diagnosis in the patients' EHR.
 Figure 1.:
 Flow diagram of study participants. EHR, electronic health record; MT, music therapy; PROs, patient-reported outcomes.
Variables All admissions (n = 1056) Age (y) Mean ± SD 63.83 ± 15.98 Range 18–105 Sex, n (%) Female 804 (76.1) Male 252 (23.9) Race*, n (%) White 603 (57.1) Black/African American 434 (41.1) Other 19 (1.8) Ethnicity, n (%) Non-Hispanic 1020 (96.6) Declined/missing 16 (1.5) Hispanic or Latino 20 (1.9) Marital status, n (%) Married/life partner 330 (31.3) Single 325 (30.8) Widowed 232 (22.0) Divorced 141 (13.4) Separated 23 (2.2) Unknown 5 (0.5) Primary insurance, n (%) Medicare 464 (43.9) Medicaid 139 (13.2) Private 116 (11.0) Missing† 310 (29.4) Other 21 (2.0) Self-pay 6 (0.6)*Race, including multiracial, is reported exactly as it was entered into the EHR.
†Insurance information was not available for all hospital admissions in the retrospective analysis at the time the data were extracted from the EHR. Missing insurance information does not indicate that the patients were uninsured.
*Other principal diagnoses Major Expanded Diagnosis Cluster groups with n < 10 included allergy; administrative; skin; nutrition; ear, nose, and throat; reconstructive; dental; and genetic.
†Other unit locations included inpatient psychiatric and physical rehabilitation units.
Table 3 summarizes the MT session characteristics of the 1056 MT interventions with descriptions of each goal and intervention. Music therapists primarily addressed goals including pain management (73.4%), coping (24.5%), stress reduction (22.3%), relaxation (15.5%), anxiety reduction (14.7%), and mood modification (9.8%). Within the MT interventions (mean length: 30.48 ± 13.53 minutes), music therapists primarily used music listening (live or recorded) (86.0%), MARI (17.5%), and active music making (8.7%).
Table 3 - Music therapy goals and interventions. Description All admissions (n = 1056) MT goals, n (%) Pain management Reduce pain intensity 775 73.4% Coping Promote/reinforce adaptive skills for managing hospitalization 259 24.5% Stress reduction Reduce feelings of psychological or emotional strain 236 22.3% Relaxation Promote release of tension 164 15.5% Anxiety reduction Reduce feelings of worry, fear, or nervousness 155 14.7% Mood modification Improve affect/emotional state 104 9.8% Self-expression Provide means of expressing thoughts, feelings, and emotions 59 5.6% Normalization Promote acceptance of hospital environment 26 2.5% Improve well-being Promote a positive feeling of overall health and functioning 16 1.5% Improve locus of control Improve perception of control over situation 12 1.2% Provide comfort Promote feelings of ease 11 1.0% Other goals addressed eg, spiritual support, emotional support, and family support 57 5.4% MT interventions, n (%) Music listening Therapist provides music. Patient listens and/or discusses 908 86.0% Live Therapist provides live music 622 58.9% NOS* Therapist provides music not specified as live or recorded 285 27.0% Recorded Therapist provides recorded music 15 1.4% MARI† Therapist engages patient with live or recorded music and guided relaxation, breathing, and/or imagery 185 17.5% Active music making Patient engages in making (improvising/recreating, etc.) music on any instrument including voice 92 8.7% Song choice Patient chooses songs used in MT session 24 2.3% Song discussion Patient discusses meaning/significance related to songs used 20 1.9% Songwriting Therapist assists patient in creating a new song 13 1.2% Lyric analysis Therapist engages patient in analyzing lyrics of a song 10 0.9% Music-assisted life review Therapist helps patient reminisce and/or reexamine the past 10 0.9% Iso-principle Therapist matches patient's current state and then shifts musical elements (tempo/dynamics) in desired direction to affect change 7 0.7% Listening/support Therapist provides support, validation, and/or verbal processing 7 0.7% Other intervention eg, neurologic MT techniques 4 0.4%More than 1 goal and MT intervention may be included within each MT session. Language used to describe goals were derived from music therapists' free-text descriptions. Thus, some goals (ie, provide comfort, relaxation) may address similar domains but with different language.
*Music listening not otherwise specified (NOS) was defined as MT interventions for which a live or recorded descriptor was not included. Most of these interventions are assumed to be live.
†MARI, music-assisted relaxation and imagery.
MT, music therapy.
Table 4 summarizes the effectiveness of MT on pain, anxiety, and stress for patients reporting moderate-to-severe pre-session symptoms. Of the 847 patients reporting a pain score of ≥4, 118 (13.9%) fell asleep during MT sessions. These patients included 70 (8.3%) who were asleep at the end of the MT session and 48 (5.7%) who fell asleep and later awoke before the end of the MT session. In addition, 85 patients (10.0%) had a severe pre-session pain score (mean = 7.51) and fell asleep during the session without providing a post-session pain score. Complete pre- and post-session scores were available for moderate-to-severe pain (n = 756 sessions, pre-session mean = 7.11), anxiety (n = 185 sessions, pre-session mean = 6.71), and stress (n = 153 sessions, pre-session mean = 6.92). Patients reported clinically significant mean changes in pain (−2.04, 95% CI: [−2.20, −1.89]), anxiety (−2.80, 95% CI: [−3.08, −2.53]), and stress (−3.48, 95% CI: [−3.81, −3.17]). Among sessions with complete pre- and post-session scores, clinically significant reductions in symptoms (ie, ≥1 unit) were reported by 76.3% of patients reporting pain, 91.9% of patients reporting anxiety, and 95.4% of patients reporting stress. Reductions of ≥2 units were reported by 51.1% of patients reporting pain, 84.9% of patients reporting anxiety, and 90.2% of patients reporting stress.
Table 4 - Effectiveness of music therapy on pre-session moderate-to-severe patient-reported outcomes. Outcome N Result 95% CI* Pain Pre-session, mean 847 7.15 7.02, 7.27 Pre-session (with complete post-session score), mean 756 7.11 6.98, 7.24 Post-session, mean 756 5.07 4.89, 5.26 Change, mean 756 −2.04 −2.20, −1.89 ≥1 unit reduction, (%)† 577 76.3% ≥2 unit reduction, (%)† 386 51.1% Sleep response, (%)‡ 118 13.9% Asleep post-session, (%)‡ 70 8.3% Awake post-session, (%)‡ 48 5.7% Anxiety Pre-session, mean 204 6.69 6.41, 6.98 Pre-session (with complete post-session score), mean 185 6.71 6.42, 7.01 Post-session, mean 185 3.91 3.59, 4.23 Change, mean 185 −2.80 −3.08, −2.53 ≥1 unit reduction, (%)† 170 91.9% ≥2 unit reduction, (%)† 157 84.9% Stress Pre-session, mean 169 7.00 6.70, 7.29 Pre-session (with complete post-session score), mean 153 6.92 6.62, 7.23 Post-session, mean 153 3.44 3.08, 3.79 Change, mean 153 −3.48 −3.81, −3.17 ≥1 unit reduction, (%)† 146 95.4% ≥2 unit reduction, (%)† 138 90.2%*Bootstrapped confidence interval performed with 10,000 iterations using the “smean.cl.boot” function from the “Hmisc” library in RStudio Version 2022.12.0 + 353 and R Version 4.2.2.
†Percent reductions were calculated with the total number of sessions with complete pre- and post-session scores as the denominator.
‡Percentage of sleep responses were calculated with the total number of sessions with complete pre-session pain scores as the denominator (n = 847).
CI, confidence interval.
Table 5 summarizes the logistic regression model, which had a c-statistic of 0.668 indicating poor discrimination.23 Demographic and clinical characteristics had no statistical association with pain reduction of ≥2 units. After adjusting for all other covariates in the model, patients receiving an MT session in which pain management was a goal (n = 683) were 4.32 times more likely (95% CI: [2.26, 8.66]) to report pain reduction of ≥2 units than those receiving an MT session in which pain management was not a goal (n = 68). In addition, patients receiving MT sessions in 2019 (n = 295) were 41.9% less likely (odds ratio [OR] = 0.58, 95% CI: [0.36, 0.94]) to report pain reduction of ≥2 units than those receiving MT sessions in 2020 (n = 137), and patients receiving MT sessions at hospital 8 (n = 16) were 4.6 times more likely (95% CI: [1.26, 22.72]) to report pain reduction of ≥2 units than those receiving MT sessions at hospital 1 (n = 295). Supplementary Figure 1 (available at https://links.lww.com/PR9/A189) provides a receiver operating characteristic (ROC) curve for the model.
Table 5 - Results from logistic regression of 751 music therapy sessions. Variable category Comparison Odds ratio 95% CI Lower Upper Age 10-y increase in age 1.035 0.923 1.160
留言 (0)