
記住我
Global surgery volumes are growing, with ∼312.9 million operations performed in 2012.47 Based on in-hospital data, up to 80% of patients experience postsurgical pain, with >70% as moderate to severe.2 Various clinical advances and institutional changes are resulting in shorter postsurgical hospital stays.9,10 Shorter hospital stays shift the onus of pain management from hospital staff to the patient and their home caregivers. However, discharge instructions to patients may be inadequate or forgotten by the patient, potentially explaining reports of higher pain levels postdischarge vs in hospital.9
Postsurgical analgesia is imperative for functional recovery, and poorly controlled pain results in personal suffering and contributes to cardiorespiratory complications.5 Such complications increase economic burden of hospital readmissions, emergency room visits, and caregiver burden.32 Furthermore, undertreated acute pain is associated with an increased risk of chronic postsurgical pain (CPSP).20 Chronic postsurgical pain affects 10% to 40% of patients, with a growing impact given rising surgical volumes.41 Chronic postsurgical pain is associated with high symptom burden and large economic impact.21
Managing postoperative pain after hospital discharge incorporates managing the adverse effects of analgesic treatments and minimizing other risks, such as persistent opioid use.41 In addition to acetaminophen, nonsteroidal anti-inflammatory drugs (NSAIDs), and regional analgesia, opioids are the mainstay of postoperative pain management after discharge.49 Adverse effects of commonly used nonopioids necessitate careful prescribing and may limit their use as opioid-sparing analgesics.49 Regional analgesia, on the other hand, is often limited by their short duration. Postsurgical data suggest that opioids are frequently prescribed in excess, with potentially inadequate follow-up.21 This is concerning given reports of high rates of persistent opioid use after surgery.13,24 Since perioperative clinicians may have limited follow-up with their postoperative patients and general practitioners may be uncomfortable managing complex postsurgical patients while they are recovering at home, the early postdischarge postoperative period may be a vulnerable period, leaving patients' pain inadequately managed.
Appropriate pain management for surgical patients after hospital discharge gets little attention yet is critical in a patient's healing trajectory. Most studies focusing on postoperative pain have been conducted on patients before discharge, whereas the period after discharge seems to be much less investigated. To the best of our knowledge, no previous systematic reviews have been conducted investigating the issue of postoperative pain after hospital discharge. Thus, this systematic review aims to investigate this period for patients in regard to postoperative pain to quantify the extent of this problem and identify future research and clinical needs.
The objective of this review is to provide an up-to-date synthesis of available evidence on the prevalence of moderate-to-severe postoperative pain within the first 1 to 14 days after hospital discharge and compare the findings in patients who undergo ambulatory surgery (same day) with those having inpatient surgery (at least 1-night hospital stay).
2. Methods 2.1. GuidelinesThe review protocol has been previously published,36 registered in the International Prospective Register of Systematic Reviews (PROSPERO) database (registration number CRD42020194346), and reported in accordance with the Preferred Reporting Items for Systematic Reviews and Meta-Analyses Protocols (PRISMA-P) checklist.34 The systematic review is performed in accordance with the Preferred Reporting Items for Systematic Reviews and Meta-Analyses (PRISMA) guidelines33 and the Meta-analyses Of Observational Studies in Epidemiology (MOOSE) checklist.42
2.2. Sources of evidenceWe conducted a detailed search on MEDLINE and EMBASE from their inception until November 2020. The search included terms relating to postoperative pain, the time frame after hospital discharge, and search filters for epidemiological studies. The search strategies were developed in consultation with a librarian with expertise in literature searches. The search strategy for MEDLINE is shown in Appendix 1 (available as supplemental digital content at https://links.lww.com/PR9/A193). We also reviewed the bibliographies of any studies identified for relevance.
2.3. Types of studiesThe review included observational studies of postsurgical patients as study participants that assessed postoperative pain at home, or other nonhospital settings, after hospital discharge.
2.4. Types of participantsWe included studies with adult participants (eg, aged 18 years and older) who underwent a surgical procedure.
2.5. Data collection, extraction, and managementTwo trained reviewers (R.P. and M.M.) independently evaluated studies for eligibility. Screening was performed on titles and abstracts using Covidence software.14 Citations were stored in EndNote software (Clarivate Analytics, London, United Kingdom). Full-text screening was performed on citations deemed to be potentially eligible. Disagreements between reviewers was resolved by discussion and consensus, and if necessary, a third reviewer was consulted (I.G.).
Data from included studies were extracted using standardized extraction forms specifically designed for this review. These forms captured information about the surgical procedure, total number of participants before and after dropouts, patient inclusion and exclusion criteria, patient characteristics, time points for pain intensity measurements, primary and secondary outcome measures, and other study characteristics.
2.6. Primary outcomeThe primary outcome of this review is the proportion of patients reporting moderate-to-severe postoperative pain at rest or with movement, or both, within the first 1 to 14 days after hospital discharge. We chose this time frame because the first 2 weeks after surgery are most commonly associated with pain of the highest severity and most functional consequences. We preferentially used 4/10 (Numerical Rating Scale), 40/100 (Visual Analog Scale), or ≥moderate pain (category scale) as the threshold for moderate pain. If those specific data were not available and if a study provided pain prevalence estimates using their own definition of moderate pain (eg, fair pain), we used the data as provided, but these prevalence estimates were not included in pooled analyses.
2.7. Secondary outcomesOur secondary outcomes for this review are (1) a comparison of the proportion of participants reporting moderate-to-severe postoperative pain within the first 1 to 14 days after discharge between those who underwent ambulatory surgery (same day) and those who underwent inpatient surgery (at least 1-night hospital stay) and (2) adverse outcomes experienced by participants within the first 1 to 14 days after discharge that are attributable to poor pain control, including readmission to hospital, emergency room, or other unplanned medical visits, and decreased quality of life.
2.8. Analysis of outcomesOnly similar studies (eg, outcomes measured, similar postoperative days when outcomes were measured) were combined for analysis. Extracted data were recorded in Microsoft Excel for analysis. Analyses were performed using Comprehensive Meta-Analysis Version 3 software. We used a random-effects model for meta-analysis to calculate prevalence estimates if deemed appropriate to combine studies. Prevalence estimates were reported using the event rate. The 95% confidence intervals (CIs) were calculated using standard error and sample size.
We assessed statistical heterogeneity using the I2 statistic.
If inappropriate to combine studies, a descriptive approach was used to report the primary and secondary outcomes.
2.9. Assessment of risk of bias in included studiesRisk of bias for each study was independently assessed by 2 reviewers (R.P. and M.M.). We used the risk-of-bias tool for prevalence studies developed by Hoy et al.,23 which includes 10 items plus a summary assessment. Items 1 to 4 assess the external validity of the study, and items 5 to 10 assess the internal validity. Disagreements between reviewers were resolved with discussion and consensus. If necessary, a third reviewer (I.G.) was consulted.
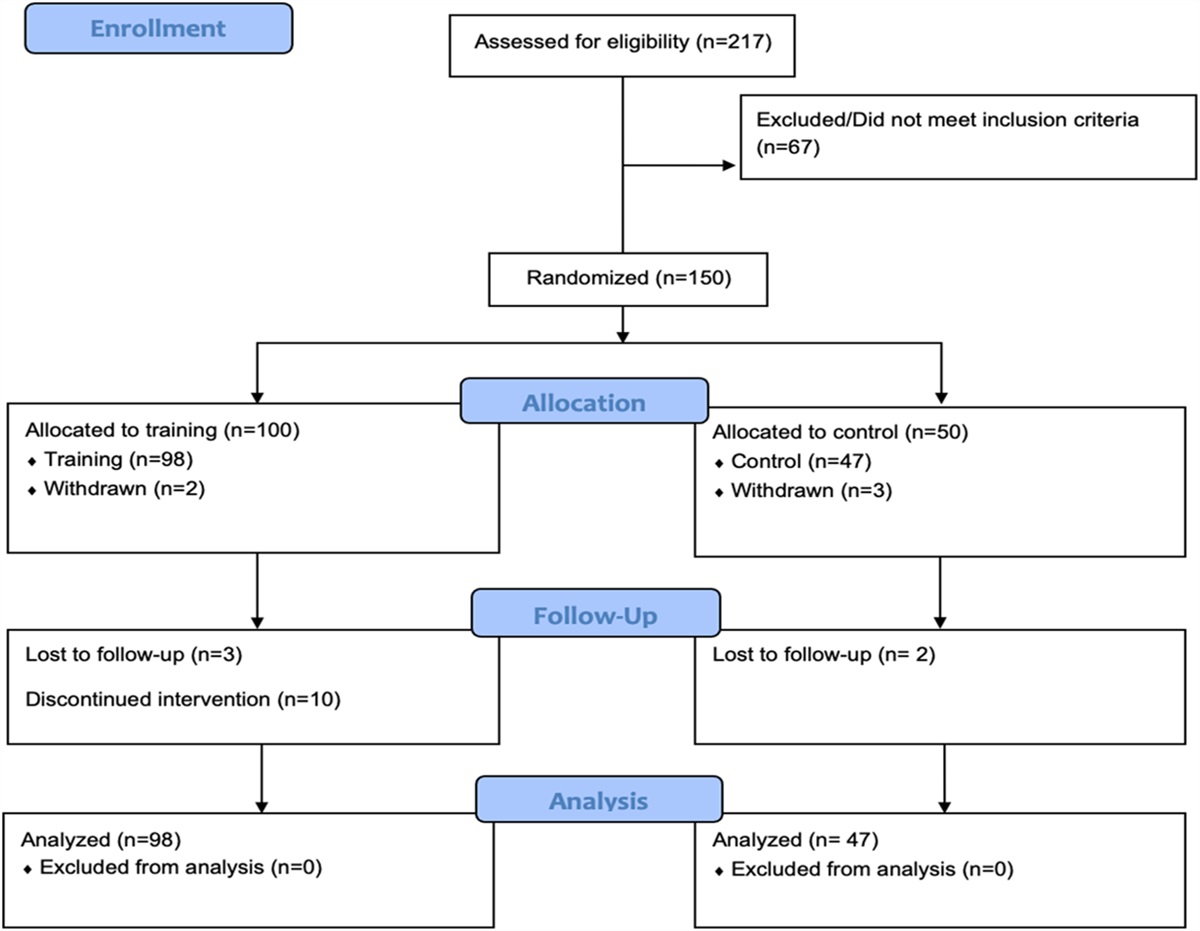
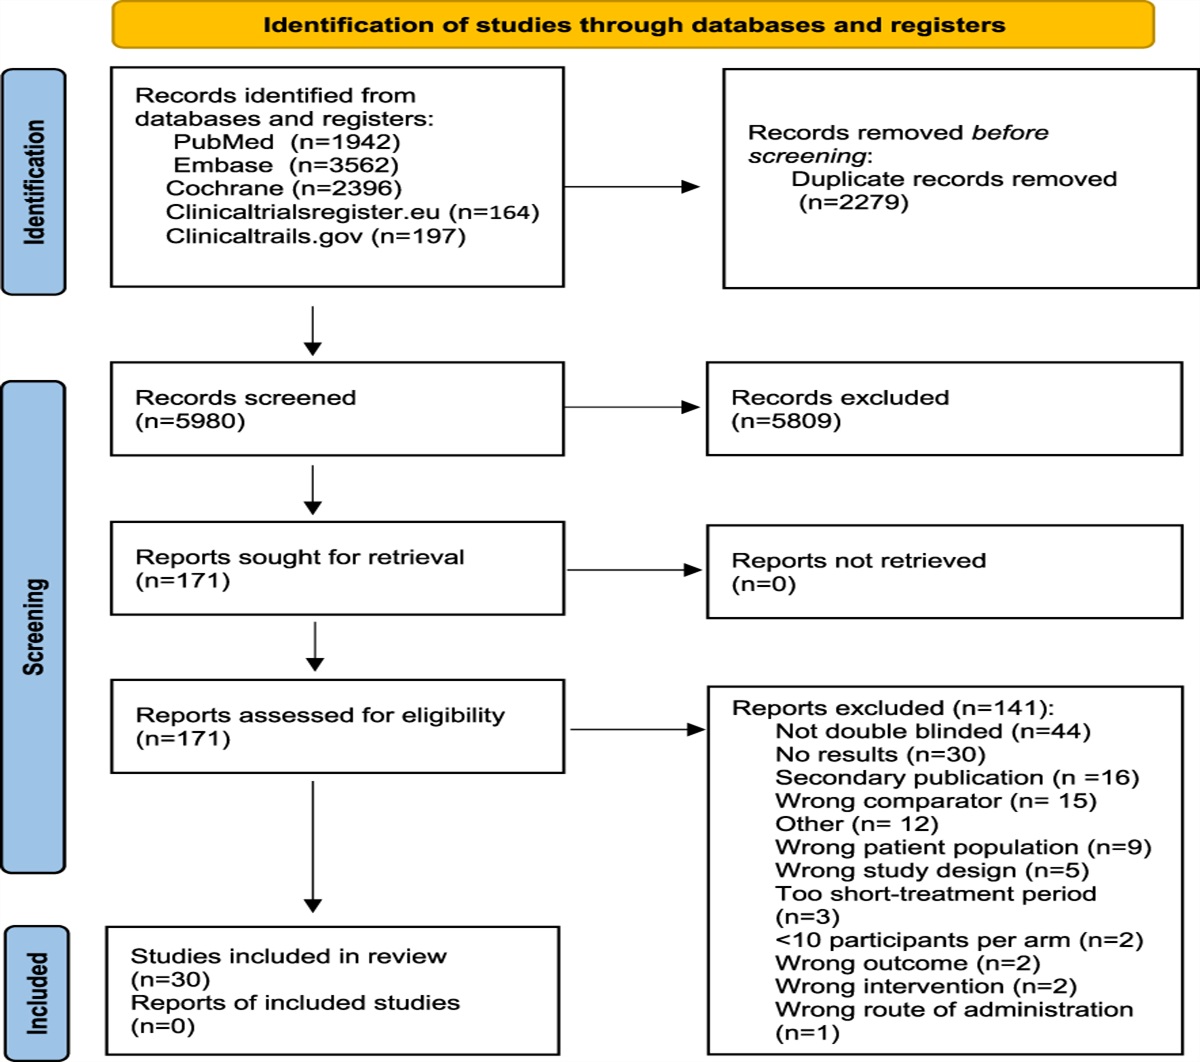
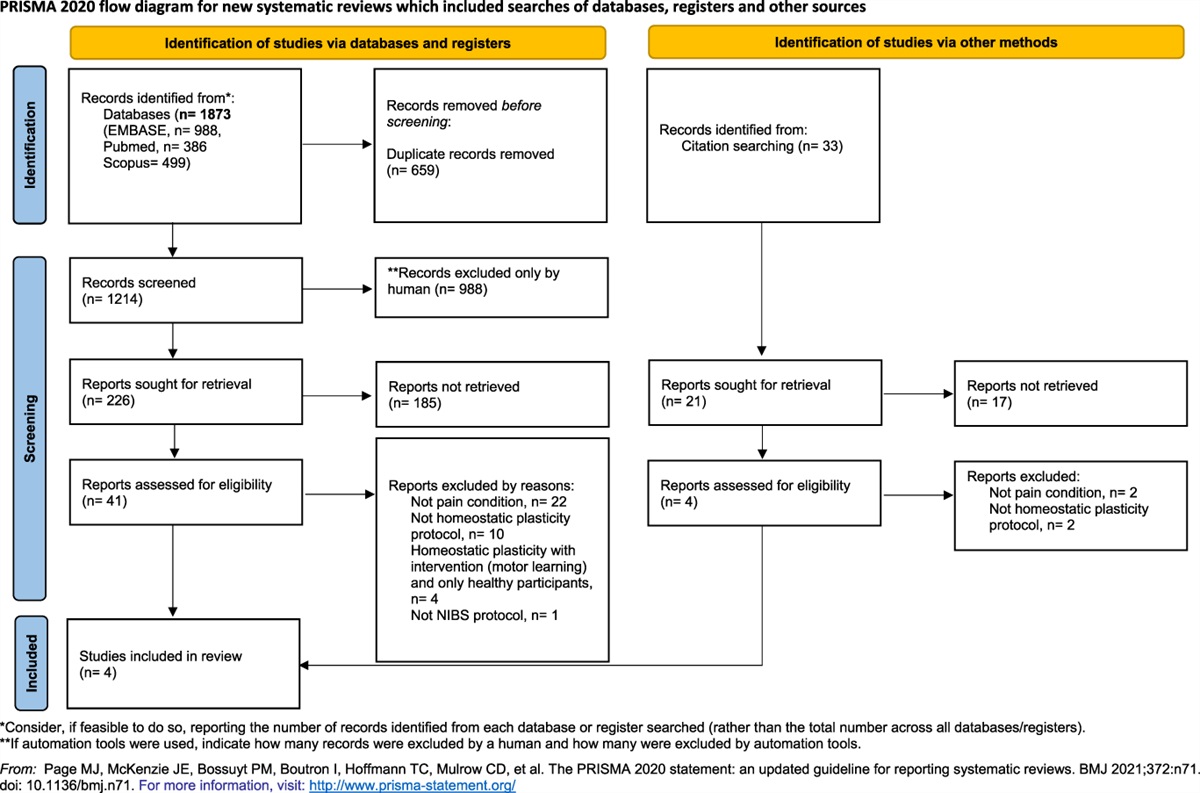
3. ResultsOur search yielded 8626 citations. After removal of duplications, 8499 studies were reviewed for title and abstract screening. We identified 72 relevant records for full-text screening and excluded 45 studies (Fig. 1). Twenty-seven studies fulfilled the inclusion criteria and were included into the systematic review.
 Figure 1.:
 PRISMA flow diagram. PRISMA, Preferred Reporting Items for Systematic Reviews and Meta-Analyses.
3.1. Study characteristicsTable 1 displays the characteristics of the included studies, including study size, participant age range, surgery type, ambulatory vs inpatient setting, postoperative time points at which pain was assessed, and pain prevalence estimates. The 27 studies enrolled a total of 22,108 participants from: studies involving mixtures of different surgical procedures (n = 20 studies),2–4,6,7,11,16–18,22,26,28,30–32,35,37,40,45,46 total knee replacement (n = 2 studies),8,9 sternotomy (n = 1 study),44 laparoscopic surgery (n = 1 study),48 cataract surgery (n = 1 study),39 orthopedic surgery (n = 1 study),43 and routine dentoalveolar surgery (n = 1 study).25 The 27 studies included ambulatory surgeries (n = 19),3,4,7,11,16,17,22,25,26,28,30–32,35,37,39,40,46,48 inpatient surgeries (n = 1),6 mixtures of both inpatient and ambulatory surgeries (n = 4),2,18,43,45 or was not specified (n = 3).8,9,44 Only one study specified whether the pain being assessed was at rest or with movement.16
Table 1 - Summary of included studies. Author, y Study size (dropouts or nonparticipants) Age range or mean (SD) Surgery type Ambulatory or inpatient Timepoint after discharge Prevalence of moderate-to-severe pain 95% CI (%) Apfelbaum, 20032 n = 250 (unclear) Median: 46 Various (not specified) Both First 2 wk 81% 75.7–85.4 Bain, 19993 n = 5069 (1661) Not reported VariousENT, Ear, Nose, Throat; MSK, musculoskeletal; TURP, transurethral resection of the prostate.
The results of each individual risk-of-bias domain are presented as a risk-of-bias table in Table 2. Twelve studies were judged to be at a high or unclear risk of bias for sample selection, and 7 studies were judged to be at a high or unclear risk of nonresponse bias. Overall, 19 studies were judged to be low risk of bias, 7 to be moderate risk of bias, and 1 to be high risk of bias.
Table 2 - Risk of bias assessments for included studies. Author, y Was the study's target population a close representation of the national population in relation to relevant variables? Was the sampling frame a true or close representation of the target population? Was some form of random selection used to select the sample, or was a census undertaken? Was the likelihood of nonresponse bias minimal? Were data collected directly from the subjects (as opposed to a proxy)? Was an acceptable case definition used in the study? Was the study instrument that measured the parameter of interest shown to have validity and reliability? Was the same mode of data collection used for all subjects? Was the length of the shortest prevalence period for the parameter of interest appropriate? Were the numerator(s) and denominator(s) for the parameter of interest appropriate? Summary item on the overall risk of study bias Apfelbaum, 20032 Low Low Low Low Low Low Low Low Low Low Low Bain, 19993 Low Low High Low Low Low High Low Low Low Moderate Beauregard, 19984 Low Low High Low Low Low Low Low Low Low Low Buvanendran, 20156 Low Low Low Low Low Low Low Low Low Low Low Campagna, 20167 Low Low High High/Unclear Low Low Low Low Low Low Moderate Chan, 20139 Low Low Low Low Low Low Low Low Low Low Low Chan, 2013–28 Low Low Low Low Low Low Low Low Low Low Low Chung, 199711 Low Low Low High Low Low Low Low Low Low Low Elaqoul, 201716 Low Low High Low Low Low Low Low Low Low Low Fadiora, 200717 High Low High Low Low High/unclear Low Low Low Low High Gan, 201418 Low Low Low Low Low Low Low Low Low Low Low Gramke, 200722 Low Low Low Low Low Low Low Low Low Low Low Joshi, 200025 Low Low High/unclear Low Low Low Low Low Low Low Low Kangas-Saarela, 199926 Low Low Low Low Low High/unclear Low Low Low Low Low Kemper, 200228 Low Low High High/unclear Low Low Low Low Low Low Moderate Mattila, 200530 Low Low Low High Low Low Low Low Low Low Low McGrath, 200431 Low Low Low High Low Low Low Low Low Low Low McHugh, 200232 Low Low Low Low Low Low Low Low Low Low Low Mwaka, 201335 Low Low Low Low Low Low Low Low Low Low Low Pavlin, 200437 Low Low High Low Low Low Low Low Low Low Moderate Porela-Tiihonen, 201339 Low Low Low Low Low Low Low Low Low Low Low Serra, 201640 Low Low Low Low Low Low Low Low Low Low Low Veal, 201543 Low Low Low Low Low Low Low Low Low Low Low Veal, 201644 Low Low High/unclear Low Low Low Low Low Low Low Low Veal, 201745 Low Low High/unclear High Low Low Low Low Low Low Moderate Watt-Watson, 200446 Low Low High High/unclear Low Low Low Low Low High Moderate Willsher, 199848 Low Low High Low Low High/unclear Low Low Low Low ModerateFourteen studies reported the prevalence of moderate-to-severe pain 1 day after discharge.3,4,7,11,16,22,25,28,30,31,35,37,39,48 The prevalence ranged from 7% to 60%. The 2 studies with the lowest prevalence were af
留言 (0)