
記住我
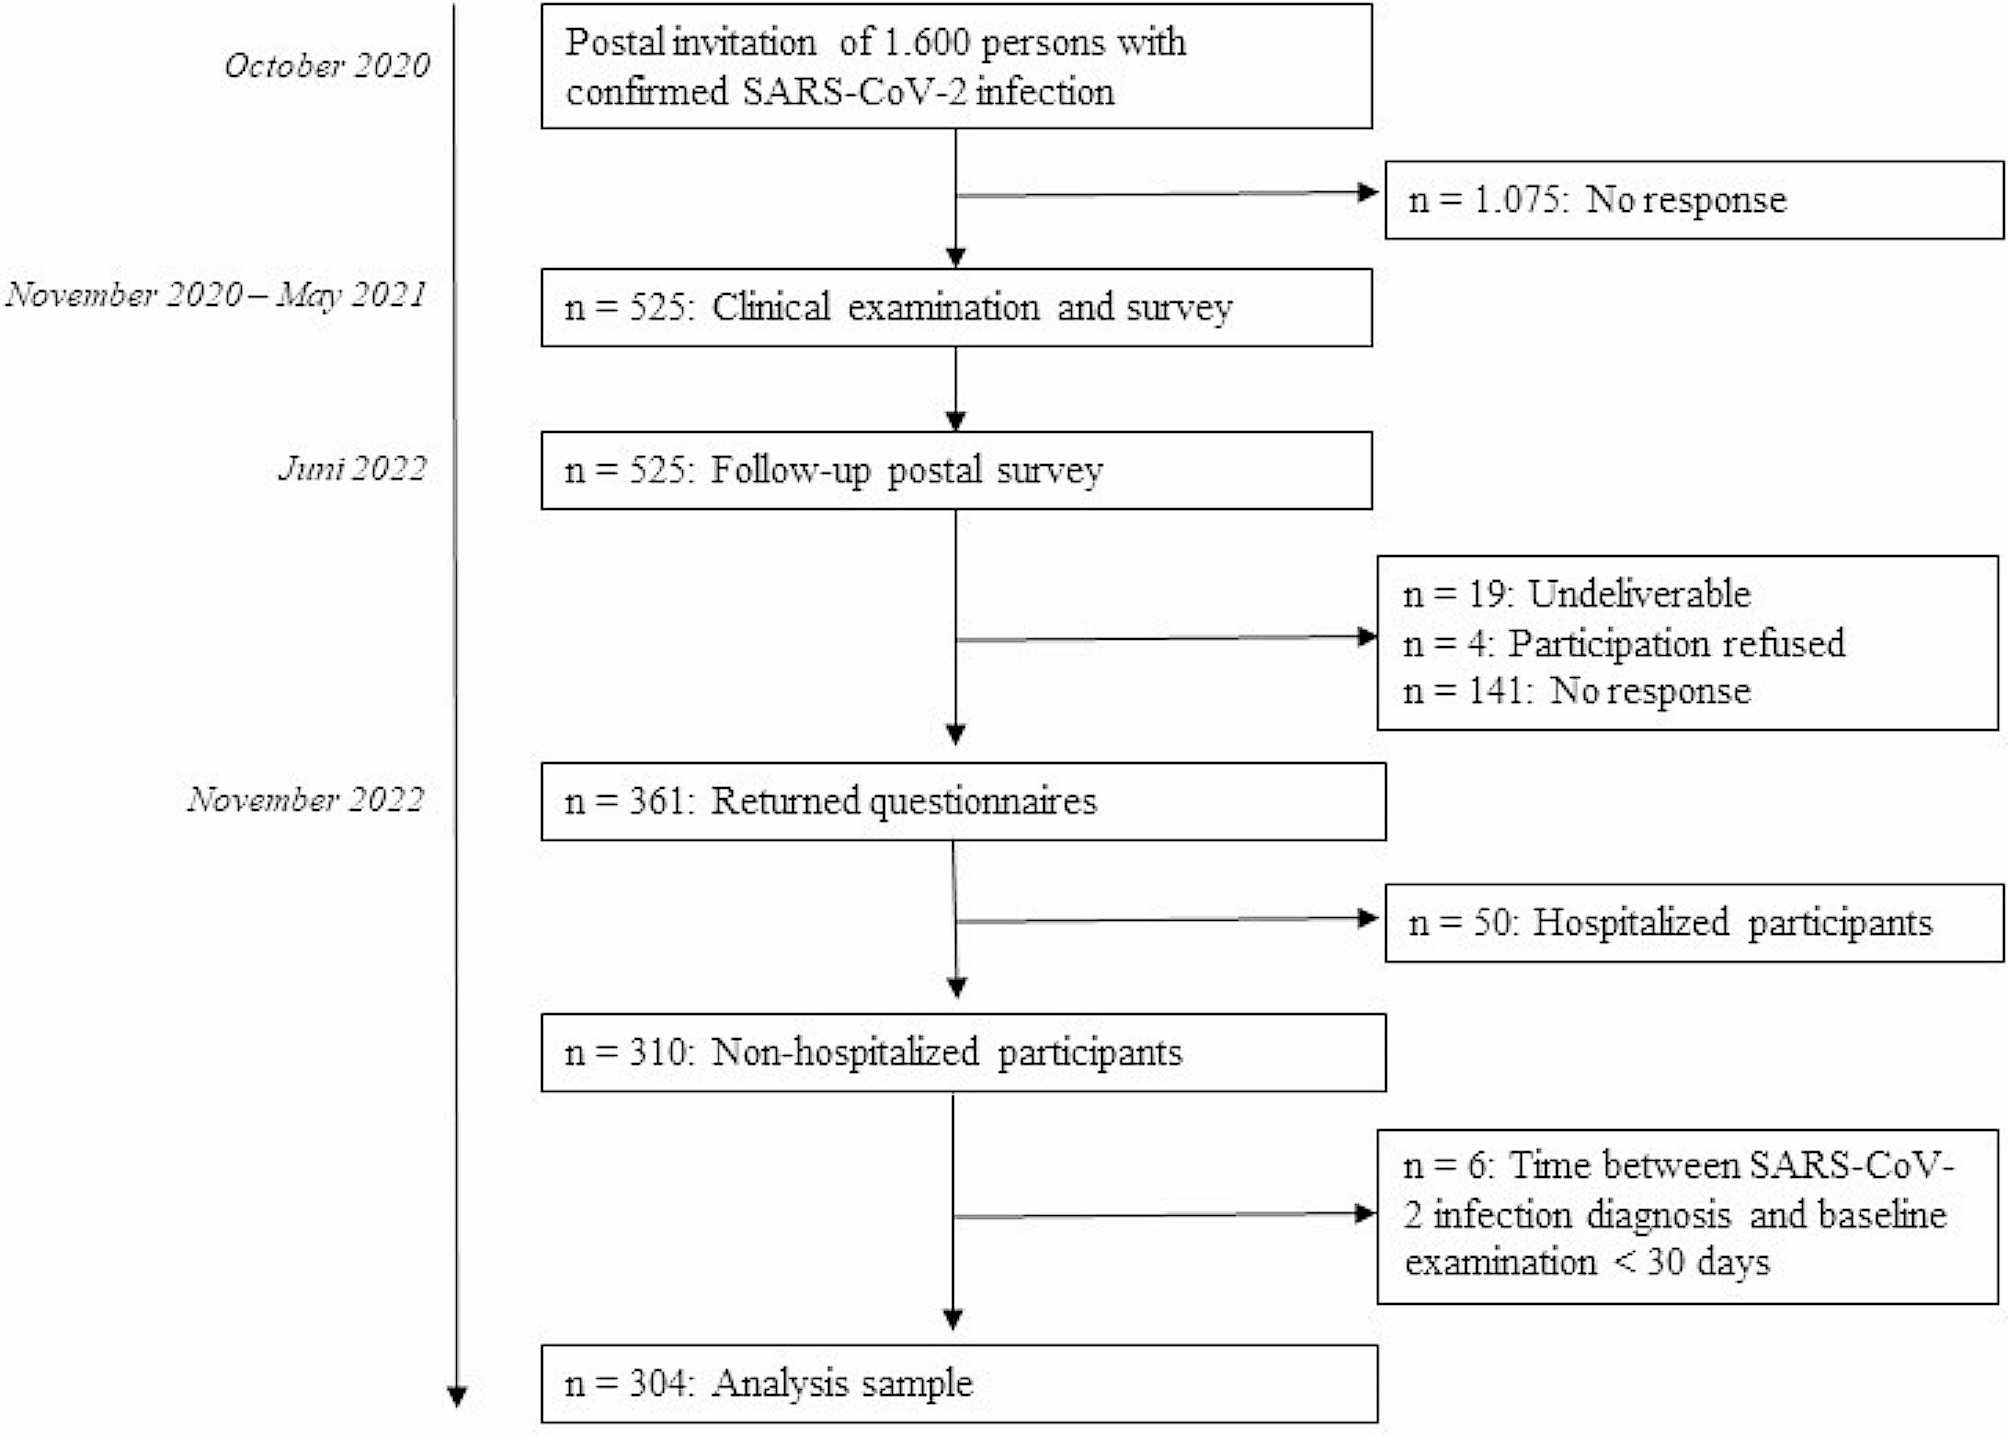
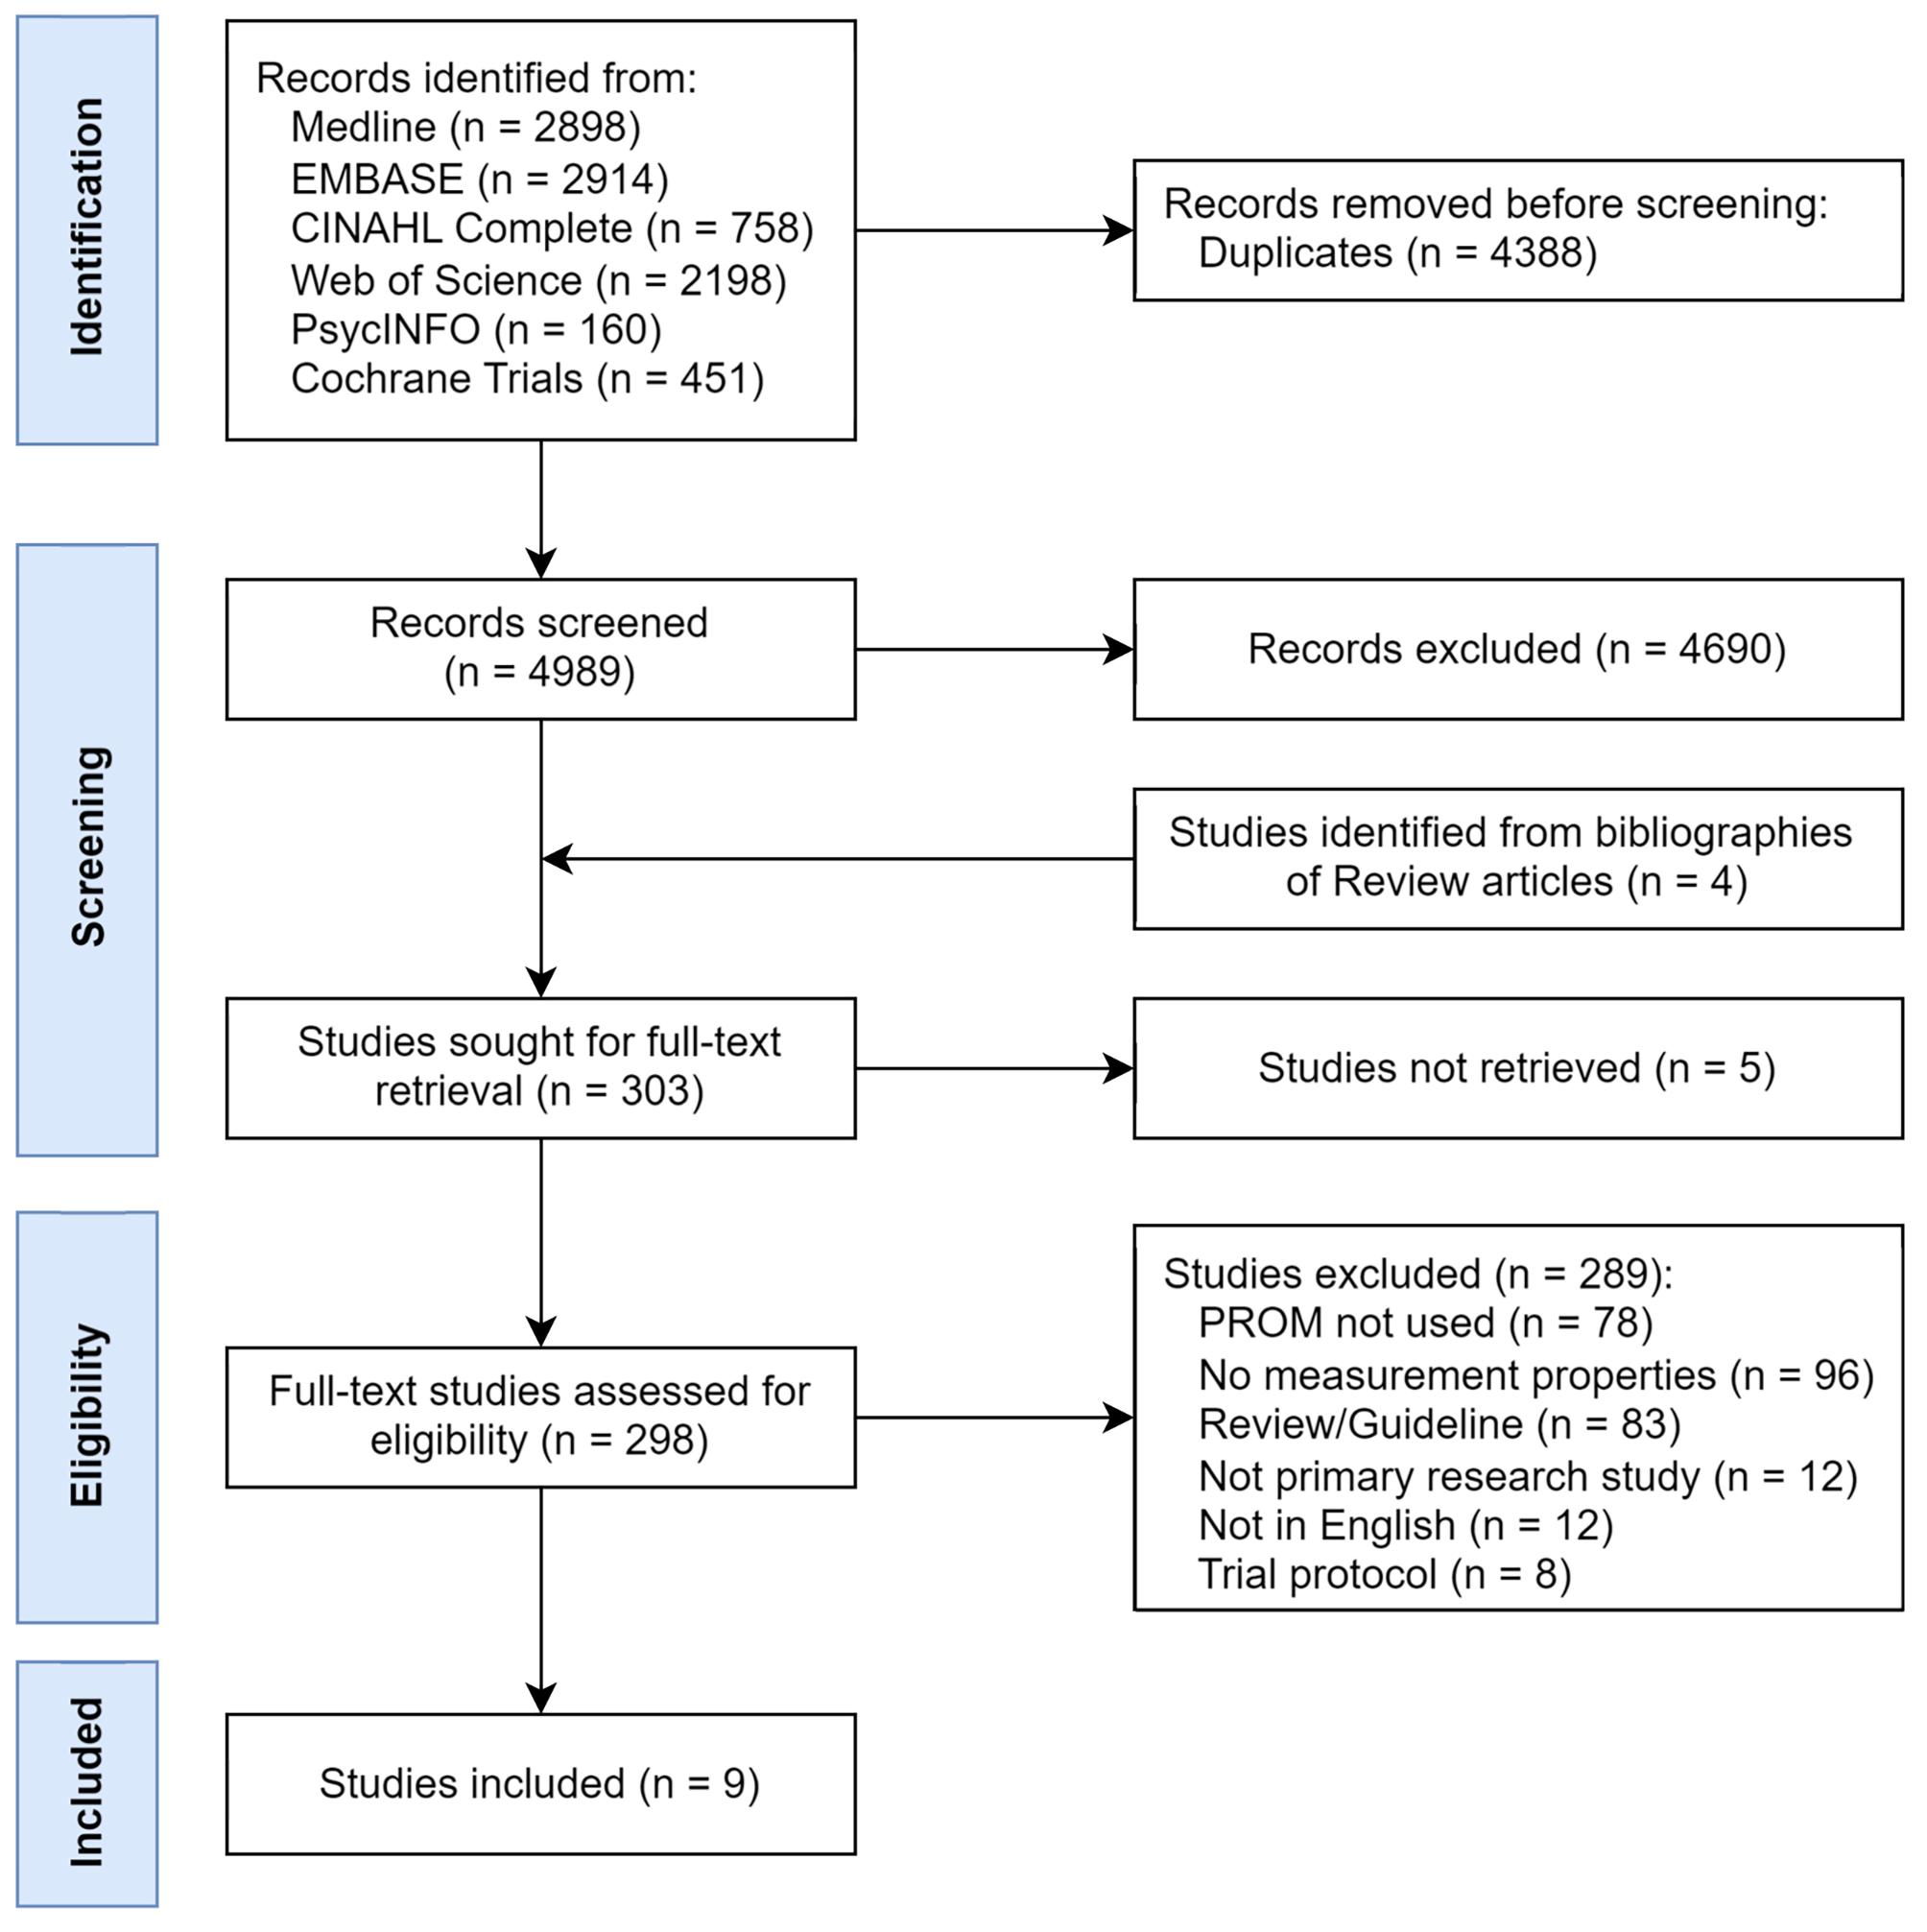
The flow of participants through the MOPED study is shown in Fig 1. Characteristics of participants (n=313 carers) are shown in Table 1.
Fig. 1
Flow of the participants through the study.
Abbreviations: JDR (Join Dementia Research); NHS (the National Health Service). Notes: n/a (information was not available)
Table 1 Sample CharacteristicsThe distribution of responses as well as overall scores for the ASCOT-Proxy (both perspectives) and ASCOT-Carer are shown in Tables 2 and 3.
Table 2 Distribution of responses for the ASCOT Proxy: both perspectives (n=313)Table 3 Distribution of responses for the ASCOT Carer (n=313)FeasibilityOverall, the percentage of missing values was low for the ASCOT-Proxy (both perspectives) ranging from 0% to 1.92% (Table 2). The dignity item had a higher percentage of missing data (Proxy-proxy: ‘My opinion: What I think’: 6.71%; proxy-person: ‘What I think the person I represent thinks’: 7.03% of missing data). The overall ASCOT-Proxy-proxy score could be calculated for 90.7% of our sample while the overall ASCOT-Proxy-person score could be calculated for 88.8% of our sample. Immediate form of one-sample test of proportion confirmed that there was no significant difference (p= 0.258) in the proportion of missing data between the ASCOT-Proxy-proxy (29/313) and ASCOT-Proxy-person (35/313) overall scores. This indicates that both ASCOT-Proxy perspectives have similar feasibility for unpaid carers of people living with dementia.
We explored whether the feasibility of the ASCOT-Proxy perspectives differ based on mode of administration (paper version versus online) using the immediate form of two-sample test of proportions to compare the proportion of missing data for the ASCOT-Proxy scores by mode of administration. For the ASCOT-Proxy-proxy perspective, the proportion of missing data was significantly (p<0.001) higher for participants who used paper questionnaires (missing: 13/63) when compared to those using online version (missing: 16/250). For the ASCOT-Proxy-person perspective, the proportion of missing data was also significantly (p<0.001) higher for participants who used paper questionnaires (missing: 17/63) when compared to those using online version (missing: 18/250).
Regarding the ASCOT-Carer, all but one item (personal safety; 0.32% of missing data) had no missing data indicating a good feasibility (Table 3). We were able to calculate the ASCOT-Carer overall score for 99.7% of our sample. As only one observation was missing for the ASCOT-Carer overall score, we did not explore the role of administration mode in acceptability of the ASCOT-Carer.
Factor structure of ASCOT-Proxy perspectivesAs the ASCOT-Proxy has Likert-type items which yield ordinal data, we undertook several steps when examining structural characteristics of the ASCOT-Proxy (both perspectives) as recommended by Gugiu et al. [33]. First, based on the results from Horn’s parallel analysis (principal component analysis as a factor estimation type, 5000 iterations, using 95th percentile for randomly generated eigenvalues, similarly as in a previous study [34]), we retained two factors for the ASCOT-Proxy-proxy (Fig. 2). To inform our decision regarding the number of factors to retain, we compared the observed principal component eigenvalues with the 95th percentile eigenvalues (random) from the simulated datasets. We retained those factors where observed eigenvalues exceeded the eigenvalues generated by random.
Fig. 2
Parallel analysis of the ASCOT-Proxy-proxy.
Note: Plot of actual principal component eigenvalues versus randomly generated 95th percentile eigenvalues
Then, we performed maximum likelihood exploratory factor analysis on the polychoric correlation matrix (ordinal exploratory factor analysis). In case of the ASCOT-Proxy-proxy we specified to retain two factors and applied oblique rotation (promax) to allow for the factors to be correlated. Next, we verified that the suggested solution from the parallel analysis, supported the stability and interpretability of the factors structure. We checked whether any items had low factor loadings (<.4) on all the factors, or salient loadings (>.5) on two factors [33]. Based on this (see Table 4) we retained two factor solution in case of the ASCOT-Proxy-proxy. These two factors can represent (1) basic domains (items) that relate to basic care needs/support to sustain life and health (food and drink, accommodation cleanliness and comfort, personal cleanliness and comfort, personal safety) and 2) higher order domains (items) that relate to aspects beyond basic care needs and/or relate to a person’s sense of self and identity (social participation and involvement, occupation, control over daily life) [10]. While we consider our findings from parallel analysis robust (the real eigenvalue line for two factors is above the 95th percentile eigenvalue for the simulated data), it is the first time when the results indicate that one of the ASCOT tools has different structure than other ASCOT tools. For example, the original ASCOT-SCT4 [10] has a weak unidimensional one-factor structure which was also confirmed for other adapted version, e.g. easy-read ASCOT [13] and the translation of ASCOT into Finnish [35].
Table 4 Rotated factor loadings and unique variances for the ASCOT-Proxy-proxyIn case of the ASCOT-Proxy-person, the suggested solution from the parallel analysis was to retain one factor (Fig. 3). However, given the close proximity between the random eigenvalue line and the observed eigenvalues for two factors, the result from the parallel analysis suggests that in a different sample, one may potentially find a two factor solution. Therefore, we ran maximum likelihood exploratory factor analysis on the polychoric correlation matrix (ordinal exploratory factor analysis) and specified to retain one factor and then two factors (oblique rotation - promax). Next, we checked whether any items had low factor loadings (<.4) on all the factors, or salient loadings (>.5) on two factors [33]. As one factor solution better supported the stability and interpretability of the factor structure, we conclude that the ASCOT-Proxy-person has a weak unidimensional (one-factor) structure (Table 5).
Fig. 3
Parallel analysis of the ASCOT-Proxy-person.
Note: Plot of actual principal component eigenvalues versus randomly generated 95th percentile eigenvalues
Table 5 Factor loadings and unique variances for the ASCOT-Proxy-person: comparison of one factor solution vs two-factor solutionRasch analysis (the category probability curves; see below) suggested that the lowest two (high-level of unmet needs, some needs) and highest two categories (no needs, ideal state) should be combined for food and drink and for control over daily life in case of the ASCOT-Proxy-person. As a result of the Rasch findings, we reran the parallel analysis and exploratory factor analysis using the recoded data. The suggested solution from the parallel analysis was to retain two factors (Fig. 4). Therefore, we ran maximum likelihood exploratory factor analysis on the polychoric correlation matrix (ordinal exploratory factor analysis) and specified to retain two factors (oblique rotation - promax). Next, we checked whether any items had low factor loadings (<.4) on all the factors, or salient loadings (>.5) on two factors [33]. Based on the results (Table 5) two factor solution seemed not to be appropriate. Therefore, we reran the exploratory factor analysis and specified to retain one factor and explored the factor loadings of each domain (item). As one factor solution better supported the stability and interpretability of the factor structure, we conclude that the ASCOT-Proxy-person has a weak unidimensional (one-factor) structure (Table 5).
Fig. 4
Parallel analysis of the ASCOT-Proxy-person with recoded values for food and drink and control over daily life.
Note: Plot of actual principal component eigenvalues versus randomly generated 95th percentile eigenvalues
In addition, it is important to highlight that the dignity domain (item) had low factor loadings (<.4) in the ASCOT-Proxy (both perspectives) (Tables 4 and 5). This may indicate that the dignity domain (item) should be dropped from further analysis. However, as highlighted by Gugiu et al. [33], this may be not always the case, e.g. researchers may consider to keep the item if dropping it compromises the content validity of the instrument. The strongest evidence to support the decision whether dropping the item would compromise the content validity comes from qualitative concept elicitations studies. In the ASCOT-SCT4 [10] and therefore ASCOT-Proxy, dignity is defined as ‘the negative and positive psychological impact of support and care on the service user’s personal sense of significance’. It has been identified as an important aspect of SCRQoL based on reviewing previous literature about measures of SCRQoL, as well as a series of qualitative studies with service users [10]. As the ASCOT-Proxy is an adapted version of the ASCOT-SCT4, the dignity domain (item) was considered for inclusion in the development studies of the ASCOT-Proxy [20, 21]. In the early development study of the ASCOT-Proxy, the participants (n=35 unpaid carers, n=8 care workers) described having greater difficulty answering those ASCOT questions by proxy that related to abstract concepts (e.g. dignity, occupation, control over daily life) than concrete concepts (e.g. food and drink) [20]. This issue was then further explored with 25 unpaid carers and care workers in three iterative rounds of cognitive interviews [21]. Overall, 22/25 participants correctly interpreted the dignity item and 18/25 found the item (in the draft version presented) to be acceptable. The following concerns over acceptability were raised: care staff (as proxies) may not respond accurately, as it may reflect badly on them (n=1), it was difficult for the respondent to imagine the person’s perspective on dignity due to condition-specific considerations (e.g., perceived lack of self-awareness) (n=3), the person did not currently receive paid help (i.e. it was not applicable) (n=2) or another unspecified reason (n=1). These may be mitigated by focussing on unpaid carers as proxies and also limiting the sample to those receiving care, as in this study. Given the fact that dignity is an important aspect of SCRQoL as established in the ASCOT-SCT4 [10] and was found acceptable in the development study for the ASCOT-Proxy [21], in this study, we retained it in further analysis. However, it is important that researchers report structural characteristics of the ASCOT-Proxy in the future studies. If the present finding is replicated, it may be necessary to revisit whether dignity should be included as an important aspect of SCRQoL of social care users when the answers are provided by proxy (e.g. through qualitative concept studies with unpaid carers as proxy respondents).
As the results from factor structure analysis inform Rasch analysis, reliability and construct validity analysis, these were only conducted with the ASCOT-Proxy-person in this study. We decided not to proceed with these analysis for the ASCOT-Proxy-proxy as whether and how the ASCOT-Proxy-proxy tool should be used when having two factor solution have to be considered carefully.
The one factor structure of the ASCOT-Carer using the same data as this study has been established elsewhere and is not included in this paper [26].
Rasch analysis: Overall model fitFor the full description of Rasch analysis please see Additional File 2. We assessed model fit using the information-weighted mean square (INFIT MNSQ), outlier-sensitive mean square (OUTFIT MNSQ) statistics and point-measure correlation. Similarly as in another study [36], we considered values of INFIT and OUTFIT MNSQ statistics in the range of .5 to 1.5 as satisfactory [37]. The INFIT MNSQ and OUTFIT MNSQ statistics for the ASCOT-Proxy-person and ASCOT-Carer are shown in Table 6 and Table 7. All items were in the acceptable INFIT MNSQ and OUTFIT MNSQ range of .5 to 1.5 and consisted of positive item-Rasch measure correlations, except for the ASCOT-Carer personal safety (OUTFIT MNSQ=2.27). This indicates there may be an issue with the item, indicating that the item should be dropped. As this is the first study to use Rasch analysis when exploring psychometric properties of the ASCOT-Carer in unpaid carers, it is important that future studies using the ASCOT-Carer explore this further in their analysis.
Table 6 Item statistics including difficulty (in logits), infit and outfit mean square and point-measure correlations for the ASCOT-Proxy-personTable 7 Item statistics including difficulty (in logits), infit and outfit mean square and point-measure correlations for the ASCOT-CarerIn this study, we kept the item in further analysis, as the item relates to an aspect of SCRQoL that has been identified as important to unpaid carers in previous research and is part of the ASCOT-Carer measure that has been widely used.
Rasch analysis: Rating scaleAs in another study [36], we evaluated the functionality of the ASCOT-Proxy-person and ASCOT-Carer 4-point rating scales using criteria proposed by Linacre: 1. the occurrence of more than 10 endorsements per response category, 2. the observation that both average measures and category thresholds increase across each response category, and 3. an observed OUTFIT MNSQ value of less than 2 for each response category [38]. If we observed disordered thresholds or group means or a high OUTFIT MNSQ for a category that had less than 10 respondents, we dismissed the finding (as we did not have enough evidence that subjects were unable to distinguish between the adjacent response categories).
Following domains (items) had observed average disordered in the ASCOT-Proxy-person (Table 8): food and drink; person cleanliness and comfort; and personal safety. In case of the ASCOT-Carer (Table 9), following items had OUTFIT MNSQ higher than two: personal safety; and feeling supported and encouraged.
Table 8 Response category (rating scale) diagnostics based on Linacre’s criteria: the ASCOT-Proxy-personTable 9 Response category (rating scale) diagnostics based on Linacre’s criteria: the ASCOT-CarerRasch analysis: Functionality of the response categoriesWe conducted Rasch analysis (the category probability curves) to examine whether unpaid carers are able to distinguish between the four responses options for each domain (item) (both the ASCOT-Proxy-person and the ASCOT-Carer). The category response curves indicated disordered thresholds for food and drink and control over daily life for the ASCOT-Proxy-person (Fig. 5). The lowest two (high-level of unmet needs, some needs) and highest two categories (no unmet needs, ideal state) were combined for food and drink. Similarly, the lowest two (high-level of unmet needs, some needs) categories and highest two categories (no unmet needs, ideal state) were combined for control over daily life (Fig. 6).
Fig. 5
Category response curve for the ASCOT-Proxy-person.
Note: Red: high-level of unmet needs; Blue: some unmet needs; Purple: no unmet needs; Black: ideal state
Fig. 6
Category response curve for the ASCOT-Proxy-person: collapsed categories.
Note: Red: high-level of unmet needs; Blue: some unmet needs; Purple: no unmet needs; Black: ideal state. In case of food and drink and control over daily life: Red: high-level of unmet needs and some unmet needs; Blue: no unmet needs and ideal state
There were no disordered category thresholds for the ASCOT-Carer (Fig. 7).
Fig. 7
Category response curve for the ASCOT-Carer.
Note: Red: high-level of unmet needs; Blue: some unmet needs; Purple: no unmet needs; Black: ideal state
Wright-Andrich maps: examination of floor and ceiling effectsFigures 8 and 9 present the Wright-Andrich Maps for the ASCOT-Proxy-person (collapsed categories for food and drink and control over daily life) and the ASCOT-Carer respectively. The Wright-Andrich Map plots the person measures along the left side and the item measures for each of the domains (items) along the right side. The M to the left of the centre line stands for the mean of the person logits. The M on the right represents the mean of the domain (item) logits. The S’s and T’s stand for 1 and 2 standard deviations from the means, respectively. From Fig. 8 (ASCOT-Proxy-person) we observed two significant gaps (approximately 1.5 logit) on the latent continuum. We see a lack of alignment between the person and item distributions, which is best characterised as the 1-point logit difference between the means of the items and persons. Similarly as in another study [36] floor and ceiling effects were defined as the existence of persons with logit scores at the bottom or top of the persons distribution (left side of the Wright-Andrich Map) that were at least one logit from the nearest item measure (right side of the Wright-Andrich Map). Specifically, we considered effects to be mild if less than 10% of respondents met this definition, moderate if 10% to 20% met the definition, and severe if more than 20% of respondents met the definition [36]. In case of the ASCOT-Proxy-person (Fig. 8), we detected a mild floor effect, which can be seen by the lack of overlap between persons and items at the top of the figure. Based on the Wright-Andrich Map, the ASCOT-Proxy-person would benefit from either adding new ‘easier’ items (within an existing cognitive framework) measuring slightly different aspects of the same domain or by moderating the intensity of the question using different wording.
Fig. 8
Results of Rasch Analysis, Wright-Andrich Map of the ASCOT-Proxy-person (collapsed categories).
Note: The Measure Scale (-4 to +4) is the logit scale resulting from the Rasch Analysis. Top of the figure represents the floor (high-level of unmet needs coded as 0) while the bottom represents the ceiling (ideal state coded as 3)
food and drink (collapsed; food_2R); accommodation cleanliness and comfort (home_2); personal cleanliness and comfort (pers_2); personal safety (safety_2); social participation and involvement (social_2); control over daily life (collapsed; control_2R); occupation (occ_2); dignity (dignity_2)
Fig. 9
Results of Rasch Analysis, Wright-Andrich Map of the ASCOT-Carer.
Note: The Measure Scale (-6 to +6) is the logit scale resulting from the Rasch Analysis. Top of the figure represents the floor (high-level of unmet needs coded as 0) while the bottom represents the ceiling (ideal state coded as 3)
personal safety (safety_c); social participation and involvement (social_c); control over daily life (control_c); occupation (occ_c); feeling encouraged and supported (support_c); space and time to be yourself (time_c); self-care (selfcare_c)
From Fig. 9 (the ASCOT-Carer) we observed one significant gap (approximately more than 1 logit) on the latent continuum. We see that the two distributions are roughly aligned, (approximately less than .5 logit difference), as demonstrated by the proximity of the average person measure to the average item measure. In case of the ASCOT-Carer (Fig. 9) we detected a mild floor effect, which can be seen by the lack of overlap between persons and items at the top of the figure. Based on the Wright-Andrich Map, the ASCOT-Carer would benefit from either adding new ‘easier’ items (within an existing cognitive framework) measuring slightly different aspects of the same domain or by moderating the intensity of the question using different wording.’
Rasch analysis: Differential Item FunctioningLastly, we performed a Rasch differential item functioning (DIF) test to see if respondents conceptualised items differently based on the mode of administration (postal versus online). In the analysis of uniform DIF by survey administration, the Mantel-Haenszel statistic, adjusted for multiple comparisons (p<0.007), indicated DIF for two items from the ASCOT-Carer: occupation (χ2=12.33, p=0.0004) and feeling encouraged and supported (χ2=14.33, p=0.0002). This indicates that these two items respond differently, by survey administration group. For occupation, the DIF measure was 1.71 (DIF S.E. =0.30) for those who completed the survey via postal return and 0.87 (DIF S.E. = 0.14) for those who completed the survey online (DIF contrast=0.84, joint S.E. =0.33). For feeling encouraged and supported, the DIF measure was -0.47 (DIF S.E. =0.22) for those who completed the survey via postal return and 0.61 (DIF S.E. = 0.11) for those who completed the survey online (DIF contrast=-1.08, joint S.E. =0.25).
To better understand why respondents conceptualised items differently based on the mode of administration (postal versus online), we have explored whether the two samples (postal and online survey) differed in sociodemographic characteristics: age, gender and ethnicity. We identified that those who filled in postal version were older than those who filled in online version (mean age: 70.63 versus 60.38 years). Therefore, we performed a Rasch DIF test to see if respondents conceptualised items differently based on their age (under 65 years old versus 65 years or over). In the analysis of uniform DIF by age, the Mantel-Haenszel statistic, adjusted for multiple comparisons (p<0.007), indicated DIF for two items from the ASCOT-Carer: occupation (χ2=13.53, p=0.0002) and feeling supported and encouraged (χ2=12.73, p=0.0004). For the occupation, the DIF measure was 0.72 (DIF S.E. =0.16) for those who were under 65 years old and 1.44 (DIF S.E. =0.20) for those 65 years or over (DIF contrast=-0.72, joint S.E.=0.25). For feeling encouraged and supported, the DIF measure was 0.77 (DIF S.E. =0.13) for those who were under 65 years old and -0.06 (DIF S.E. =0.15) for those 65 years or over (DIF contrast=0.83, joint S.E.=0.20).
There was no evidence of DIF by survey administration or age for the ASCOT-Proxy-person (p>.006).
Reliability/Internal consistencyThe Cronbach’s alpha was 0.69 for the ASCOT-Proxy-person; and 0.83 for the ASCOT-Carer. The ordinal alpha was 0.78 for the ASCOT-Proxy-person; and 0.87 for the ASCOT-Carer, which meets the .70 reliability standard [39].
Construct validityTable 1 in Additional File 2 provides an overview of the hypotheses used in this study for assessing construct validity. Table 10 shows Spearman correlation coefficients between the ASCOT-Proxy-person, ASCOT-Carer overall scores (continuous variables) and related constructs (continuous variables). The majority of the Spearman’s rank correlations (>75%) between the ASCOT-Proxy-person, ASCOT-Carer and other variables were same as hypothesised. There were few exceptions to this. The correlations between ASCOT-Proxy-person overall scores and DEMQOL-Proxy-proxy were weaker than expected but stronger with I/ADLs (Proxy-proxy) than expected.
Table 10 Convergent validity of the ASCOT-Proxy-person and ASCOT-CarerTable 11 displays the associations between the ASCOT-Proxy-person, ASCOT-Carer overall scores and various subgroups of the sample. Both measures detected differences between their scores and various subgroups as hypothesised.
Table 11 Known-groups validity of the ASCOT-Proxy perspectives and ASCOT-Carer
留言 (0)