
記住我
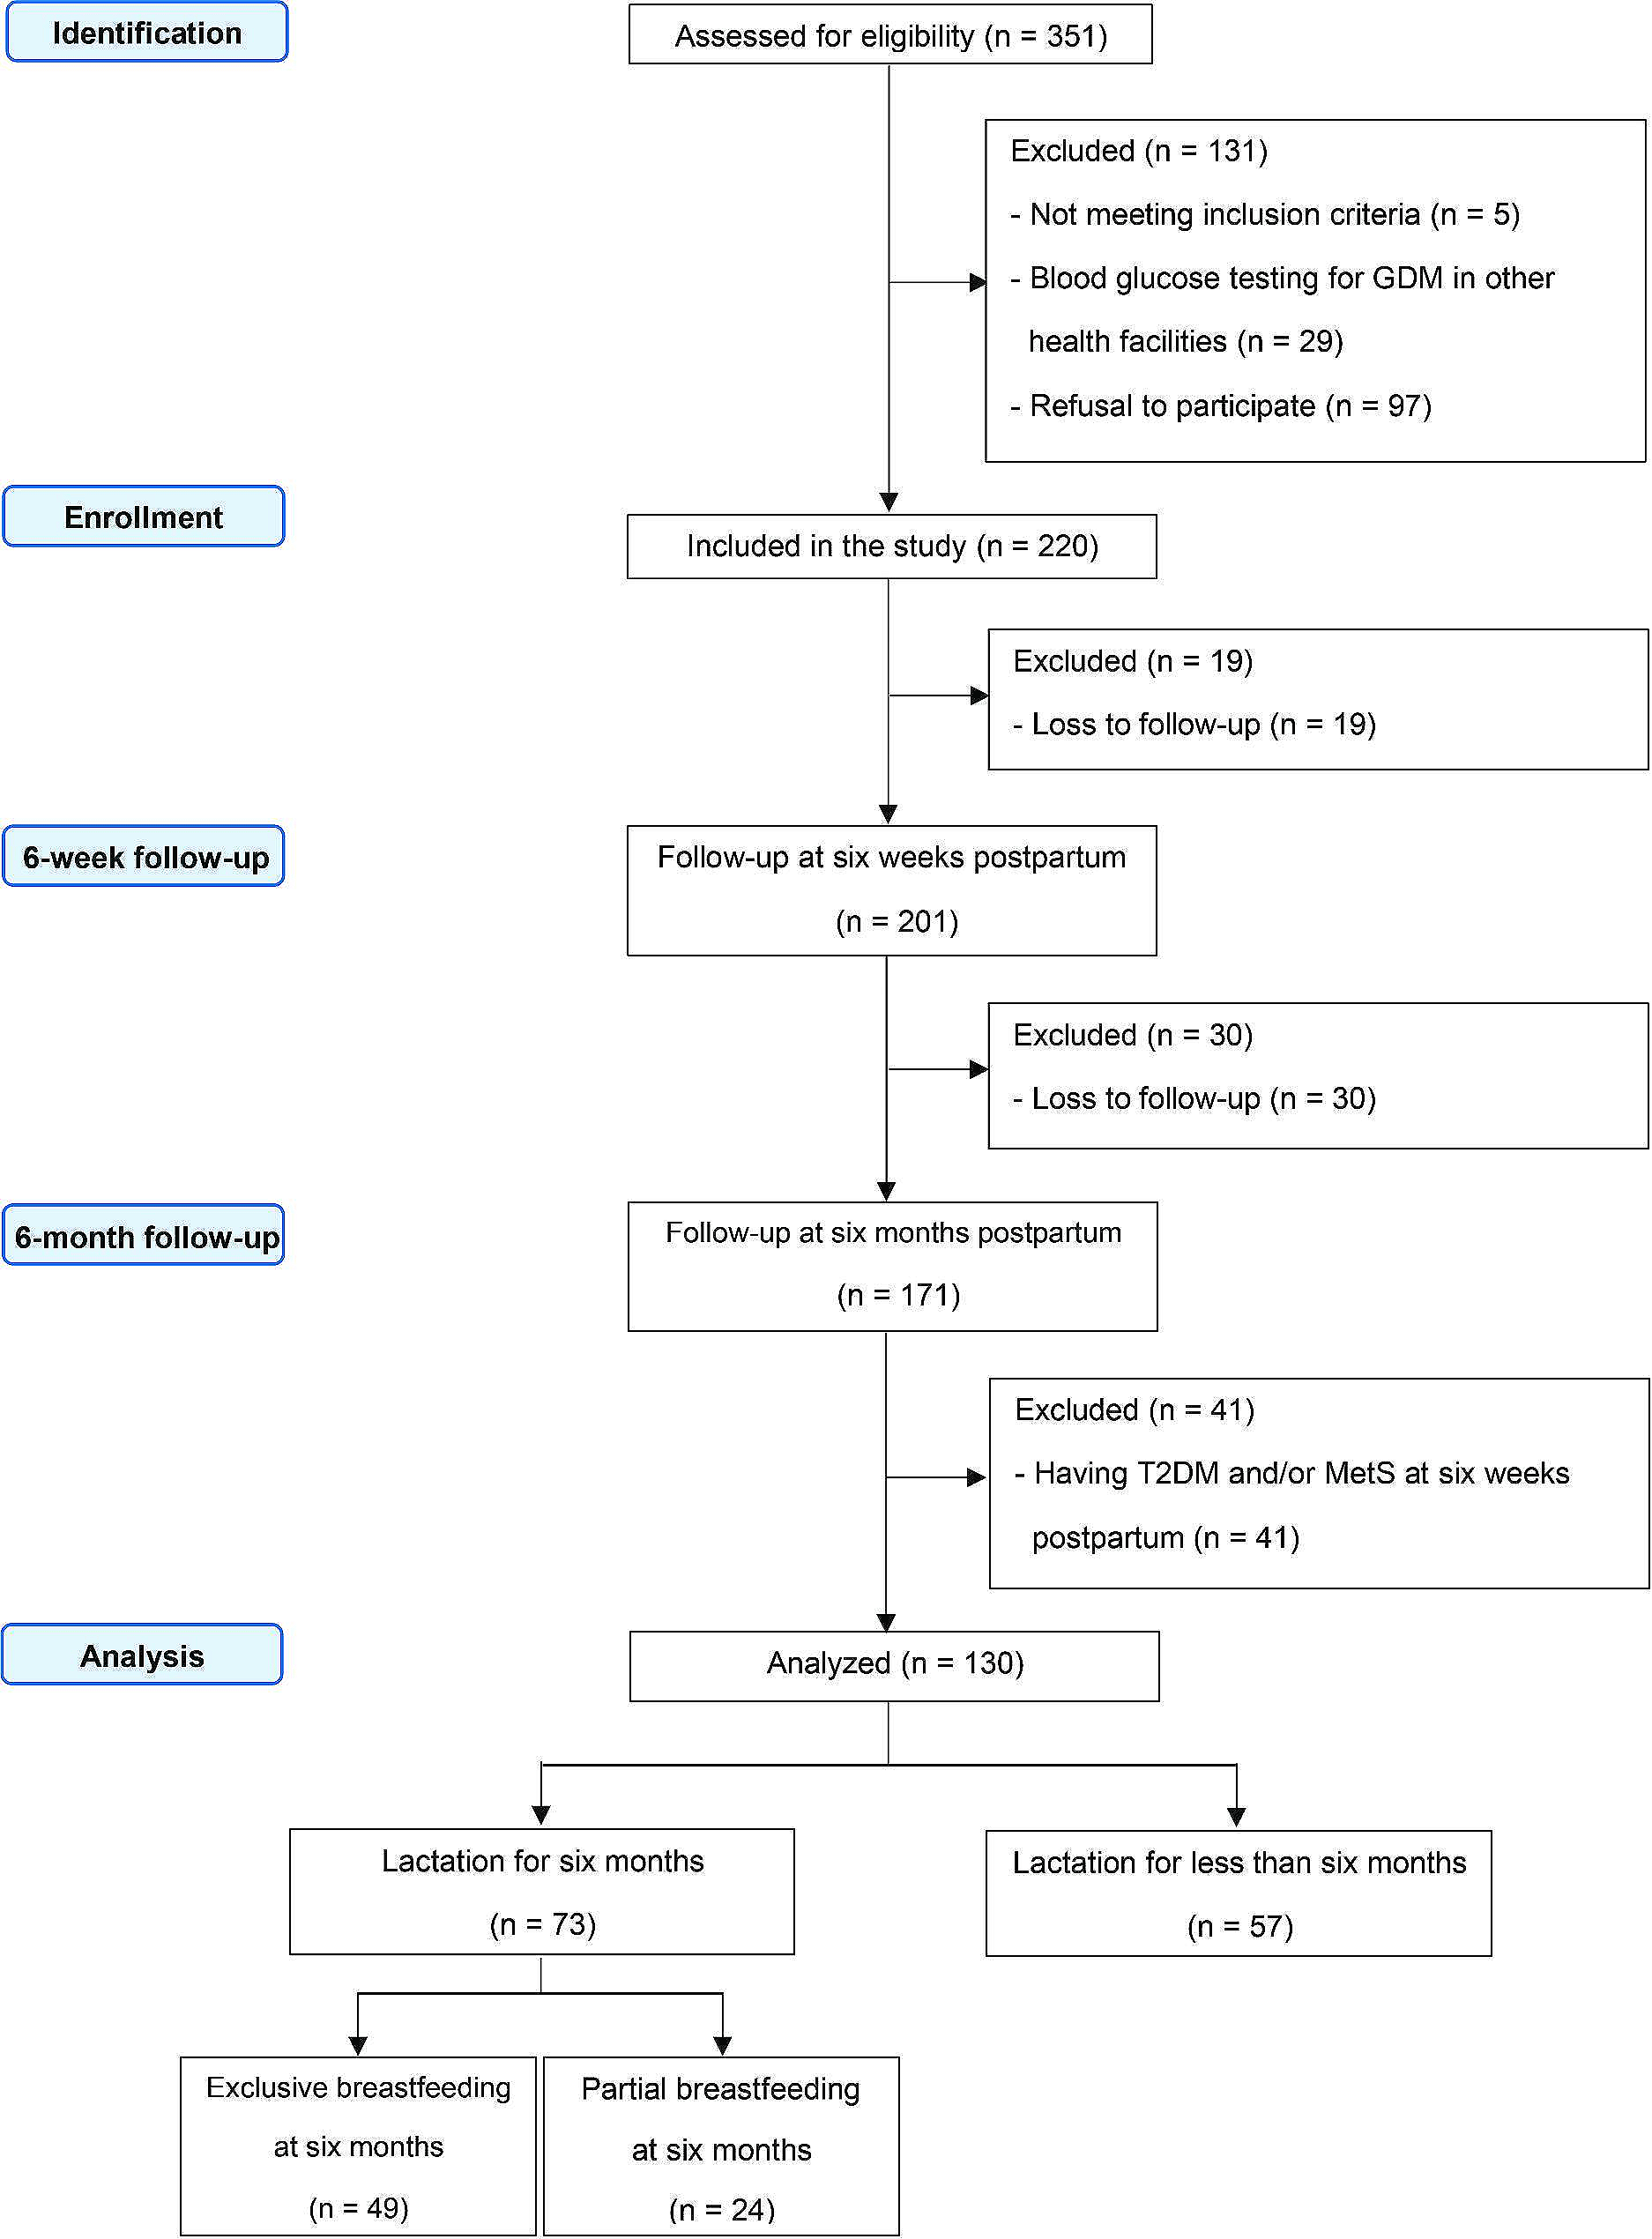
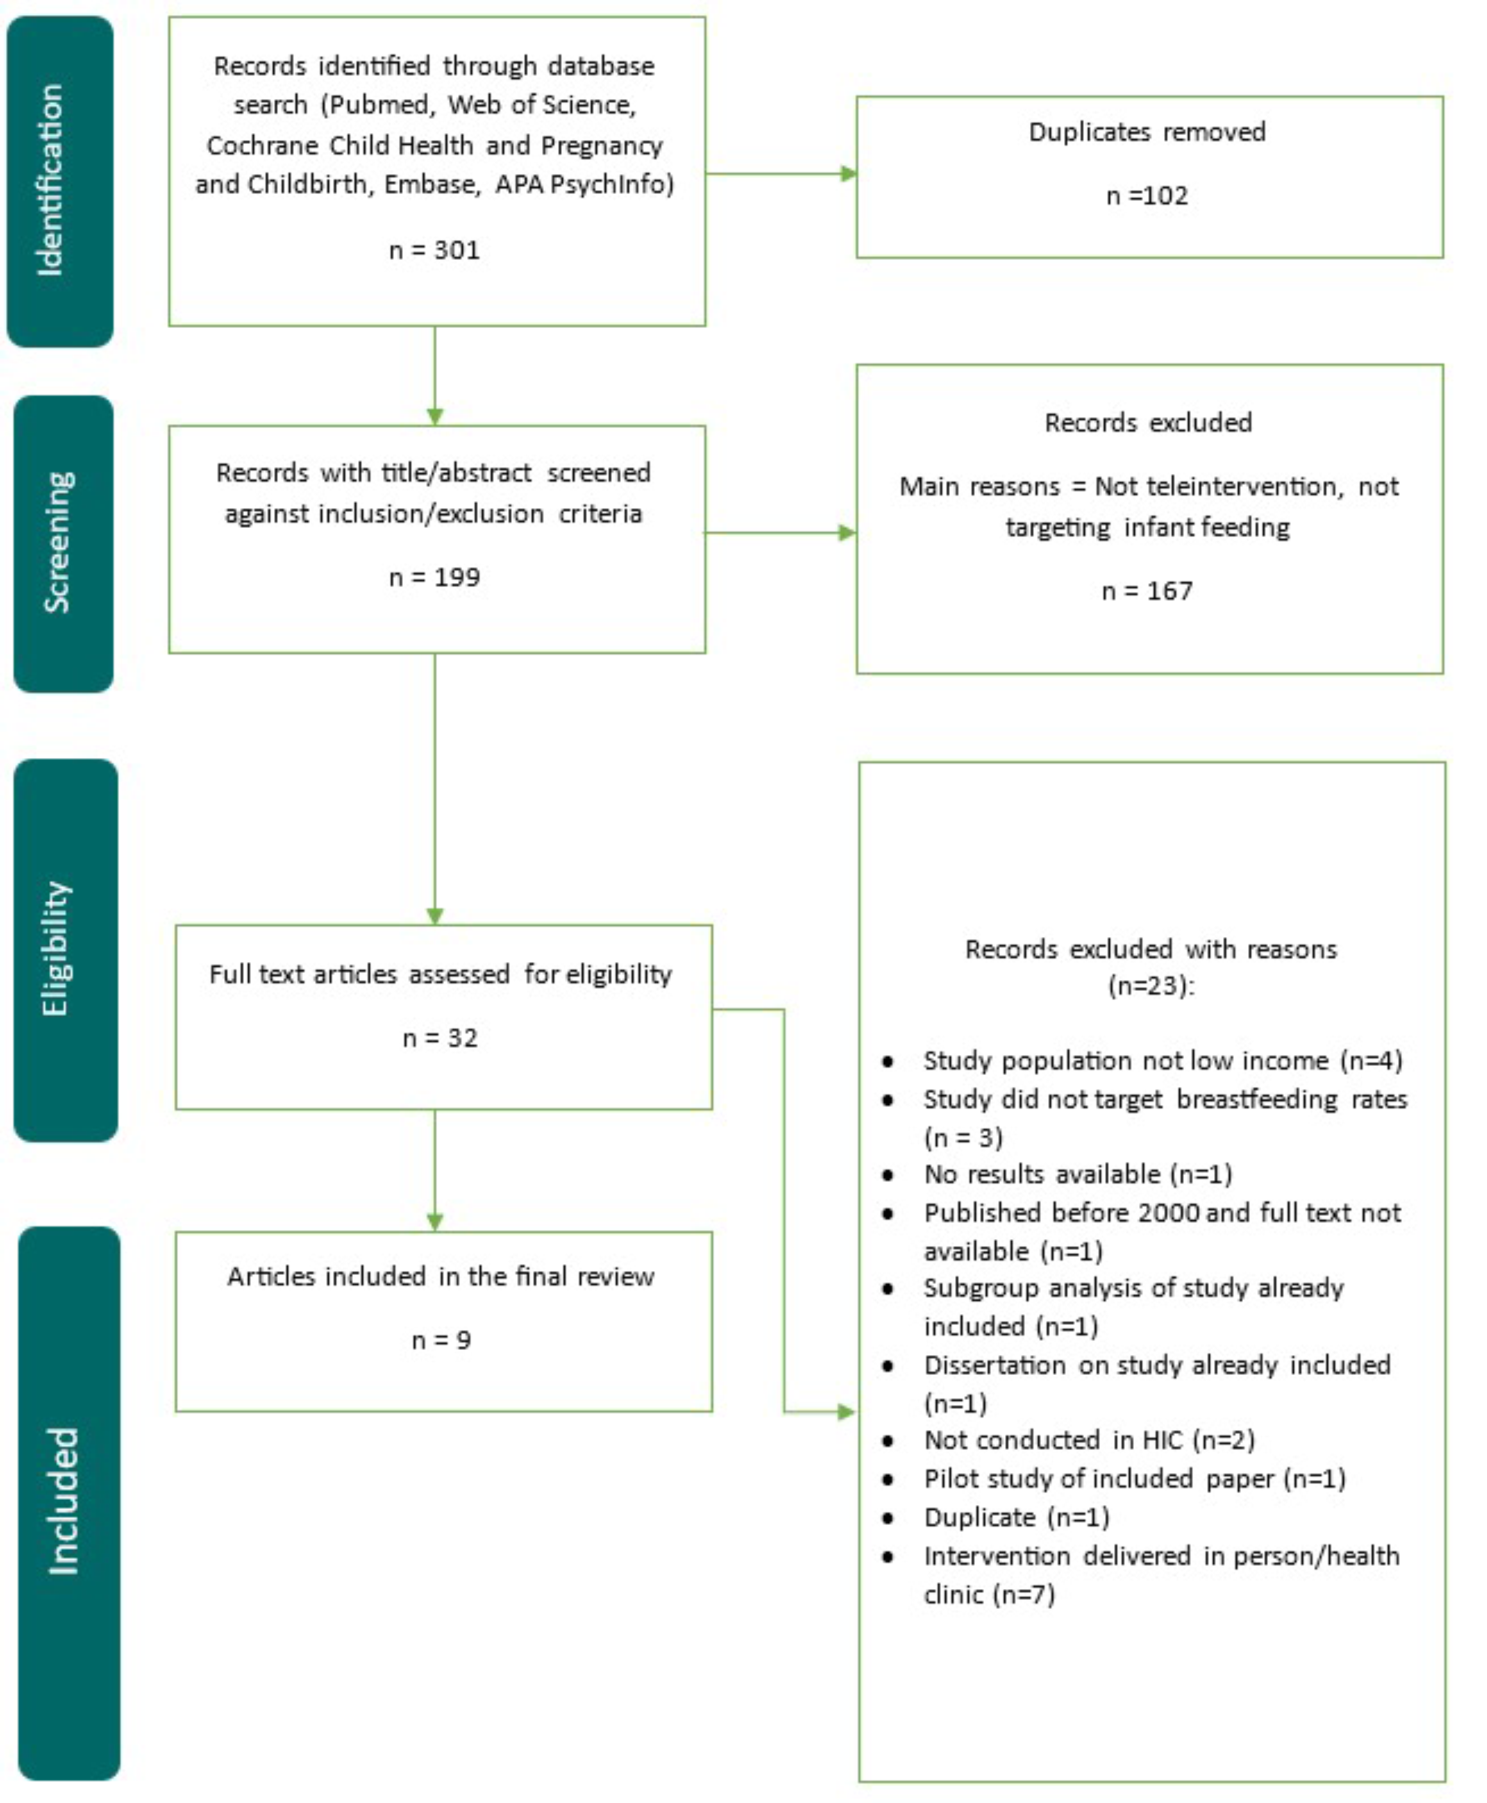
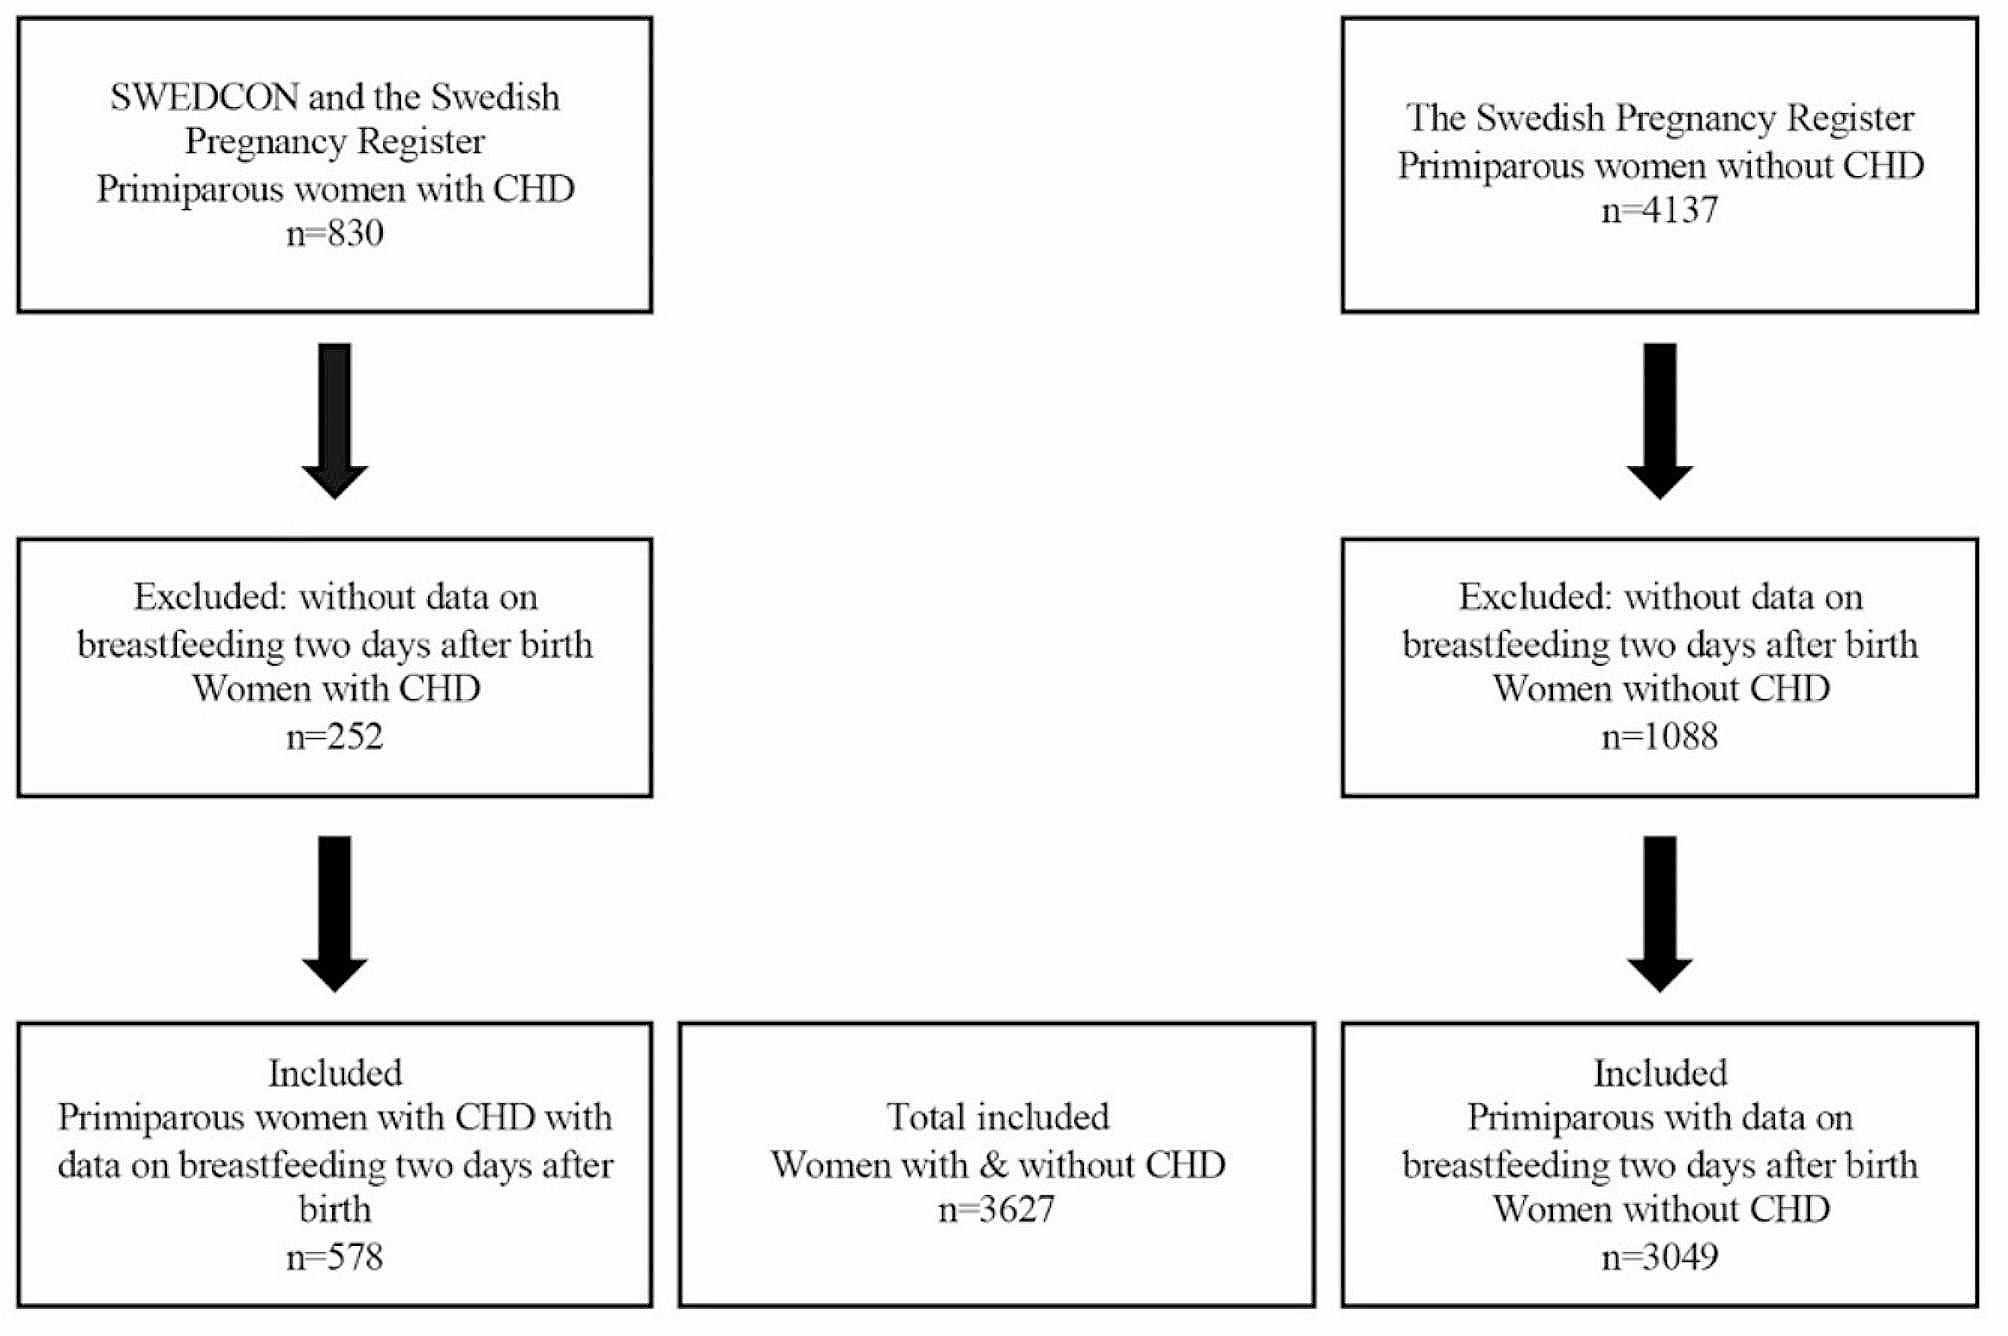

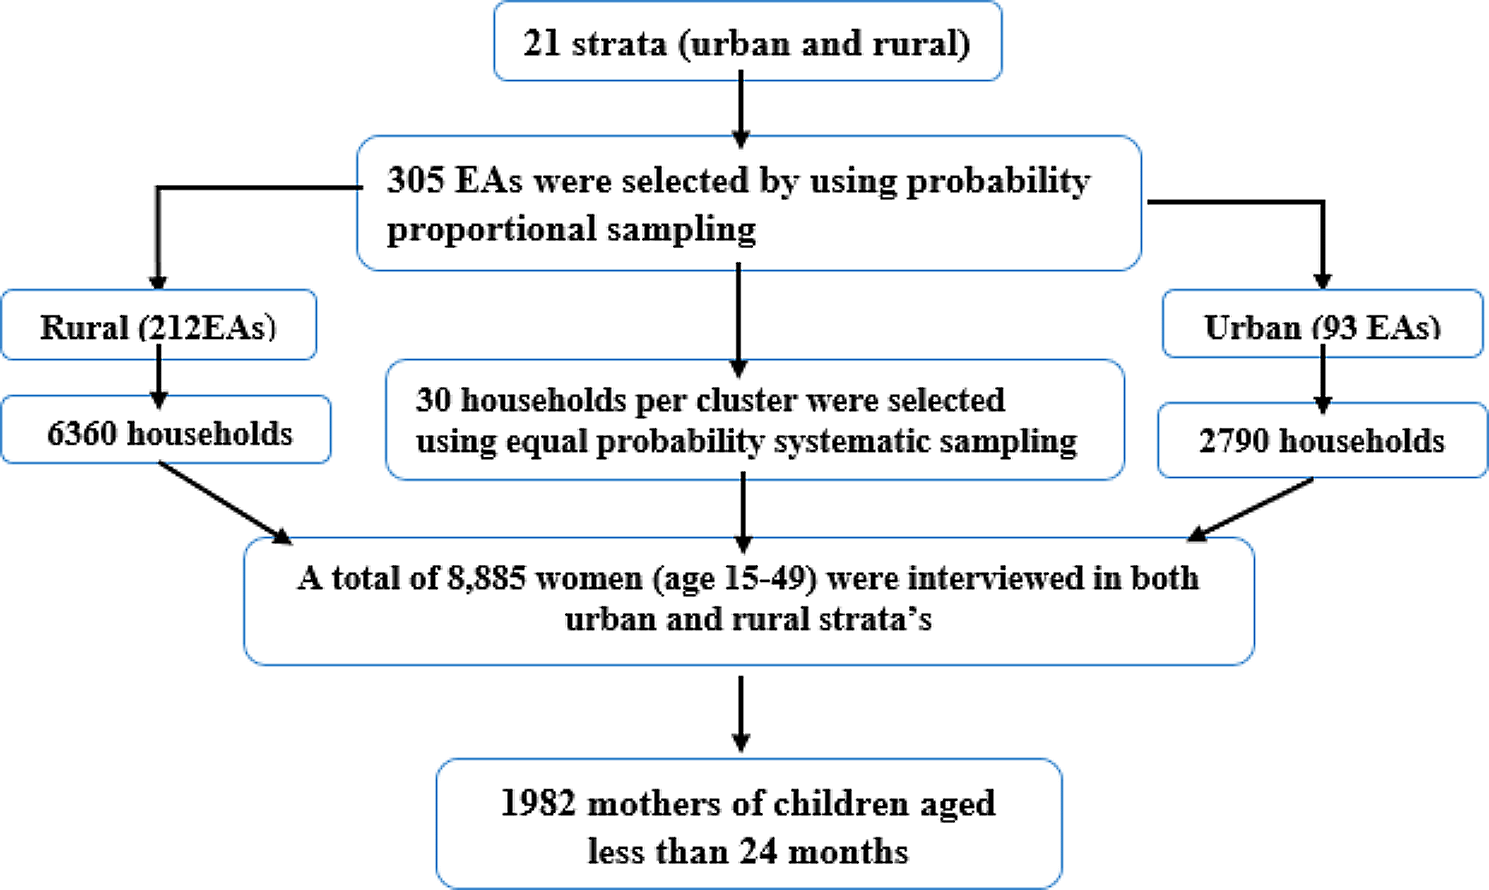
From 7,881 records identified, a total of 507 records, representing 154 studies on calcium, 242 on zinc, and 43 on vitamin D, were included (see Fig. 1).
Fig. 1
Study selection flowchart
CalciumA total of 154 studies with 22,307 participants reporting on calcium concentration of breast milk were included. The detailed characteristics of the studies included are shown in Additional File 2. Among those studies, 76 were cross-sectional studies, 62 were cohorts, 8 were trials and 8 were case-control studies. The studies were conducted in Asia (N = 47), North America (N = 37), Europe (N = 33), South America (N = 22), Africa (N = 19) and Australasia/Oceania (N = 6). The countries in which the studies were the most conducted were the United States (N = 29), China (N = 18), and Brazil (N = 15). Studies were published between 1965 and 2022, with 25% published before 1988 and 25% published after 2014. Most of the studies included healthy participants (N = 83), but many did not report the health status of their participants (N = 63). Eight studies included both healthy and unhealthy participants. The health conditions included were in the mother, anemia (N = 1), COVID-19 (N = 1), diabetes type 1 (N = 1), gestosis (N = 1), mastitis (N = 2), and in the infant, small-for-gestational-age (N = 1) and rickets (N = 1). Most of the studies did not report the nutritional status of the mothers included (N = 134), a few reported good nutritional status (N = 12), poor nutritional status (N = 3) or both (N = 5). The analytical methods the most used to determine calcium in breast milk were atomic absorption spectroscopy (AAS) (N = 54), inductively coupled plasma mass spectrometry (ICP-MS) (N = 27), inductively coupled plasma atomic emission spectroscopy (ICP-AES) (N = 25), and flame atomic absorption spectroscopy (FAAS) (N = 17). The preferred method to measure calcium in breast milk is ICP-MS [14].
The results of the meta-analyses are shown in Table 1. The mean calcium concentration of breast milk was 261 mg/L (95% CI: 238, 284, range: 2, 686). One outlier with a very low value was identified, possibly due to the analytical method used. When removing this outlier, the mean calcium concentration was 262 mg/L (95% CI: 243, 282, range: 14, 686). When restricting the analysis to ‘key’ studies (i.e. studies with healthy women, healthy term infants, exclusively breastfed up to 6 months old), the mean calcium concentration was 249 mg/L (95% CI: 232, 266).
Table 1 Meta-analyses for calcium concentration (mg/L)Calcium concentration in breast milk changed with the infant’s age (see Table 1). The evolution of calcium concentration in breast milk over time is shown in Fig. 2. Calcium concentration was almost constant over time, with a very slow decrease. The evolution of calcium concentration over time was best modeled with a linear model. When including all studies across all ages, the calcium concentration [mg/L] at a certain timepoint could be estimated with the equation: 282.4357 – 0.2331 ✕ days. When restricting to ‘key’ studies, calcium concentration could be estimated with the equation: 276.7831 – 0.2169 ✕ days. When restricting to studies among 0-5.9 month-olds, the model was 285.5756 – 0.2554 ✕ days and, when restricting to ‘key’ studies and among 0-5.9 month-olds, 333.8875 – 0.7367 ✕ days.
Fig. 2
Calcium concentration (mg/L) over time, trendline (blue) fitted with local polynomial regression
There were no significant differences in calcium concentration between lactation stages, adolescent and adult mothers, preterm and term infants, exclusive and mixed breastfeeding, with or without calcium supplementation, between nutritional statuses, country income categories, continents, and measurement methods (see Table 1). However, women with conditions tended to have lower calcium breast milk concentrations than healthy women (women with conditions 203 mg/L, 95% CI: 171, 234, healthy women 257 mg/L, 95% CI: 232, 281, p = 0.008). Calcium concentration in breast milk did not differ significantly over the years of publication (p = 0.961).
The effect of maternal calcium intake on breast milk concentrations was further investigated. Two randomized controlled trials [15, 16] investigated the effect of calcium supplementation on calcium concentration in milk. When meta-analyzed, no significant differences were found between groups of calcium supplementation (mean difference (MD): 4.8 mg/L, 95% CI: -4.4, 14.1). One cohort study [17] compared women with different calcium intake levels and found no differences in calcium concentration in transitional milk, but a higher calcium concentration in women with higher calcium intakes in mature milk (p < 0.05). A cross-sectional study [18] found no differences between calcium intake groups and calcium concentration in mature breast milk.
ZincA total of 242 studies with 37,614 participants reporting on zinc concentration of breast milk were included. The detailed characteristics of the studies included are shown in Additional File 3. Among those studies, 125 were cross-sectional studies, 92 were cohorts, 17 were trials and 8 were case-control studies. The studies were conducted in Asia (N = 84), Europe (N = 54), North America (N = 46), South America (N = 32), Africa (N = 32) and Australasia/Oceania (N = 5). The countries in which the studies were the most conducted were the United States (N = 37), Brazil (N = 24), and China (N = 22). Studies were published between 1971 and 2022, with 25% published before 1990 and 25% published after 2013. Most of the studies included healthy participants (N = 131), but many did not report the health status of their participants (N = 103). Eight studies included both healthy and unhealthy participants. The health conditions included were in the mother, acute febrile infection (N = 1), anemia (N = 1), diabetes type 1 (N = 1), HIV (N = 2), mastitis (N = 2), and in the infant, jaundice or intra-uterine growth restriction (N = 1). Most of the studies did not report the nutritional status of the mothers included (N = 206), a few reported good nutritional status (N = 24), poor nutritional status (N = 6) or both (N = 6). The analytical methods the most used to determine zinc in breast milk were AAS (N = 92), ICP-MS (N = 52), FAAS (N = 51), and ICP-AES (N = 35). The preferred methods to measure zinc in breast milk are AAS, ICP-AES, and ICP-MS [14, 19].
The results of the meta-analyses are shown in Table 2. The mean zinc concentration of breast milk was 2.57 mg/L (95% CI: 2.50, 2.65, range: 0.03–69.07). Three outliers and influential studies were identified, possibly due to errors in reported units. When removing them, the mean zinc concentration was not significantly different, with 2.58 mg/L (95% CI: 2.49, 2.67, range: 0.05–12.9). When restricting the analysis to ‘key’ studies (i.e. studies with healthy women, healthy term infants, exclusively breastfed up to 6 months old), the mean zinc concentration was 2.26 mg/L (95% CI: 2.00, 2.51).
Table 2 Meta-analyses for zinc concentration (mg/L)There were significant differences between lactation stages (see Table 2). The evolution of zinc concentration in breast milk over time is shown in Fig. 3. Zinc concentration starts high and then decreases rapidly until reaching a plateau. The evolution of zinc concentration over time was best modeled with a logarithmic model. When including all studies across all ages, the zinc concentration [mg/L] at a certain timepoint could be estimated with the equation: 5.9514 + 0.0005 ✕ days – 2.0266 ✕ log(days). When restricting to ‘key’ studies across all ages, the fitted model was 8.4457 + 0.0031 ✕ days – 3.4048 ✕ log(days). When restricting to studies conducted among 0-5.9 month-olds, the model was 5.7859 – 0.0001 ✕ days – 1.9218 ✕ log(days) and, when restricting to ‘key’ studies and among 0-5.9 month-olds, 9.1174 – 0.0036 ✕ days – 3.8383 ✕ log(days).
Fig. 3
Zinc concentration (mg/L) over time, trendline (blue) fitted with local polynomial regression
There were no significant differences between healthy and unhealthy populations, between mothers of preterm and term infants, and between mothers with good or poor nutritional status. However, there were significant differences between maternal age groups, breastfeeding practices, maternal zinc supplementation, country income categories, continents, and measurement methods. Given the influence of time since birth on zinc concentration, many of the sub-group differences could have been confounded by differences in time since birth. Therefore meta-regressions were conducted with the sub-groups, controlling for the numbers of days since birth. When including time since birth as a covariate, the differences between measurement methods and continents became non-significant. However, the differences between maternal age groups, gestation, breastfeeding practices, nutrition, and country income categories remained: The zinc concentrations were higher in adult mothers, in mothers of preterm infants, in mothers exclusively breastfeeding, in mothers with good nutrition, and in mothers living in upper-middle and high income countries. Zinc concentration in breast milk, controlling for age, did not differ significantly over the years of the publication (p = 0.594).
The effect of maternal zinc intake on breast milk concentrations was further investigated. Nine trials looked at the effect of zinc supplementation on zinc concentration in breast milk. When meta-analyzed, no significant differences were found between levels of zinc supplementation (MD: 0.11, 95% CI: -0.18, 0.40). One cohort study [20] compared women with different zinc intake levels and found no differences in zinc concentration in transitional milk, but a higher concentration in women with higher intakes in mature milk (p < 0.05).
The effect of genetic variations was investigated in two studies [21, 22]. These studies found that variants of the zinc ZnT2 (SLC30A2) were common and could be associated with low zinc concentrations in breast milk.
Vitamin DA total of 43 studies with 3,726 participants reporting on vitamin D concentration of breast milk were included. The detailed characteristics of the studies included are shown in Additional File 4. Among those studies, 19 were cross-sectional studies, 8 were cohorts, 12 were trials and 4 were case-control studies. The studies were conducted in Asia (N = 21), North America (N = 13), Europe (N = 12), Africa (N = 2), and Australasia/Oceania (N = 2). No studies were identified in South America. The countries in which the studies were the most conducted were the United States (N = 11) and Japan (N = 6). Studies were published between 1981 and 2021, with 25% published before 1989 and 25% published after 2017. Most of the studies included healthy participants (N = 24), but many did not report the health status of their participants (N = 15). Four studies included both healthy and unhealthy participants. The health conditions included were in the mother, COVID-19 (N = 1), HIV (N = 1), or long-term hospitalization (N = 1), and in the infant, atopic dermatitis (N = 1). Most of the studies did not report the nutritional status of the mothers included (N = 38), a few reported good nutritional status (N = 4), or both good and poor nutritional status (N = 1). The analytical methods the most used to determine vitamin D concentrations were liquid chromatography with tandem mass spectrometry (LC-MS/MS) (N = 13), high performance liquid chromatography (HPLC) and competitive protein-binding assay (CPBA) (N = 14), HPLC (N = 4), ultra-violet HPLC (UV-HPLC) (N = 3), and radioimmunoassay (RIA) (N = 2). The preferred methods to measured vitamin D in breast milk are HPLC and CPBA or LC- MS/MS [14, 19]. Sixteen studies reported the use of external standards for validation (2 studies participated in a vitamin D standardization program) and 25 studies did not report the use of any external standard.
The concentrations of the different vitamin D forms are shown in Table 3. The mean total ARA of breast milk was 58 IU/L (95% CI: 45, 70). The different forms of vitamin D contributed to total ARA in the following decreasing order: 25OHD3, vitamin D3, 25OHD2 and vitamin D2. Fifteen studies reported undetectable levels of vitamin D in all [23,24,25] or some of the breast milk samples [26,27,28,29,30,31,32,33,34,35,36,37]. Several studies had extremely low or high values, however none of the studies were found to be both highly outlying and influential.
Table 3 Concentration of different forms of vitamin D (IU/L)The results of the sub-group meta-analyses for vitamin D, 25OHD and total ARA are shown in Table 4. There were significant differences between infant age groups, country income categories and continents. However there were very few studies in certain sub-groups, making it difficult to interpret. Vitamin D levels were higher in women receiving supplementation than those not (total ARA: 91 IU/L, 95% CI: 73, 109 vs. 48 IU/L, 95% CI: 34, 63). Levels tended to be higher in summer than in other seasons (total ARA summer: 117 IU/L, 95% CI: 108, 126, fall: 63 IU/L, 95% CI: 52, 73, winter: 66 IU/L, 95% CI: 45, 87, spring: 58 IU/L, 95% CI: 50, 66). There were no significant differences between measurement methods. The meta-regressions found a significant association between latitude and 25OHD2, 25OHD3, vitamin D2, and vitamin D3 concentrations, but not for 25OHD, vitamin D, and ARA. Total ARA of milk did not appear to change over the years (p = 0.750).
Table 4 Meta-analyses for vitamin D concentration (IU/L)Not enough studies reported information on sun exposure and skin pigmentation to be able to conduct these sub-group meta-analyses. One trial [38] found that UVB irradiation could increase vitamin D breast milk concentration. A cross-sectional study [39] found higher vitamin D3, D2 and 25OHD3 in White women than in Black women (p = 0.002, 0.001, and 0.03 respectively), but no differences in 25OHD2 levels (p = 0.21).
An analysis of the studies who specifically looked into the relationship between vitamin D supplementation and vitamin D concentration in breast milk was conducted. A total of 10 trials [26, 27, 31, 32, 35, 37, 40,41,42,43] investigated the effect of vitamin D supplementation on breast milk concentration. All studies, except one [40], concluded that vitamin D supplementation could significantly increase vitamin D concentration in breast milk. When meta-analyzed, a significant increase was found in breast milk of mothers receiving vitamin D supplementation in vitamin D3 (MD: 28 IU/L, 95% CI: 6, 50), and ARA (MD: 53, 95% CI: 28, 77), but not vitamin D (MD: 4, 95% CI: -1, 9) or 25OHD (MD: 9, 95% CI: -14, 32). One cohort study [36] found that mothers taking vitamin D supplements had higher vitamin D breast milk concentrations.
留言 (0)