
記住我

Various physical and chemical characteristics of ivermectin and Fluconazole are listed in the literature. The LC–MS/MS method was chosen to determine the initial chromatographic parameters such as the M.S. spectra, mobile phase, stationary phase, and sample preparation process. The ratio and the total number of trials were changed across a series of tests. Synergi polar C18 (150 × 4.6 mm × 4.0 µm) column was used for the highest quality chromatographic results. Acetonitrile and formic acid, in a 70:30 ratio, make up the mobile phase. The mobile phase was supplied at a rate of 0.400 mL/min. 10 µL of the prepared sample was used as the injection volume for the chromatography. The column was maintained at 30 °C, while the autosampler was maintained at 15 °C. The results obtained under these conditions are presented in Fig. 2.
Fig. 2
MRM chromatograms of fluconazole and ivermectin
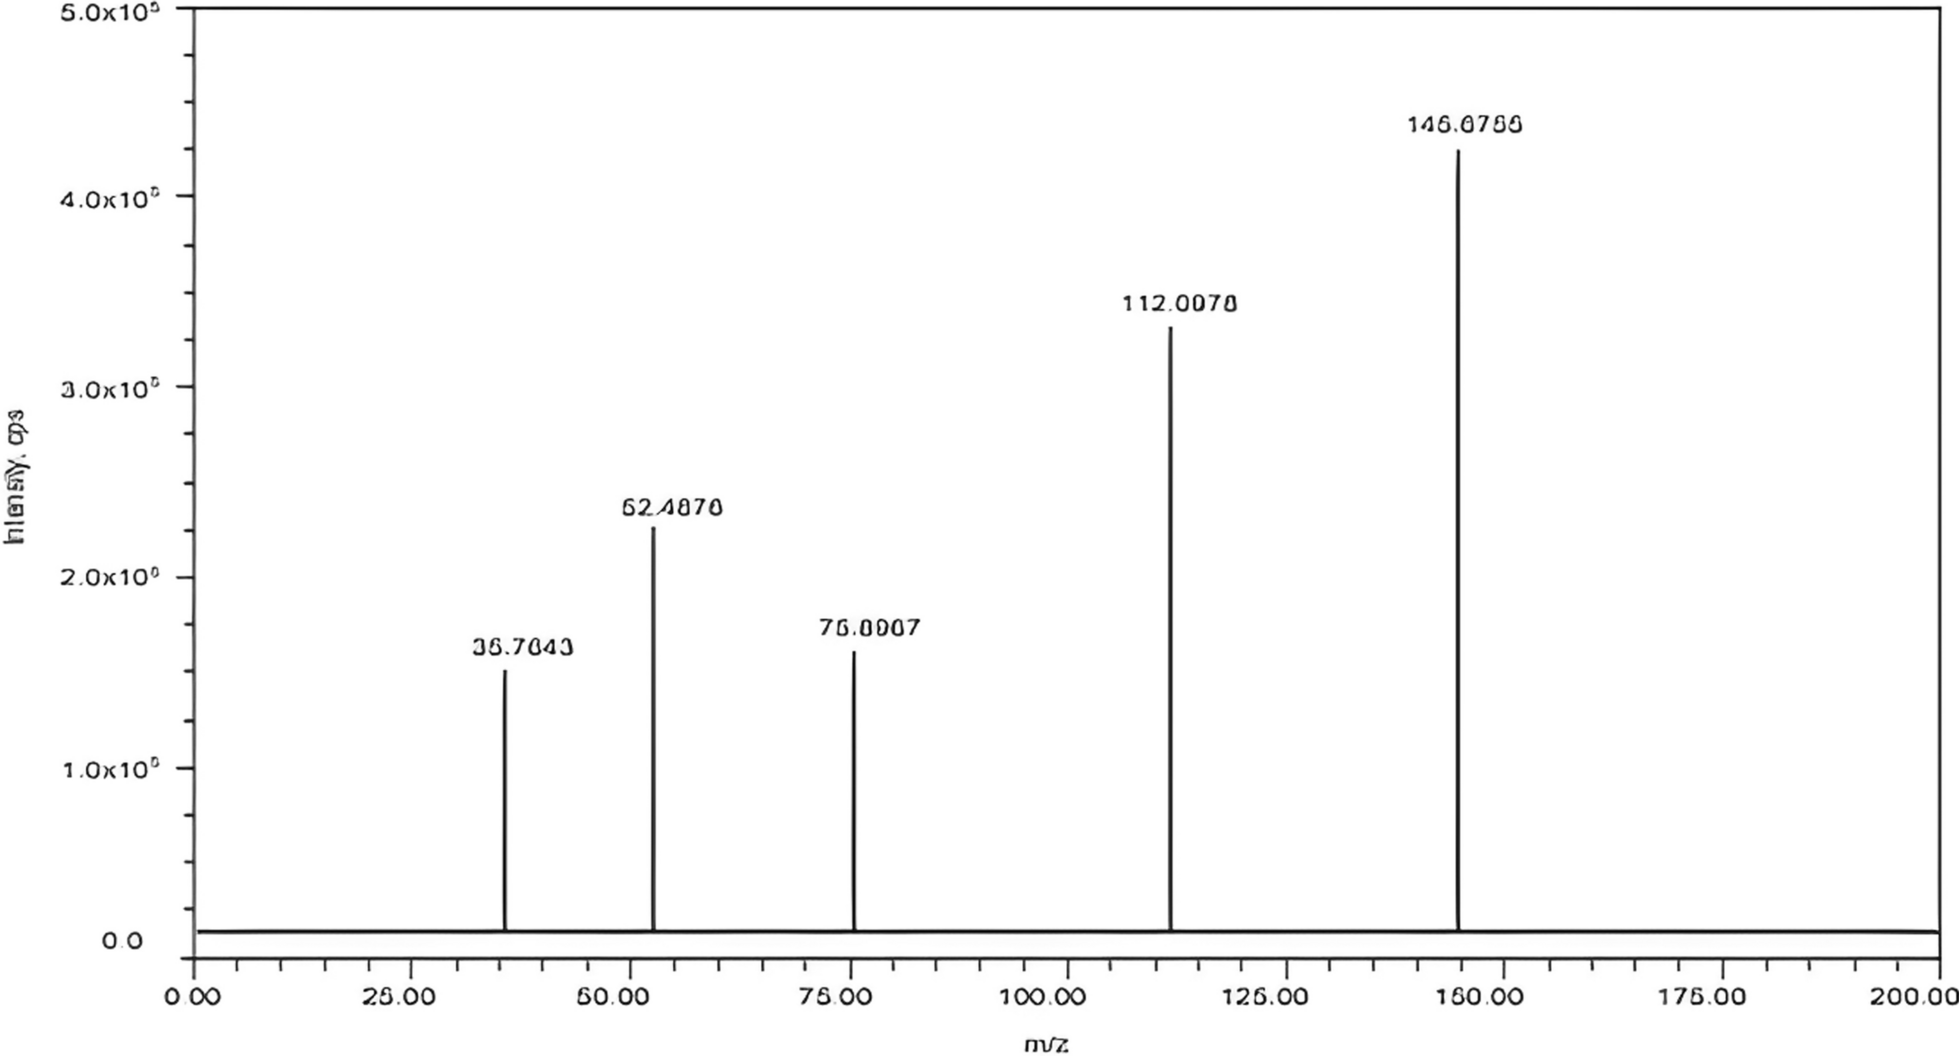
As shown in Fig. 2, retention times for Fluconazole and ivermectin were 1.10 and 1.05, respectively. The mass spectra of isolated Fluconazole and Ivermectin relevant to their specific retention times are displayed in Fig. 3a, b, respectively. The molecular ion peak ([M + H]+) corresponding to Fluconazole was observed at 169 g/mol which has the highest mass-to-charge ratio. Similarly, the molecular ion peak ([M + H2O + 4H]+) corresponding to Ivermectin was observed at 897 g/mol. Thus, we used the LC–MS/MS data to determine the area under the curve corresponding to the increasing concentrations (100, 250, 500, 750, 1000, and 1250 ppb) of Fluconazole and Ivermectin.
Fig. 3

Full scan mass spectra a fluconazole, b ivermectin
Method validationThe method was validated by following ICH guidelines, and the metrics for validation included robustness, specificity (L.O.Q. and L.O.D.), linearity, range, accuracy, and precision [27].
LinearityThe peak area obtained from the LC–MS/MS analysis for Fluconazole and ivermectin with the concentrations of 100, 250, 500, 750, 1000, and 1250 ppb were used to construct a calibration curve as presented in Fig. 4a, b (Additional file 1: Tables S1, S2, Figures S1, S2). Peak areas were plotted against corresponding concentrations, and the resulting curve was subjected to a linear regression analysis. The determination coefficients for linear relationship were found to be (r2) of 0.999 and 0.998 for Fluconazole and ivermectin, respectively. Obtained results demonstrate high linearity in the peak area and increasing concentrations of Fluconazole and ivermectin.
Fig. 4
Standard curve of a fluconazole and b ivermectin
PrecisionThe method's precision was ascertained by examining the repeatability and intermediate precision of the data. Inter-assay precision is also called repeatability. Therefore, the method's precision was determined by analyzing five samples of Fluconazole (100 ppb) and ivermectin (100 ppb). The calibration curves presented in Fig. 4a, b were used to determine the concentrations. The obtained results for the precision study are presented in Tables 1 and 2.
Table 1 Precision results of fluconazoleTable 2 Precision results of ivermectinThe mean, standard deviation, and % R.S.D. for Fluconazole were 97.5 ppb, 1.54, and 1.58, respectively. Similarly, the mean, standard deviation, and % R.S.D. for Ivermectin were 95.9 ppb, 1.08, and 1.13, respectively. The % R.S.D. of 1.58 and 1.13 for fluconazole ad ivermectin indicate the high precision of the developed method.
AccuracyAccuracy was shown as the percentage of nominal concentration. The developed method's accuracy or recovery was assessed by doing recovery experiments at 50% and 150% of the anticipated assay value in the tablet dosage form. At each step, the drug recovery % was calculated. Each experiment was replicated thrice. The extraction recovery was calculated as a percentage by comparing the peak area in spiked concentration fortified with the known concentration samples. As shown in Table 3 and Table 4, the percentage recoveries for Fluconazole and ivermectin were determined to be 98.47–99.42% and 97.78–99.30%, respectively. The % R.S.D. in the range of 0.018–0.023 and 0.016–0.038 for fluconazole ad ivermectin indicate the high accuracy of the developed method.
Table 3 Accuracy results of fluconazole at various levelsTable 4 Accuracy results of ivermectin at various levelsL.O.D. and L.O.Q.The L.O.D. and L.O.Q. for quantification of Fluconazole and ivermectin using the proposed method were determined by following IUPAC recommended Eqs. 1 and 2, respectively.
where σ is the standard deviation of blank samples (n = 10) and m is the slope of a calibration curve.
The L.O.D. and L.O.Q. for the detection and quantification of Fluconazole were found to be 0.0034 g/mL and 0.010 g/mL, respectively. The L.O.D. and L.O.Q. for detecting and quantifying ivermectin were found to be 0.074 g/mL and 0.225 g/mL, respectively.
Application to the pharmaceutical dosage formWe evaluated the applicability of the proposed method to simultaneously quantify the Fluconazole and Ivermectin in the pharmaceutical formulation using commercially available Nuforce Plus tablets. As shown in Table 5, the percent recoveries of Fluconazole and ivermectin were found to be 99.2% and 99.0%, respectively. It is important to note that the permissible range is 100 to 102%. Thus, these results indicate that the method proposed here can simultaneously quantify Fluconazole and ivermectin in pharmaceutical dosage forms.
Table 5 Assay of Fluconazole and ivermectin in a tablet dosage formSystem suitabilityThe results of optimized system suitability parameters are shown in Table 6. The system suitability parameters agree with the ICH guidelines.
Table 6 System suitability parameters
留言 (0)