
記住我

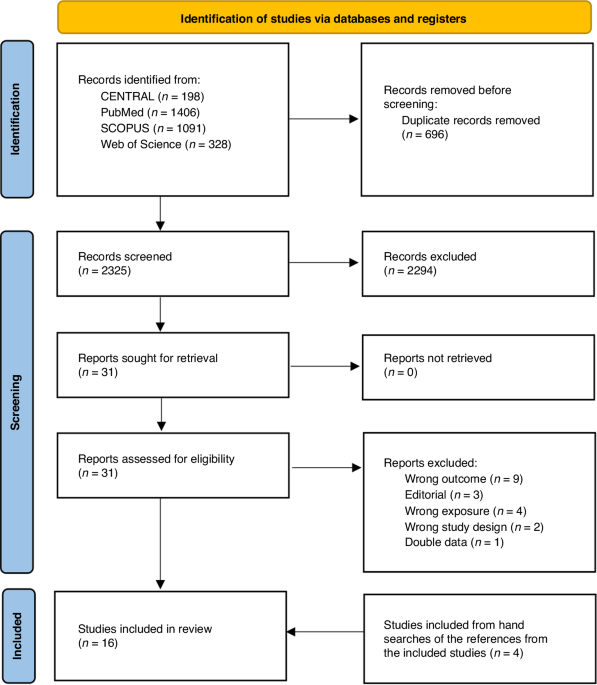

Figure 1 shows the selected articles following the PRISMA process. The number of included articles in the initial stage was 2422. After removing 183 duplicate articles and eight book references, the number became 2231. In the next stage, 146 articles were included after applying the inclusion and exclusion criteria mentioned above. In the final screening stage, 31 articles lacked complete data, two had the same data, 50 did not provide complete cognitive assessment data, and five overlapping populations were excluded. Nine articles met the inclusion criteria. Eight of the 97 articles included in the review showed inconsistency in results between two independent reviewers, which were resolved through arbitration by a third reviewer. The inter-rater reliability of the selected articles was 0.92.
Fig. 1: Process of selecting articles.
These nine articles included twelve study groups: one each from Poland, Sweden, Italy, Denmark, and Slovakia; two each from South Korea, and the United States; and three each from Taiwan. Participants were recruited from hospitals, environmental health centers, obstetrics and gynecology clinics, and child psychiatric clinics. Concerning cognitive instruments, three articles used Bayley, and nine used WIS. Regarding the timing of phthalate concentration assessment, five articles (five study groups) measured prenatal samples (mother’s urine), and four articles (seven study groups) measured postrenal samples (children’s urine). The characteristics of the nine articles included in the final analysis are summarized in Table 1.
Table 1 Essential characteristics and review of the articles included in the meta-analysis.Meta-analysis: sex comparison for cognitive functionThe significant difference in cognitive scores between the sexes was not detected (weighted mean difference = 0.87; 95% CI = −0.24, 1.98; p = 0.20; I2 = 35.66%) (Fig. 2). Additionally, we performed subgroup analyses by study period, region, the timing of phthalate concentration assessment, and intelligence assessment tools (Table 2; Fig. 3a–d).
Fig. 2: Forest plot of studies on the weighted mean difference of intelligence scores between boys and girls with phthalates exposures.
BSID-II Bayley Scales of Infant and Toddler Development Version II, H2 h-squared, IDS Intelligence and Development Scales, I2 I-squared, p p-value, KEDI-WISC Korean Educational Development Institute-Wechsler Intelligence Scale for Children, τ2 tau-squared, WIS Wechsler Intelligence Scale.
Table 2 Subgroup analysis between plasticizer exposure by different characteristics.Fig. 3: Subgroup analysis of studies on the weighted mean difference of intelligence scores between boys and girls with phthalates exposures.
a By study period, b by region, c by the timing of phthalate concentration assessment, and d by intelligence assessment tools. BSID-II Bayley Scales of Infant and Toddler Development Version II, H2h-squared, IDS Intelligence and Development Scales, I2 I-squared, p p-value, KEDI-WISC Korean Educational Development Institute-Wechsler Intelligence Scale for Children, τ2 tau-squared, WIS Wechsler Intelligence Scale.
Meta-regression and sex role in cognitive functionsFigure 4 reveals bubble plots of sex difference in cognitive function scores associated with age at phthalate concentration assessment (Fig. 4a; \(\beta \) = −0.25; 95% CI = −0.47, −0.03; p = 0.03), and MEHP concentration (Fig. 4b; \(\beta\) = −0.20; 95% CI = −0.37, −0.03; p = 0.02). Supplementary Fig. 1A–I shows insignificant results on MEOHP (\(\beta\) = −0.01; 95% CI = −0.22, 0.21; p = 0.96), MEHHP (\(\beta\) = −0.00; 95% CI = −0.11, 0.13; p = 0.97), ∑DEHP (\(\beta\) = 0.02; 95% CI = −0.03, 0.07; p = 0.37), MBzP (\(\beta \) = 0.00; 95% CI = −0.06, 0.06; p = 0.96), MiBP (\(\beta\) = −0.01; 95% CI = −0.05, 0.03; p = 0.50), MnBP (\(\beta \) = 0.01; 95% CI = −0.07, 0.10; p = 0.74), MBP (\(\beta\) = 0.03; 95% CI = −0.14, 0.21; p = 0.71), MEP (\(\beta\) = −0.00; 95% CI = −0.03, 0.02; p = 0.85), and age at intelligence assessment (\(\beta\) = −0.14; 95% CI = −0.48, 0.19; p = 0.40).
Fig. 4: Meta-regression.
Meta-regression of the weighted mean difference in (a) age at phthalate concentration assessment and (b) MEHP concentration (μg/L).
Further correlation analysis revealed that MEHP concentration was also associated with age at phthalate concentration assessment (both prenatal and postnatal; r = 0.71; p < 0.05; see Supplementary Fig. 2A) and age at intelligence assessment (r = 0.40; p < 0.05; see Supplementary Fig. 2B). However, the correlation coefficient between “MEHP concentration” and “age at phthalate concentration assessment (both prenatal and postnatal)” was higher. This finding suggests that the difference was more significant at younger ages, probably due to the lower concentration of age at the phthalate concentration assessment. In addition, both correlations showed that the higher the age, the higher the plasticizer concentration measured. Our findings suggest that the protective effect of age may only exist at young ages or low concentrations of plasticizers.
Publication biasA symmetric inverted funnel shape indicated a low risk of publication bias among these nine articles with twelve study groups, as shown in Fig. 5 (\(\beta\) = −0.47; 95% CI = 0.59, 1.49; p = 0.66).
Fig. 5: Funnel plot.
Funnel plot for the weighted mean difference from the articles included in the meta-analysis of twelve study groups.
Risk of biasThe risk of bias assessments for studies investigating the association between plasticizer exposure and intelligence function are summarized in Table 3, and the details of each assessment are provided in Supplementary Table 2. The NTP/OHAT Risk of Bias tool focuses on confounding and detection biases, including exposure and outcome assessment. We assessed the risk of bias among the nine articles. For confounding bias, confounders such as parents’ smoking habits and education, household income, and lower socioeconomic status were not adjusted throughout the four articles. Thus, three articles were rated as having a “probably high risk of bias.”19,20 For exposure detection bias, none of the articles was rated as “probably low risk of bias.” However, for outcome detection bias, two articles were rated as “probably high risk of bias,” which provided insufficient information to justify the assessment.21 For exclusion bias, five articles that did not specify exclusion bias were rated as “probably high risk of bias.”20,21,22,23 Four articles that failed to report conflicts of interest or funding support were rated as “probably high risk.”20,21,22,23 For selective reporting bias, article was rated as “probably low risk of bias” due to a lack of significant and consistent evidence of inverse associations between three groups of cohort study exposures and FSIQ. In summary, articles were categorized as Tier 1 (n = 5) or Tier 2 (n = 4) for risk of bias, indicating a “plausible bias that raises some doubt about the results.”17
Table 3 The assessment of the risk of bias of plasticizers articles the NTP/PHAT risk of bias rating tool for children’s plasticizer cohort study.Certainty of evidenceA summary of the findings regarding the certainty of the evidence is provided in Table 4. Regarding the risk of bias rating for studies investigating plasticizers, the overall risk of bias was “not serious.” The inconsistency of the certainty assessment indicated low heterogeneity in the meta-analyses of the studies (I2 = 35.66%). However, the explanation for this heterogeneity could reveal some inconsistencies, such as differences in study design, population age, prenatal or postnatal exposure, and statistical methods. The respective category of the inconsistency of certainty assessment was “serious.” The indirectness and imprecision certainty assessment indicated a category of “not serious” because the outcomes of our study demonstrated that the evidence answers directly to population cognitive functions living near plasticizers, and the CI of the pooled analysis was narrow (−0.24 to 1.98). Funnel plots (Fig. 5) exhibited symmetrical patterns, and weighted mean difference did not yield evidence of publication bias, indicating an undetectable publication bias. In summary, the inherent risk of bias made our rating for the certainty of evidence from low to very low for the association between sex differences in cognitive function and plasticizer exposure.
Table 4 Summary of finding evidence.
留言 (0)