
記住我


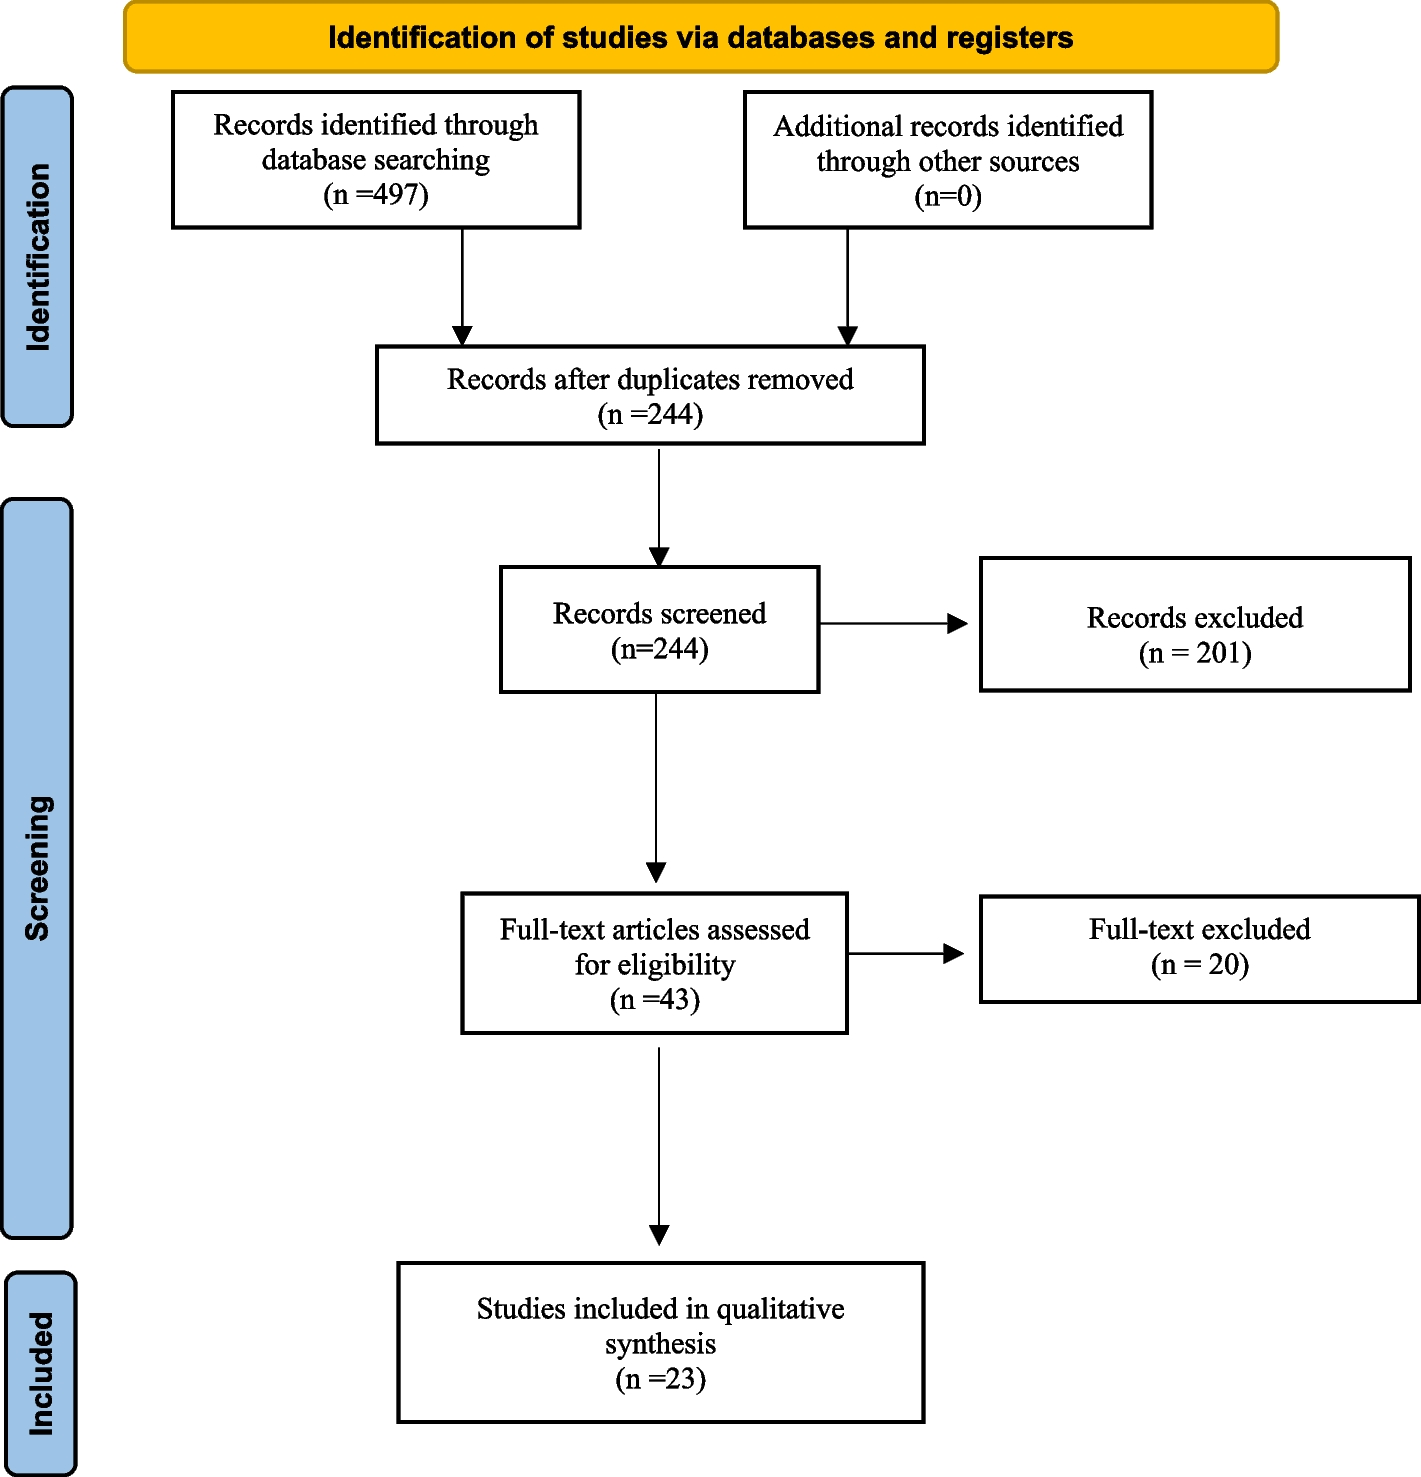

The search yielded a total of articles. Seven RCTs [8,9,10,11,12,13,14] with a total of 428 patients were ultimately included, and the screening flow chart is shown in Fig. 1.
Fig. 1
PRISMA flow diagram for study selection
Basic characteristics of the included studiesAll included studies were from Chinese journals, and the authors were all Chinese nationals. Data on the first author, year of publication, outcome indicators, tumor classification, tumor stage, the number of samples, age, intervention measures, treatment course, and outcome measures were collected (Table 1).
Results of the risk of bias assessmentAll included studies were RCTs, 4 included random numbers, and 3 did not specify how the random sequence was generated. None of the included studies mentioned concealment, blindness, withdrawal or loss to follow-up; selective reporting and other biases were not mentioned; and all studies mentioned that the baseline data of patient age and sex were comparable (P > 0.05). Methodological quality evaluation was performed using the Cochrane risk of bias assessment tool (Figs. 2 and 3).
Fig. 2
Summary of the risk of bias among the included studies
Fig. 3
Risk of bias among the included studies
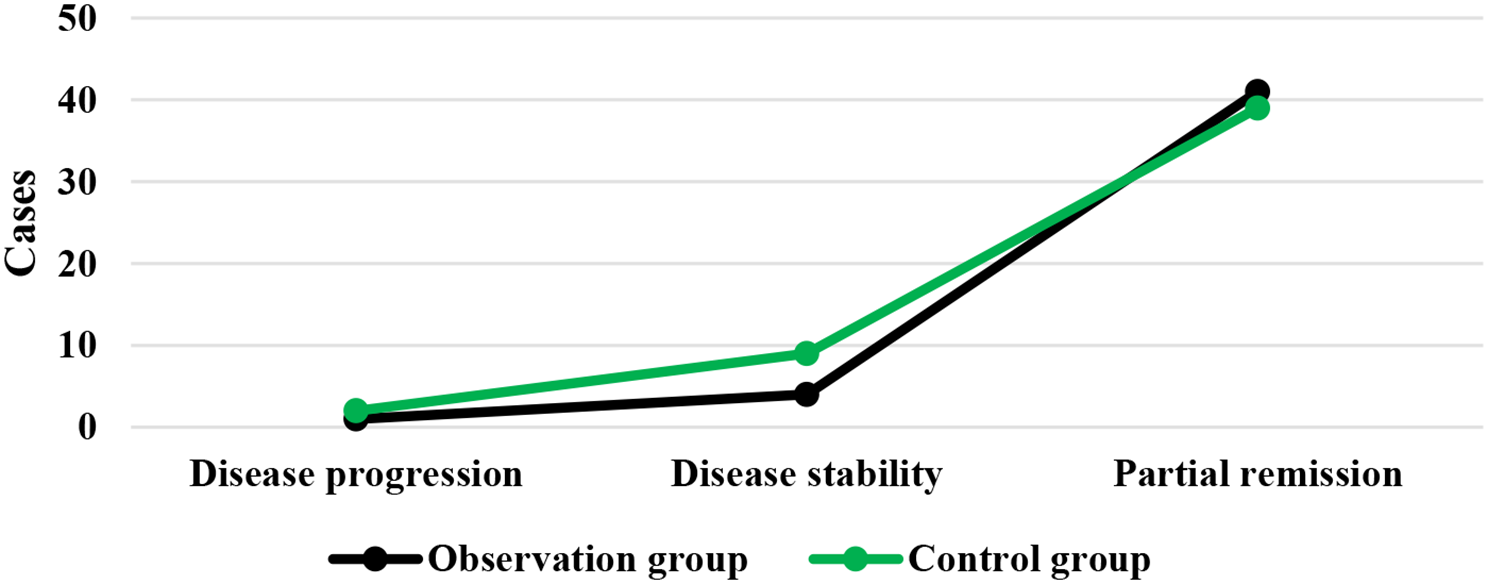
Meta-analysis resultsObjective response rate and clinical benefit rateThe seven RCTs [8,9,10,11,12,13,14] including 428 patients reported the objective response rate (ORR) and a heterogeneity test was performed (I2 = 0%, P = 0.92) using a fixed-effects model. The observation group showed a greater ORR, and the difference between the two groups was statistically significant [OR = 3.26, 95% CI (2.18, 4.87), P < 0.00001] (Fig. 4A). Subgroup analysis suggested that different radiotherapy methods did not change the original conclusion (Supplemental Figure S1). The seven RCTs [8,9,10,11,12,13,14] patients reported the disease control rate (DCR) and a heterogeneity test was performed (P = 0.65; I2 = 0%) using a fixed effects model. The observation group showed a greater DCR, and the difference between the two groups was statistically significant [OR = 5.04, 95% CI (3.12, 8.12), P < 0.00001] (Fig. 4B). The subgroup analysis suggested that the original conclusion did not change despite the use of different radiotherapy methods (Supplemental Figure S2).
Fig. 4
Forest plot: A objective response rate (ORR); B disease control rate (DCR)
The seven RCTs [8,9,10,11,12,13,14] including 428 patients reported the complete response rate (CR), and a heterogeneity test was performed (P = 0.97; I2 = 0%) using a fixed-effects model. The observation group showed greater PFS and the difference between the two groups was statistically significant [OR = 3.87, 95% CI (1.51, 9.88), P = 0.005] (Fig. 5A). The 7 RCTs [8, 14] patients reported partial response (PR) rates, and a heterogeneity test (P = 0.99; I2 = 0%) was performed using a fixed-effects model. The observation group showed greater PR, and the difference between the two groups was statistically significant [OR = 2.43, 95% CI (1.63, 3.61), P < 0.0001] (Fig. 5B).
Fig. 5
Forest plot: A complete response rate (CR); B partial response rate (PR)
The seven RCTs [8,9,10,11,12,13,14] including 428 patients reported the treatment stability rate (SD), performing a heterogeneity test (P = 0.06; I2 = 50%) using a fixed-effects model. The results showed no statistically significant difference between the two groups [OR = 1.14, 95% CI (0.72, 1.81), P = 0.58] (Fig. 6A). The seven RCTs [8,9,10,11,12,13,14] including reported the treatment progression rate (PD), performing a heterogeneity test (P = 0.70; I2 = 0%) using a fixed-effects model. The observation group showed a lower rate of PD, and the difference between the two groups was statistically significant [OR = 0.19, 95% CI (0.12, 0.32), P < 0.00001] (Fig. 6B).
Fig. 6
Forest plot: A treatment stability rate (SD); B treatment progression rate (PD)
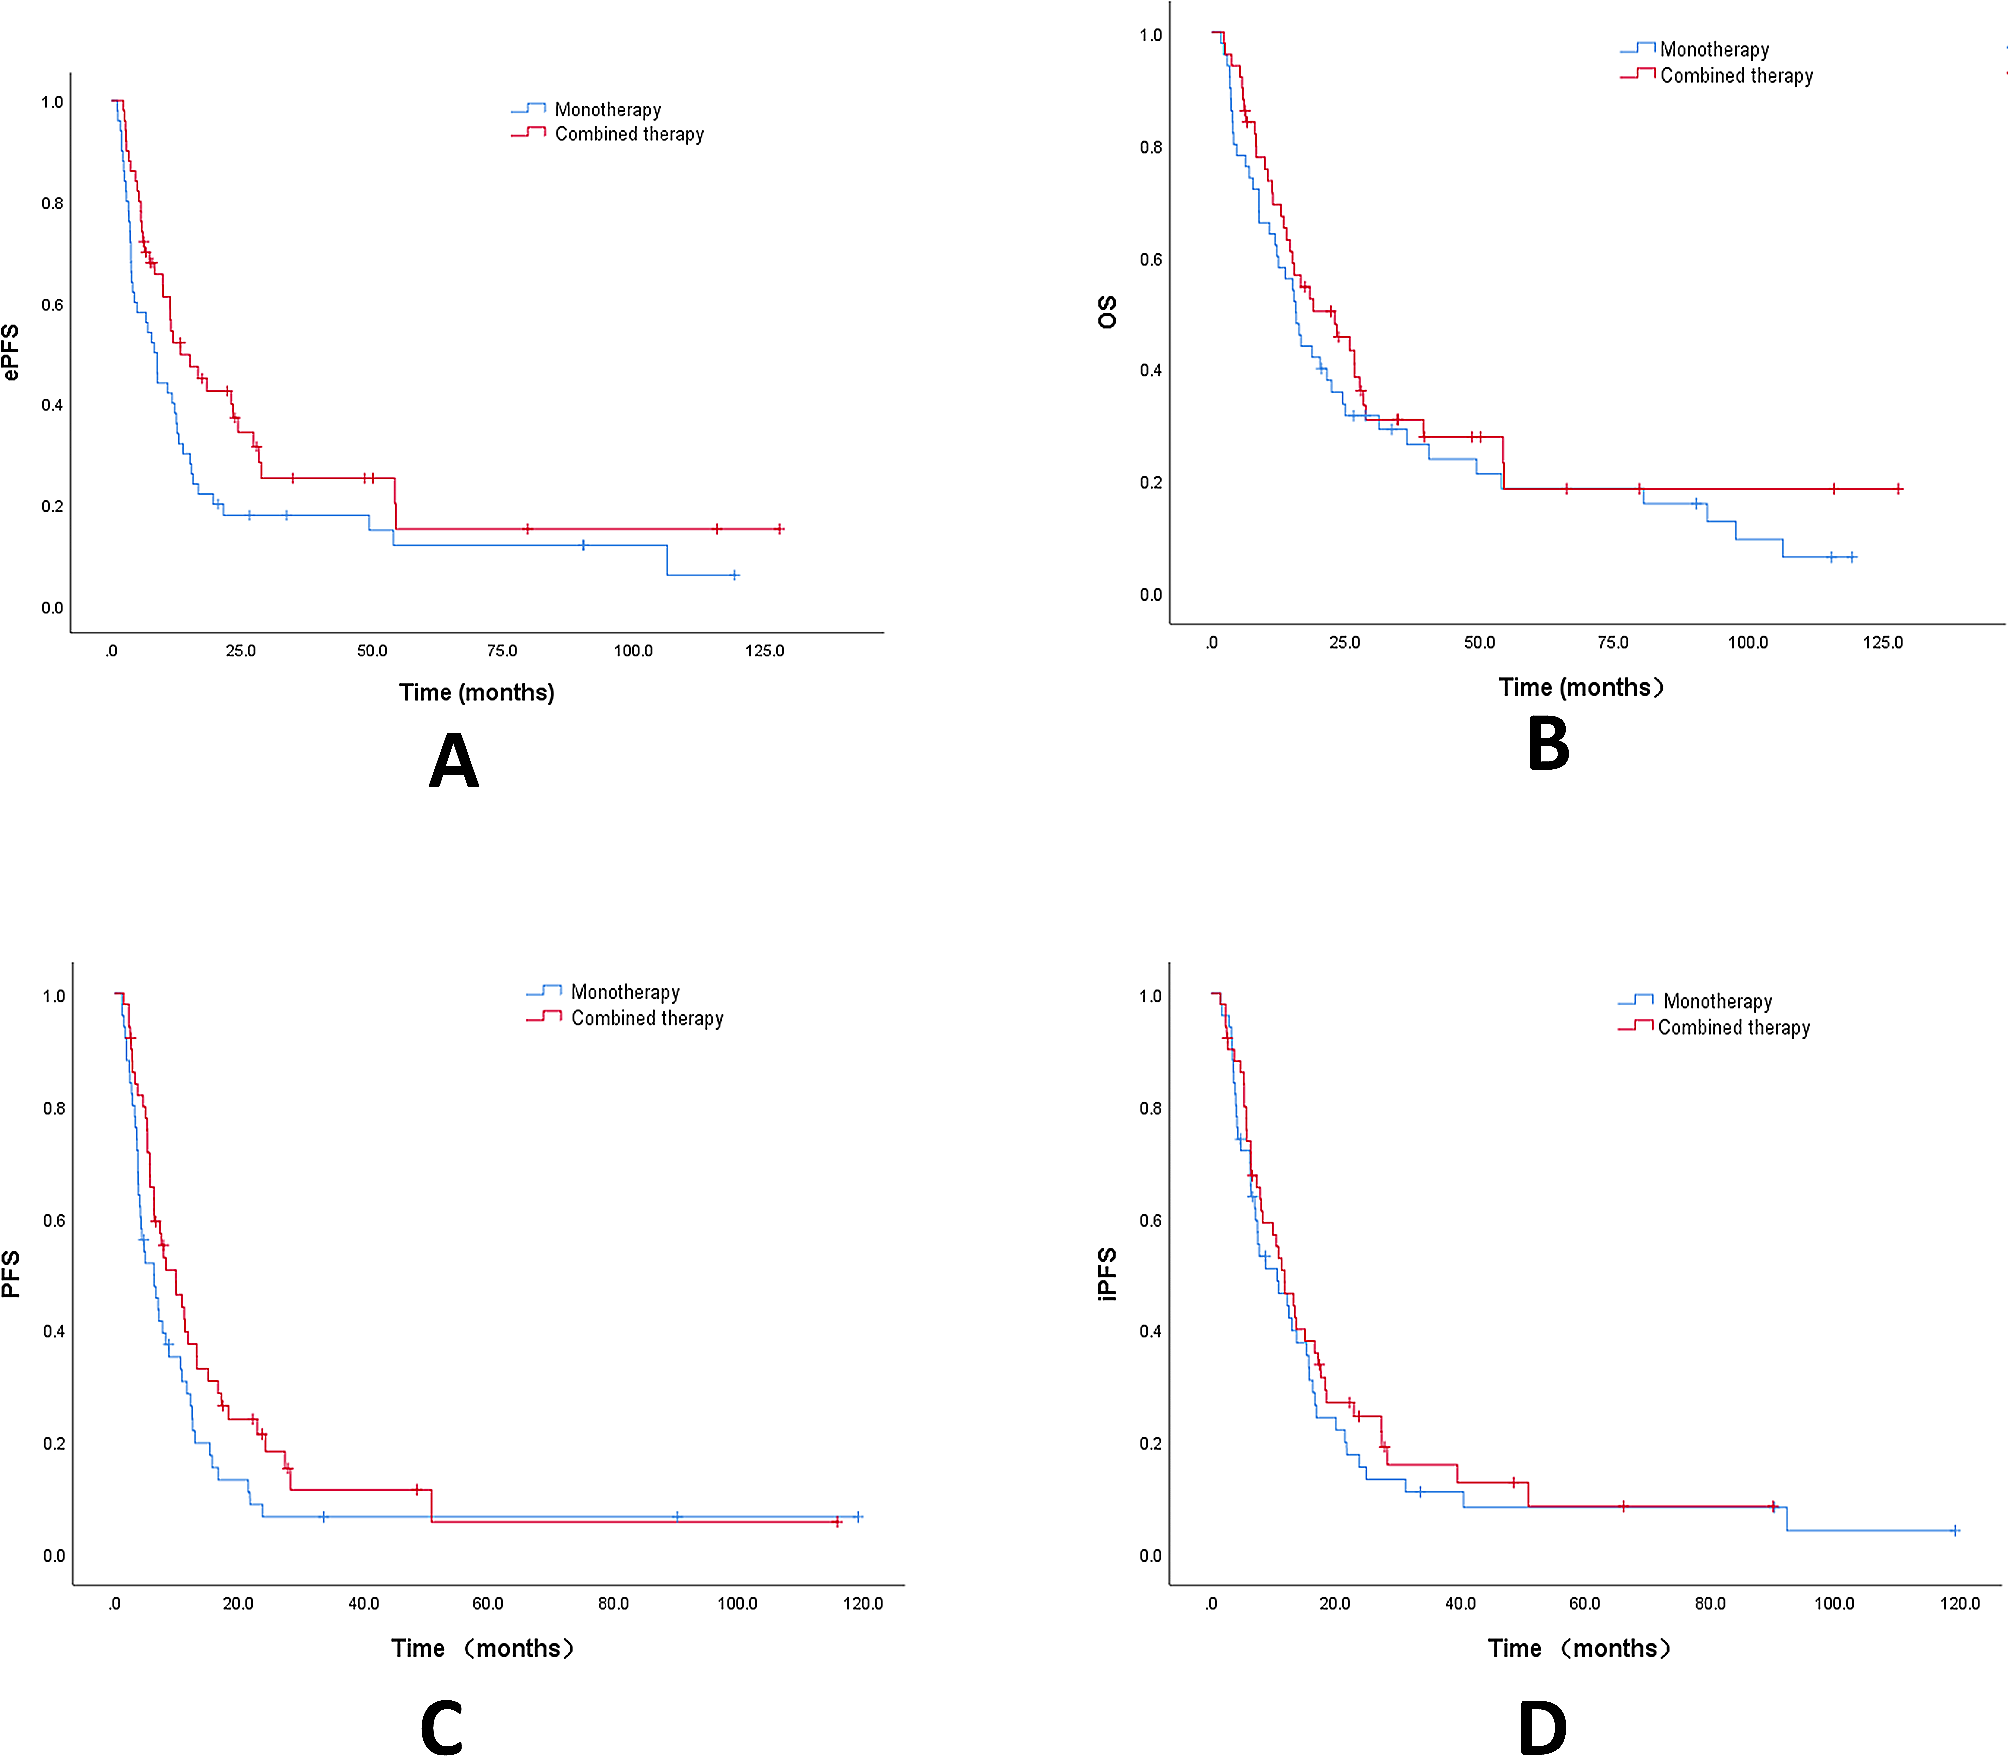
Two RCTs [8, 12] reported the median overall survival time (mOS), and a heterogeneity test (P = 0.0004; I2 = 92%) was performed using a random effects model. The observation group showed a greater mOS, and the difference between the two groups was statistically significant [MD = 1.47, 95% CI (0.13, 2.80), P < 0.05] (Fig. 7A). Two RCTs [8, 12] reported progression-free survival (PFS), and a heterogeneity test (P = 0.01; I2 = 84%) was performed using a random effects model.
Fig. 7
Forest plot: A Median OS; B progression-free survival (PFS); C 1-year OS rate; D 2-year OS rate
The observation group showed a greater rate of PFS, and the difference between the two groups was statistically significant [MD = 1.17, 95% CI (0.37, 1.96), P < 0.05] (Fig. 7B). Two RCTs [8, 13] reported the 1-year survival rate, and a heterogeneity test was performed (P = 0.35; I2 = 0%) using a fixed-effects model. The observation group showed a higher 1-year OS rate, and the difference between the two groups was statistically significant [OR = 2.39, 95% CI (1.15, 4.96), P < 0.05] (Fig. 7C). Two RCTs [8, 13] reported the 2-year OS rate, and a heterogeneity test (P = 0.77;I2 = 0%) was performed using a fixed effects model. The observation group showed a higher 2-year survival rate, and the difference between the two groups was statistically significant [OR = 2.41, 95% CI (1.03, 5.61), P < 0.05] (Fig. 7D).
The meta-analysis showed no significant difference in complications between the two groups (P > 0.05) (Table 2). Complications included leukopenia, thrombocytopenia, nausea and vomiting, proteinuria, radiation-induced inflammation, hepatic and renal impairment, and hypertension. Among the complications, the incidences of radiation-induced inflammation, hypertension, proteinuria and other indicators were determined to be significantly heterogeneous using a random-effects model, while a fixed-effects model was used for the remaining outcome indicators.
Table 2 Meta-analysis results of apatinib combined with radiotherapy in the treatment of PCPublication bias analysisBecause the number of meta-analyses included was less than 10, this study is considered to have publication bias.
Sensitivity analysisThe influence of each study on the risk estimate was investigated by removing studies one by one, which showed that the overall risk estimates were not obviously changed by any single study.
留言 (0)