Human ESCC tissue samples
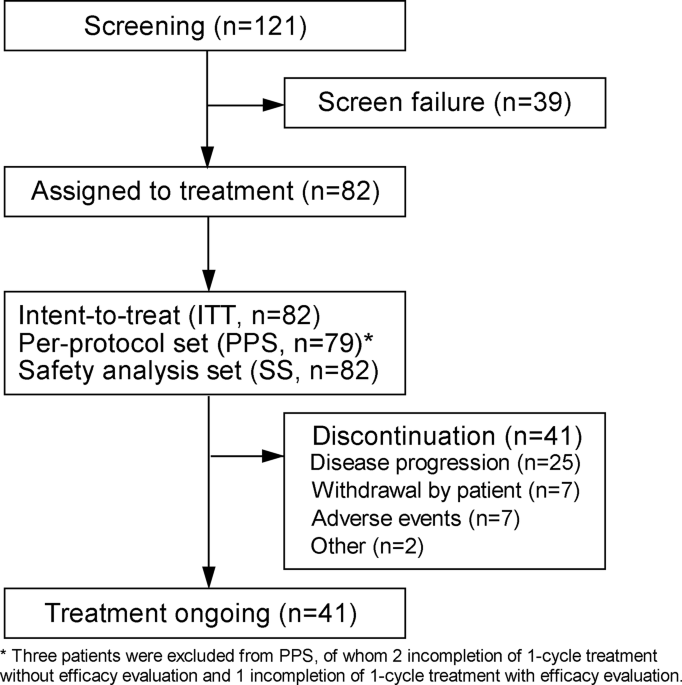
A total of 504 ESCC patients’ tissue samples used in immunohistochemistry were provided by Shanxi Medical University. Informed consent was obtained from all subjects, and this study was approved by the ethical committees of Shanxi Medical University. All the patients had not received prior treatment for their disease. The paired adjacent normal tissue specimen was also obtained for analysis in conjunction with each tumor specimen. Clinical staging of cancer was determined based on the International Union Against Cancer (UICC)/American Joint Commission for Cancer (AJCC) TNM staging system (the eighth edition). Follow-up for all patients was for 2 years. Disease-free survival (DFS) was defined as the time interval after primary surgery during which no sign of cancer is found. The DFS distributions were described by the Kaplan−Meier curves, and statistical significance was calculated using the Log Rank test. Multivariate Cox regression analysis of factors associated with survival of patients with ESCC.
Immunohistochemistry
Human esophageal cancer tissues were fixed in 4% (v/v) formaldehyde in PBS and then embedded in paraffin and cut into 4 μm sections. Tissue sections were dewaxed in xylene and dehydrated in 95, 85, and 70% alcohol gradient. The slide covered with citrate buffer was heated at 95 °C for 10 min to achieve antigen recovery. Then, 10% goat serum albumin was used to block nonspecific binding, followed by incubation with primary antibodies in a moist chamber at 4 °C overnight. After washing three times with phosphate-buffered saline (PBS), the slides were incubated with a secondary antibody at room temperature for 1 h and washed with PBS. Diaminobenzidine (DAB) was used as a chromogen, and the sections were counterstained with hematoxylin.
Animal experiments
All animal protocols were approved by the Animal Care and Use Committee of the Chinese Academy of Medical Sciences Cancer Hospital. For subcutaneous xenografting, 1 × 10⁶ KYSE30/KYSE450/KYSE150/KYSE510 cells were subcutaneously implanted into 5-week-old male BALB/c-nude mice (Nanjing Biomedical Research Institute of Nanjing University, Nanjing, China). Mice were fed under normal conditions. Five days later, the mice were randomly assigned to treatment groups and control groups that all received intraperitoneal injections of Folic acid (T0062, TargetMol, 5 mg/kg) and Cisplatin (mab0061, R&D, 5 mg/kg). The tumor lengths and widths were measured using a caliper, and the volume was calculated with the formula 0.5 × length × width2. After the tumors had grown for the designated time, all the mice were euthanized, and the tumors were harvested.
For the generation of spontaneous lung metastatic models, 5-week-old BALB/c-nude male mice were injected with 1 × 10⁶ KYSE30 cells stable expressed RPS15 via the tail vein. Three months later, a subset of mice (n = 6) was sacrificed, and tumor nodules in the lungs were assessed. For paraffin sections, the lungs were excised and fixed in formalin overnight. Paraffin-embedded lungs were systematically sectioned and stained with hematoxylin and eosin (H&E) staining, and images were taken.
For the metastatic lymph node models, BALB/c-nude mice were injected with 0.1 mL cell suspension containing 1 × 10⁶ RPS15 overexpressed KYSE450 cells into the footpads. Animals were sacrificed at 8 weeks after injection and popliteal lymph nodes were enucleated and paraffin-embedded.
Cell culture
Human ESCC cell lines were provided by Dr. Yutaka Shimada (Kyoto University, Japan). The HEK293T cell lines were purchased from the American Type Culture Collection (ATCC, VA, USA). ESCC cell lines and HEK293T cells were cultured at 37 °C with 5% CO2 in RPMI-1640 medium or Dulbecco’s modified Eagle’s medium (DMEM), respectively, supplemented with 10% FBS. All cells were routinely by short tandem repeat (STR) analysis and regularly tested for mycoplasma contamination.
Plasmids, lentiviruses, and transduction
The full-length human RPS15 was cloned into the pLenti6-blasticidin and pcDNA3-Flag vector, respectively. The full-length human IGF2BP1 was inserted into the pcDNA3-Myc vector. The mutant plasmids of RPS15 were generated using PCR-based methods with specific primers and subsequently inserted into the pcDNA3-Flag vector. The IGF2BP1 shRNA sequence were cloned into the pSIH-H1 vector.
Lentivirus was produced using HEK293T cells with second-generation packing system pMD2.G (#12 259, Addgene) and psPAX2 (#12 260, Addgene). For lentivirus packaging, 1.5 μg pMD2.G, 4.5 μg psPAX2, together with 6 μg pLenti6/pLenti6-RPS15 or 6 μg pSIH-H1-puro/pSIH-H1-puro-shRNA was co-transfected into HEK293T cells with Hieff Trans Liposomal Transfection Reagent (40802, Yeasen, Shanghai, China). After 48 h, the supernatant was harvested, centrifuged at 1000×g for 10 min at 4 °C, and then filtered with a 0.45-μm syringe filter. For viral transductions, 2.5 × 10⁵ cells/well were seeded in six-well culture plates and infected with viruses plus polybrene (8 μg/mL) for 48 h. To obtain stable cell lines, cells were selected for 1-to-2 weeks with 10 μg/mL blasticidin or 1 μg/mL puromycin. Sequences of siRNAs, shRNAs, and sgRNAs are available in Supplementary Table S3.
Antibodies and reagents
Antibodies against the following proteins were used for Western blot: RPS15 (1:2000, Abcam; ab157193), IGF2BP1 (1:1000, Cell Signaling Technology; 8482), phospho-p38 MAPK (1:1000, Cell Signaling Technology; 9211), p38 MAPK (1:1000, Cell Signaling Technology; 9218), MKK6 (1:1000, Cell Signaling Technology; 8550), β-actin (1:1000, Cell Signaling Technology; 4970), Flag-tag (1:5000, Immunoway; YM3001), Myc-tag (1:5000, Immunoway; YM3203), m6A antibody (Thermo; MA5-33030) and rabbit IgG (Millipore; PP64B)-Diquafosol tetrasodium (CAS: 211427-08-6; T7423), Coenzyme A (CAS: 85-61-0; T10857), Folic acid (CAS: 59-30-3; T0062), Epicatechin gallate (CAS: 1257-08-5; T2732), and Methotrexate (CAS: 59-05-2; T1485) were purchased from TargetMol and SB203580 (CAS: 152121-47-6; T1764).
Immunoprecipitation and Western blot
Total cell lysates were prepared using RIPA lysis buffer with freshly added protease inhibitor cocktail (0 469 315 9001, Roche, Basel, Switzerland) and phosphatase inhibitor cocktail (0 490 684 5001, Roche, Basel, Switzerland) for 20 min on ice. For co-IP assays, IP lysis buffer was used. The protein concentrations were quantified using a BCA assay kit (Thermo Scientific). For immunoprecipitation, equal amounts of protein lysate were incubated overnight at 4 °C with anti-c-Myc magnetic beads (A7470, Sigma) or anti-Flag magnetic beads (M8823, Sigma-Aldrich) for exogenous protein co-IP, and protein A/G magnetic beads (HY-K0202, MCE) or an anti-IGF2BP1 antibody for endogenous protein co-IP. The beads were washed three times with cell lysis buffer and eluted from beads with 2×loading buffer. Protein extracts were resolved on 10% SDS-PAGE, transferred onto PVDF membranes (Merck Millipore, MA, USA), and visualized by chemiluminescence.
Silver staining and mass spectrometry
Flag-RPS15 was transfected into HEK293T cells, and cell lysates were immunoprecipitated with anti-flag magnetic beads. The beads were washed three times with cell lysis buffer and eluted with 2×loading buffer. The immunoprecipitated protein complexes were resolved on 10% SDS-PAGE, sliver stained with Pierce Silver Stain (24600, Thermo Scientific) and subjected to gel-based LC-MS/MS. MS data were analyzed using MaxQuant software against the UniProtKB/Swiss-Prot human database.
RNA isolation and quantitative real-time PCR (qRT-PCR)
Total RNA was extracted from cultured cells using TRIzol reagent (Thermo Scientific, MA, USA). RNA was subsequently reverse-transcribed to complementary DNA using a Quantscript RT Kit (KR103, Tiangen, Beijing, China) according to the manufacturer’s instructions. qRT-PCR was carried out using PowerUpTM SYBRTM Green Master Mix (A25742, Applied Biosystems, CA, USA) and the analysis was performed in a StepOnePlus Real-Time PCR system (Applied Biosystems, CA, USA). The relative expression levels of the target genes were standardized as those of the housekeeping gene GAPDH. The qRT-PCR primers are shown in Supplementary Table S2, Supporting Information.
Gene-specific m6A qPCR and RIP-qPCR
Methylated RNA or RNA binding to IGF2BP1 were determined using Magna RIP RNA-Binding Protein Immunoprecipitation Kit (Sigma; 17-700) following the manufacturer’s instructions. One-tenth of fragmented RNA was saved as input control, and further analyzed by qPCR. The related enrichment of m6A or IGF2BP1 in each sample was calculated by normalizing to tenfold input. The primers are shown in Supplementary Table S2.
Transwell assay
The Boyden Chamber (3422/3428, Costar, Corning) precoated with or without Matrigel (354248, Coring, USA) were used to respectively detect the invasion and migration ability of ESCC cells. Cells were seeded into the upper chamber with serum-free medium, whereas a complete medium containing 20% FBS was added to the bottom chamber. After 24 h, the bottom cells were stained with crystal violet. For the inhibitor treatment assays, cells were plated in the upper Chamber in serum-free medium containing p38 MAPK inhibitor SB203580 (T1746, TargetMol, 8 μM), Folic acid (T0062, TargetMol, 10 μM) or DMSO. A complete or conditioned medium containing the corresponding inhibitor was added to the bottom Chamber.
Live-cell microscopy and quantification
The indicated cell lines were seeded into 96-well plates at a density of 1000–4000 cells per well, depending on the growth rate and design of the experiment. Approximately 24 h later, 10 μM folic acid (T0062, TargetMol), 8 μM p38 MAPK inhibitor SB203580 (T1746, TargetMol), and/or cisplatin were added at the indicated concentrations. Cells were imaged every 3 h using an Incucyte S3 microscope (Essen Bioscience) or Livecyte 419 Phase Focus microscope (Essen Bioscience). Phase-contrast images from the Incucyte S3 microscope were analyzed to evaluate cell proliferation based on cell confluence. Proliferative measurement (cell-doubling time), mitotic measurement (total mitosis events), and kinetic measurements (track speed and displacement) were extracted using Cell Analysis Toolbox (CAT) software available with the Livecyte 419 Phase Focus microscope.
Virtual screening
The virtual filter available in the Schrodinger software was applied for virtual screening. First, the crystal structure of the RPS15 protein was downloaded from the PDB database (PDB ID 6G4W)46 and the P chain was retained. Protein Preparation Wizard was used to optimize the protein structure and the optimized potentials for liquid simulations (OPLS)-2005 force field. Schrodinger sitemap was used to identify three potential small-molecule binding pockets in the RPS15 protein structure. The potential binding pocket with the highest score was defined as the binding pocket based on the Glide score for Receptor Grid Generation (as shown in Fig. 7a).
RNA-seq and gene expression signature analysis
RNA-seq and gene expression signature analysis were performed as previously described.47
Processing of mRNA-seq and ribo-seq data
Trimmomatic was used to remove adapters and low-quality fragments from the raw reads.48 To identify reads originating from rRNAs, Bowtie (version 1.1.3) was used to align the reads to human rRNA sequences downloaded from the National Center for Biotechnology Information Reference Sequence (NCBI RefSeq) database and then excised from the aligned reads.49 The remaining reads were then mapped to the human genome (GRCh38) using the STAR (version 2.7.3a) program.50 Only uniquely mapped reads with no more than two mismatches were retained.
Quantification of RPF and mRNA expression
To select high-quality ribosome-protected fragments (RPF), ribo-seq reads with lengths between 26 and 32 nt that mapped to coding sequence regions were used for subsequent quantification analysis. For each gene, mRNA expression and RPF counts were estimated using featureCount (version 1.6.5) software.51 Xtail (version 1.1.5) was used to estimate the fold-change in translation efficiency (TE) of each gene between the control cells and RPS15-overexpressing cells.52
Ribosome binding preference
To identify the transcripts preferentially bound by ribosomes in RPS15-overexpressing samples, edgeR Bioconductor package53 was used to identify genes with significantly increased RPF counts (P < 0.05 and log2 FC >0.45) under conditions of overexpression. ClusterProfiler was then used to perform GO and KEGG enrichment analyses of these genes.54
Statistical analysis
Statistical analyses and graphs were generated using GraphPad Prism version 6.01 software (San Diego, CA, USA). Statistical significance was calculated using an unpaired Student’s t-test. Correlation analysis was performed using Pearson’s correlation coefficients. Each experiment was performed at least three times and quantitative data are shown as the mean ± S.D.


留言 (0)