Data
A cohort of 195 histologically proven cervical cancer patients treated in our institution between August 2012 and December 2021 was retrospectively collected. The average age was 53 (standard deviation of 15 years) and tumor stage ranged from IB to IV according to the International Federation of Gynecology and Obstetrics (FIGO) staging [13]. The treatment consisted of external beam radiotherapy (156 patients with 23 × 2 Gy and 39 patients with 25 × 1.8 Gy) followed by BT (3 × 7 Gy) and combined with chemotherapy (cisplatin 40 mg/m2, weekly). The institutional review board approved the study (IRBd20276). Informed consent was waived considering the retrospective design.
A total of 524 separate BT fractions were included in this work. For each BT fraction, MRI images of the patient with applicator in place were acquired using a 1.5T (104 scans) or 3T (442 scans) Philips Medical Systems MRI scanner. Axial T2-weighted (T2w) turbo spin-echo images were used (TR =[3500–13,300 ms], TE = [100–120 ms]) with a pixel spacing of 0.39 mm x 0.39 mm (442 scans) or 0.63 mm x 0.63 mm (104 scans) and a slice thickness of 3 mm. The GTV, as segmented for treatment planning by a radiation oncologist on each available MRI, was available as ground truth.
The data set was split into three subsets at the patient level: training set (117 patients, 314 images), validation set (39 patients, 104 images) and test set (39 patients, 106 images). The three subsets were stratified according to FIGO stage [13], because it is a relevant clinical parameter used to describe gynecological tumors.
Network architecture and training procedure
The nnU-Net framework was used in this work. This framework automatically configures the parameters needed for preprocessing, network architecture and training for each specific task. The loss function was a combination of the Dice loss [14] and cross entropy loss. We used the stochastic gradient descent (SGD) optimizer with learning rate scheduler and early stopping based on the validation loss as criterion to choose the best model. Dropout, data augmentation and weight decay were used as regularization techniques. Further details on the training procedure can be found in the Additional file 1.
Experiment overviewGeometric comparison
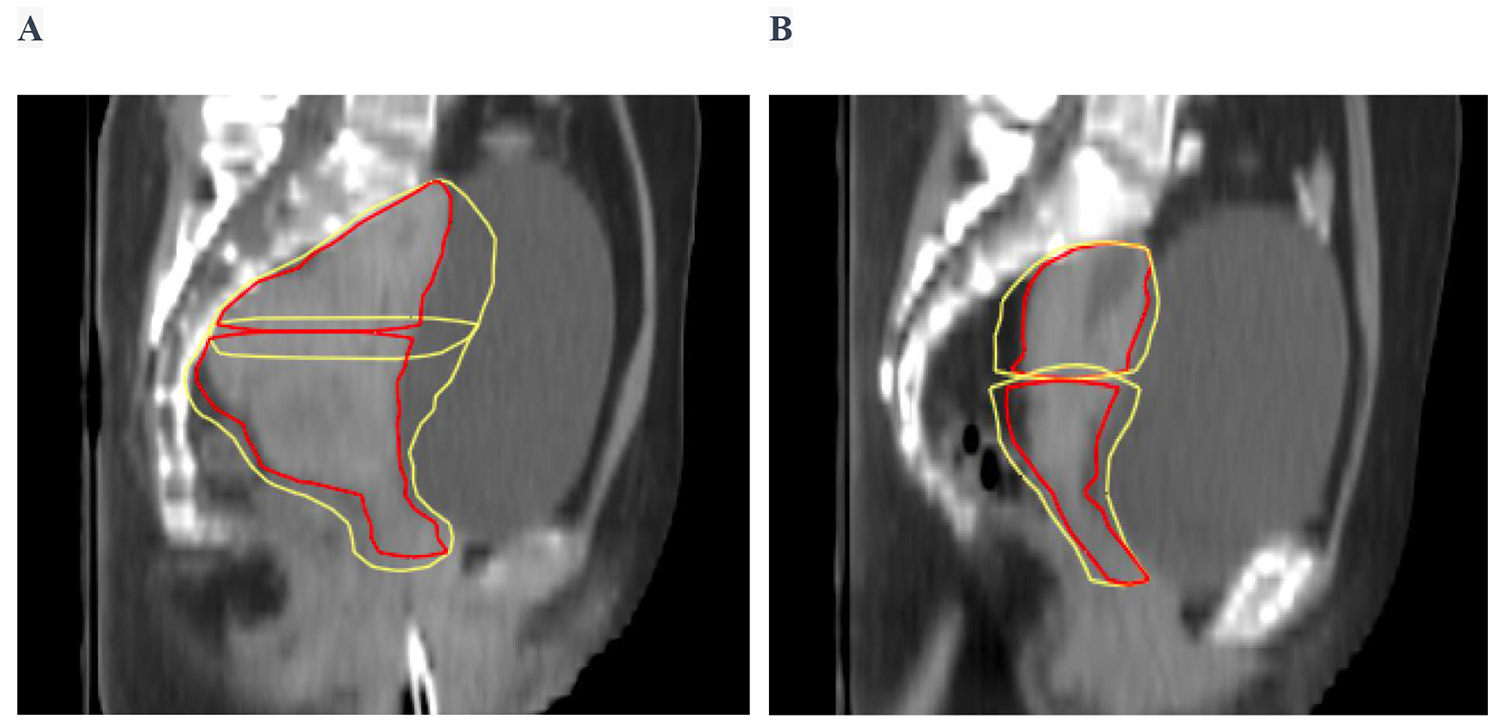
The automatic segmentations were compared to the manual segmentations of the GTV that were performed by a radiation oncologist for treatment planning for the patients on the separate test set. The automatic segmentations were compared to the manual segmentations using common segmentation metrics: Dice, 95th HD and MSD, which were implemented using the Python package by DeepMind (https://github.com/deepmind/surface-distance). The segmentation results were additionally compared among patients with different FIGO stage and GTV volume. For the volume analysis, the patients of the test set were allocated to four volume ranges containing the same number of images in each bin.
Attention maps were computed for four different examples to highlight which parts of the input image were relevant for the network to decide on a segmentation. The attention maps were then qualitatively compared to the binary segmentations to investigate if the over-/under-segmentations of the network were on specific areas, therefore highlighting anatomically challenging regions. The attention maps were defined as the activations of the last layer of the nnU-net (i.e. before binarizing).
Dosimetric comparison
To assess if the differences between the automatic segmentations and manual segmentations would result in differences in dose-volume parameters, we calculated the D98 and the D90 for both segmentations on the clinical dose distribution used for the treatment. These dose parameters were chosen in accordance with the Embrace II guidelines [1]. The values for the manual segmentations represent the actual treatment parameters for the patients. The dosimetric impact of using automatically segmented structures was defined as the difference between these parameters compared to the clinical values (ΔD90 and ΔD98). The dosimetric impact was also reported as a relative measure by dividing the absolute difference on the dose parameters by the dose parameter on the manual segmentation (ΔD90rel and ΔD98rel). The dosimetric results were also compared for patients with different FIGO stage and GTV volume.
Statistics
The chi-square test for independence was used to confirm that the training, validation and test sets were balanced in terms of FIGO stage. The Kruskal-Wallis H test was used to assess differences among patients of different FIGO stage and GTV volume. If significant differences were found, Dunn’s test with Bonferroni correction was used for the post-hoc analysis. A p-value of 0.05 was considered statistically significant. The SciPy Python package (version 1.5.4) and Python 3.9 were used for the statistical analysis.

留言 (0)